
Sample Category Title
Currencies: USD/JPY, EUR/JPY And EUR/USD Drifting South
Sunrise Market Commentary
- Rates: US 10-yr yield breaks above 2.5%, heading to 2016/2017 highs
The technical break of the US 10-yr yield suggests a move to 2.63%/2.64% and thus more downside for the US Note future. Higher oil prices, rising inflation expectations and more signs of global monetary policy normalization are at play. US inflation readings (tomorrow and Friday) and German wage negotiations have the potential to accelerate the move. - Currencies: USD/JPY, EUR/JPY and EUR/USD drifting south
Yesterday, yen strength was the name of the game and it looks that this trend might continue today. The dollar is a good second best. The eco calendar is thin today. A less buoyant risk sentiment might reinforce the rebound of the yen. Sterling hardly profits from the UK government reshuffle
The Sunrise Headlines
- US stock markets ended marginally higher yesterday (+0.1%) with the Dow Jones outperforming (+0.4%). Most Asian stock markets lose some ground overnight with China underperforming.
- China's producer prices rose at their slowest pace in 13 months in December, as the government's war against winter smog dented factory demand for raw materials in a sign the world's second largest economy has started to slow.
- US job openings fell for a second straight month in November, with declines in the manufacturing and real estate sectors. The monthly JOLTS also found that layoffs dropped to a six-month low, showing continued labour market strength.
- Italy's 5-Star leader Luigi Di Maio says that he doesn't think the country needs to leave the euro anymore because the French-German alliance isn't as strong as in the past, Corriere della Sera reports
- Global growth appears to have peaked, with demographics, a lack of investment, a slowing in productivity gains and tightening monetary policy placing limits on economic expansion, the World Bank said.
- The EU is systematically warning UK companies of a regulatory chill after Brexit as it seeks to accelerate the private sector's preparations for a no-deal UK exit, according to recent legal notices reviewed by the FT.
- Today's eco calendar contains UK industrial production and US import/export prices. Germany and the US tap the market. Chicago Fed Evans discusses the economic outlook
Currencies: USD/JPY, EUR/JPY And EUR/USD Drifting South
USD/JPY, EUR/JPY and EUR/USD all drifting south
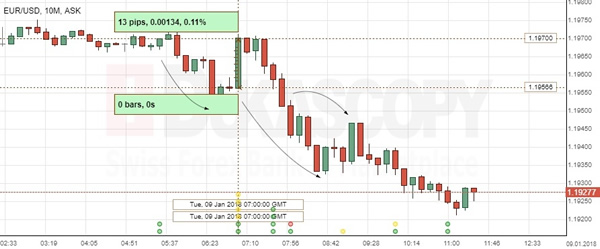
The swings in the yen took centre stage on FX markets yesterday. The yen rose against most majors. The BOJ bought fewer long-dated bonds, raising speculation that it might consider a first step to a less easy monetary policy. The yen held strong and USD/JPY closed the day at 112.65. The dollar was a good second best. The trade-weighted dollar (DXY) rebounded of recent lows, supported by higher US yields. EMU eco data remained very strong, but didn't help the euro. The correction in EUR/USD and EUR/JPY longs that started on Friday, continued. EUR/USD closed the day at 1.1937. EUR/JPY dropped to 134.47, compared with an intraday top of 136.64 on Friday.
The equity rally lost momentum overnight, but the correction is limited given recent gains. Yesterday's rise of the yen continues. USD/JPY trades near 112.30. EUR/USD trades in the 1.1930 area, holding with reach of yesterday's ST correction low. The eco calendar is again only modestly interesting. US import prices will be published. Markets are growing more sensitive to price data. A small reaction is possible in case of a big surprise, but the PPI's and CPI later this week are more important. This morning, it looks that the FX trends of the previous days continue. A less buoyant risk sentiment might support further yen gains. The decline of USD/JPY and EUR/JPY also weighed on EUR/USD earlier this week. The EUR/USD decline might slow if the rise in US yields slows. Even so, we see no trigger for a sharp EUR/USD rebound right now. The price action since Friday suggest that the topside in EUR/USD is rather well protected. In a broader perspective, slightly disappointing payrolls didn't cause USD damage. EUR/USD 1.2092 resistance survived. This week's US price data are a next reference for USD trading. Recently, the greenback suffered as the global recovery might force other major CB's to join policy normalisation. We keep the hypothesis that enough good news on the euro/'bad news' on the USD is discounted and that a sustained break beyond 1.2092 is not evident.
Yesterday, sterling held a tight sideways range against the euro and declined against a stronger dollar. The UK government reshuffle had no big impact. UK production and trade balance data will be published today. Production is expected rather solid. However, we don't expect a the data to be really supportive for sterling. The EUR/GBP correction might slow (underlying GBP weakness), but a rebound will be difficult if EUR/USD remains under pressure. EUR/GBP 0.8700/60 support looks solid. We keep a EUR/GBP buy-on-dips in case of return action to 0.87.
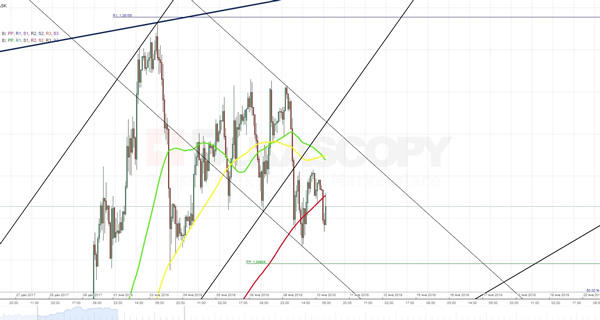
USD/JPY: repositioning out of yen-shorts continues
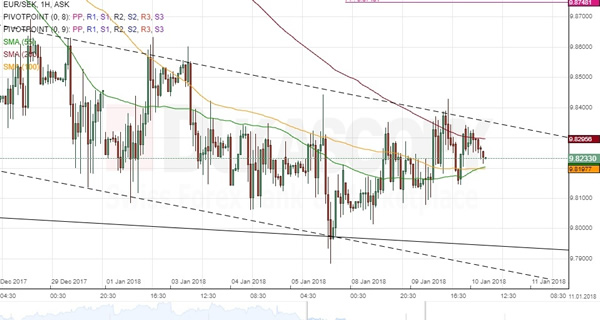
EUR/SEK 1H Chart: Pair Trades In Falling Wedge
EUR/SEK has been trading in a channel up since late 2016. During its last wave down which started mid-December, the common European currency has likewise formed a falling wedge. It tested the bottom boundary of this pattern on January 5 and has since edged slightly higher. From technical point of view, the Euro should approach the upper wedge line in the 9.84/86 territory. Meanwhile, the pair has been currently stranded between the 55-, 100– and 200-hour SMAs in a diminishing trading range. It is likely that a breakout from this area would determine the subsequent direction. Technical indicators show that the southern barrier might surrender under the bearish pressure, thus possibly sending the Euro down to 9.76 area where the monthly S1 and the weekly S2 are located. An upside breakout, however, could result in a test of the 9.90 mark within the following week or more.
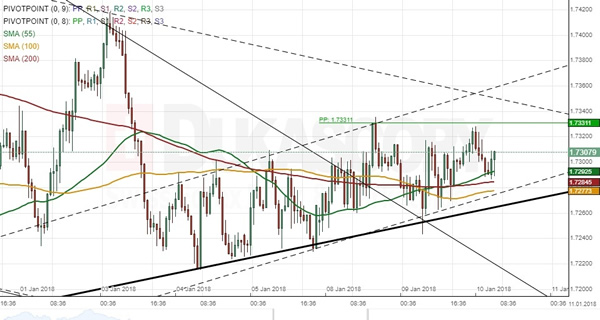
GBP/AUD 1H Chart: Pound Remains Sticky To Channel Line
The Pound has been constrained by an ascending channel against the Aussie since mid-July. The lower boundary of this long-term pattern was reached last week. The pair, however, has since remained trading along this line. The Pound's inability to initiate a new wave up suggests that it might breach the given pattern in the nearest time. An early indication that such a scenario might occur could be a breakout of the 55-, 100– and 200-hour SMAs circa 1.7280. On the other hand, technical indicators flash bullish signals during the following week, thus pointing to a minor weakness which could be followed by a period of appreciation. A possible upside target for the following two weeks might be the combined resistance of the monthly PP and the weekly R2 circa 1.75.
EURUSD Analysis: Expectedly Slides To Monthly PP
The appreciation of the Dollar continued on Tuesday, as expected. After reaching support level set up by the monthly PP at 1.1917 the currency rate resumed the surge. However, recovery of the Euro is unlikely to last for long due to resistance formed, first, by the weekly S2 and the 55-hour SMA and, second, by the weekly S1 in conjunction with the 100- and 200-hour SMAs. From daily perspective, the pair is expected to continue moving towards the lower boundary of a three-month long ascending channel. In support of this assumption, two-thirds of all pending orders in both in 50- and 100-pip range are set to sell. Nevertheless, there is a need to take into account that the 61.8% Fibonacci retracement level located at 1.1887 might temporarily halt the downfall.
GBPUSD Analysis: Falls Towards 1.3500
In result of the previous trading session the rate has broken through support line of a long ascending channel, thus ending the consolidation phase. Even though the pair has already crossed the 200-hour SMA and there are signs of a forming descending channel, a bunch of technical indicators suggest that an area around the 1.3500 mark represents strong support level, which is likely to lead to a rebound. In that case, the cable might jump back to 1.3550. However, without additional impulse, for instance, from some fundamental event the further surge is unlikely because of combination of the 55- and 100-hour SMAs. Nevertheless, from daily perspective it seems that deprecation of the Pound will continue at least until the rate will reach the 50% Fibonacci retracement level at 1.3485.
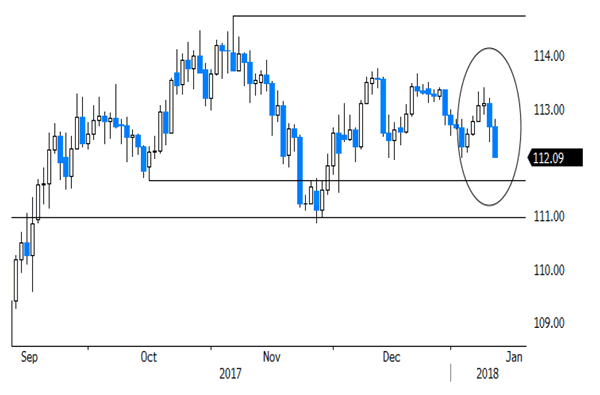
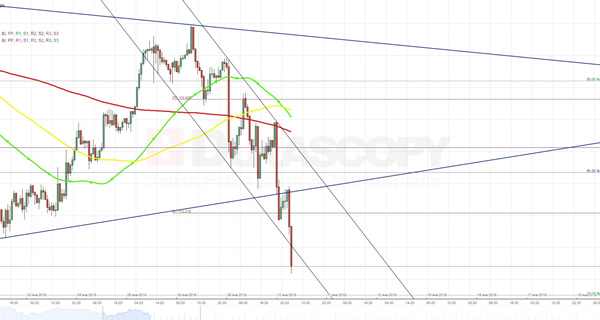
USDJPY Analysis: Breaks From Triangle
In accordance with expectations, the Dollar continued to lose value against the Yen. However, the downfall appeared to be stronger than expected, as the currency rate managed to break through the lower trend-line of a six-week long symmetrical triangle. Accordingly, the closest support barrier that might turnaround the pair is located near the 112.05 mark, which has successfully managed to stop the rate from falling during the previous three attempts. In case this barrier is broken, the pair will have an empty area up until the 200-day SMA at 111.72 and the 23.6% Fibonacci retracement level at 111.65. Generally, there is a need to take into account that majority of pending orders in 100-pip range are set to buy plus the aggregate market sentiment remains almost 53% bullish.
XAUUSD Analysis: Tests 200-Hour SMA
Contrary to expectations, gold traders decided not to wait this week's American fundamental data releases and pushed the pair from symmetrical triangle pattern. Despite combined support level formed by the lower trend-line of an ascending channel and the 200-hour SMA near the 1,310.00 mark, the exchange rate is projected to continue moving downwards. Such assumption is based on picture seen on daily chart, where the pair has recently made a rebound from the upper edge of a four-month long descending channel. Such scenario is partially confirmed by allocation of pending orders, which are set to sell. In that case the fully-fledged might happen only when the pair will reach the 50% Fibonacci retracement level located at 1,297.200.
EUR/USD: German Industrial Production M/M
The Euro recieved a hopeful sign to get back a stronger position against the US Dollar, but continued to decline after the better-than-anticipated economic report on Germany.
German industrial output and the country's exports grew more than anticipated in November, suggesting lingering expansion in the Europe's biggest economy in this year, ignoring political deadlock, when new coalition government was not formed. Industrial production gained 3.4% in November, the strongest gain since late 2009, the Federal Statistics Office reported. Meanwhile, exports increased at a seasonaaly adjusted 4.1% pace, while imports added 2.3% in the same month. Both readings pushed the trade surplus to €22.3B from €19.9B registered in October.
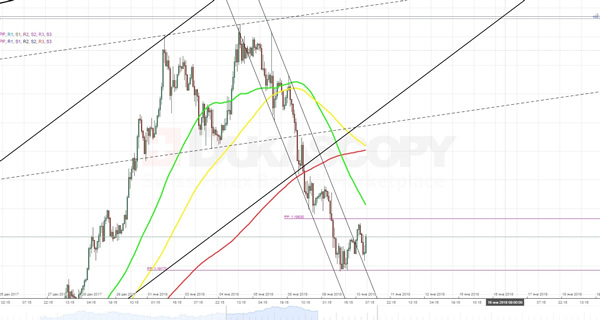
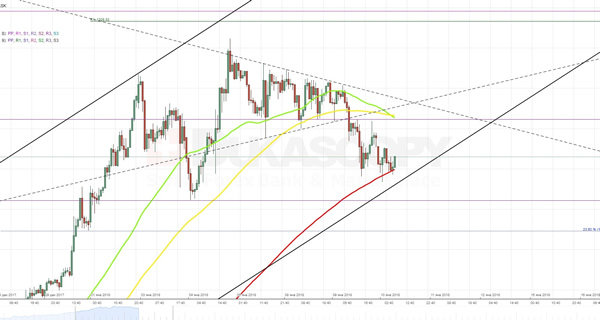
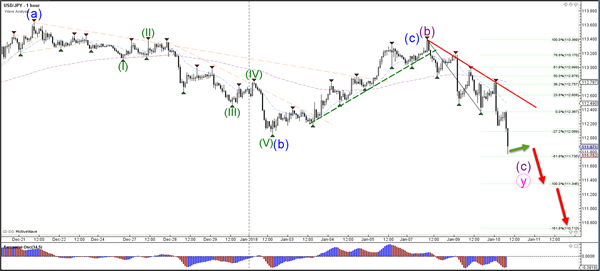
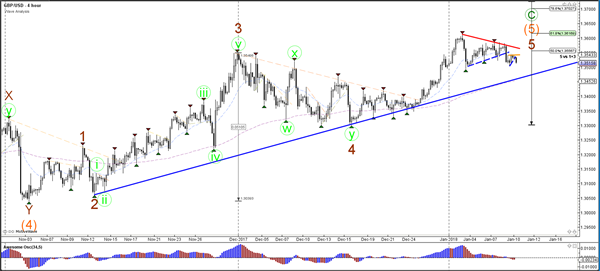
Daily Wave Analysis: USD/JPY Bearish Breakout Is Aiming At 110 Round Level
Currency pair USD/JPY
The USD/JPY broke below support again (dotted blue) and has invalidated the bullish pattern and outlook. A larger bearish correction is now most likely and price could test the bottom of wave W (pink) at 111 or even break the bottom and move towards the round levels of 110.50 and 110
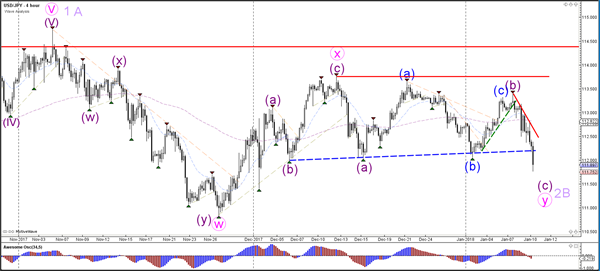
The USD/JPY bearish momentum looks strong and price could continue lower after price builds and breaks a chart pattern.
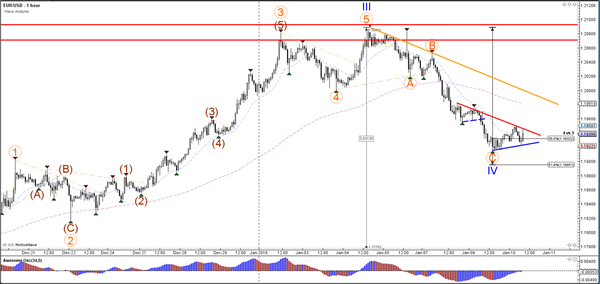
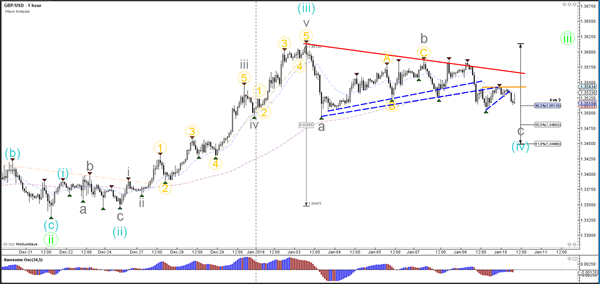
Currency pair EUR/USD
The EUR/USD bearish breakout fell towards the Fibonacci levels of wave 4 vs 3 (blue) and has arrived at the 50-61.8% support zone. A break below the support trend line (blue) and 61.8% Fib of wave 4 makes a bearish scenario more likely. In that case, the alternative outlook is that price is not completing a 123 (pink) but a larger ABC correction.
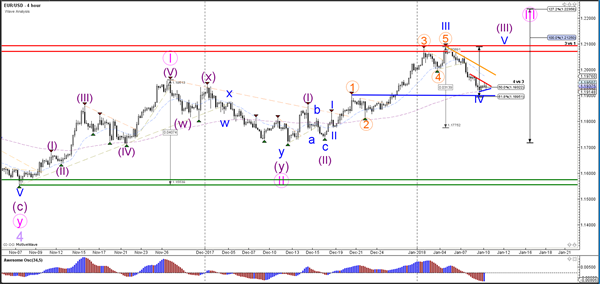
The EUR/USD broke the support trend line and continued with the bearish price movement. A break above the resistance trend line (red) could be a first sign that wave C is over whereas a break below support could see price fall further. A push below the 61.8% Fib makes this wave 4 unlikely.
Currency pair GBP/USD
The GBP/USD broke the support (dotted blue) of the corrective pattern. A break above the resistance trend lines (orange/red) could see price move towards the Fibonacci targets whereas a break below support (blue) could see price make a larger bearish reversal.
The GBP/USD broke multiple trend lines which could be part of ABC corrective pattern as long as price stays above the 50-61.8% Fib zone of wave 4.
Oil Market Will Focus On The EIA’s Inventory Report Today
Market movers today
It is time for inflation in Norway and Denmark for December. We look for Norwegian core CPI to increase from 1.0% y/y to 1.2% y/y (in line with consensus). Danish inflation is expected to be flat at 1.3% y/y.
In Sweden, Riksbank minutes are due as well as industrial data on both orders and production for November (for more on Scandi see next page).
On the global front, UK industrial production and US import prices are not likely to move the markets. The Fed's Evans (non -voter, dovish) is due to speak this afternoon at 15:00 CET on the economic and policy outlook (includes Q&A).
After the large drop in US crude stocks seen in the API inventory report yesterday, the oil market will focus on the EIA's inventory report today.
Selected market news
In China, CPI inflation rose to 1.8% y/y in December from 1.7% y/y in November, while PPI inflation slowed to 4.9% y/y in December from 5.8% y/y in November , according to data released overnight . Hence, inflationary pressures remain subdued in China.
Minneapolis Fed's Kashkari reiterated his views on monetary policy yesterday, advocating for an easier monetary policy stance to push inflation and wage growth higher, stressing that lower rates are likely to have a structural cause, that inflation is low everywhere, which signals that it is not due solely to mismeasurement and that the Fed should take its cue from the yield curve.
In Italy, comments from Five Star PM candidate Luigi Di Maio suggests that its stance towards the euro is becoming more moderate as he said that it is no longer time for Italy to leave the euro as the French-German alliance is not as strong as in the past . There was limited reaction in EUR/USD to the comments.
Oil prices rallied sharply with the price on Brent crude moving past the USD69/bbl mark. Part of the reason for the rise was the American Petroleum Institute reporting an 11mb drop in crude inventories last week. We stress that in our view the extreme cold winter weather in the US this season can explain most of this decline.