Sample Category Title
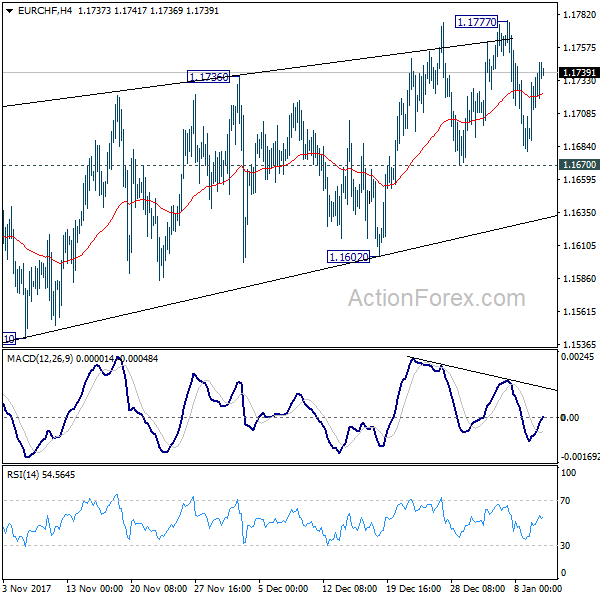
EUR/CHF Daily Outlook
Daily Pivots: (S1) 1.1701; (P) 1.1719; (R1) 1.1756; More...
No change in EUR/CHF's outlook and intraday bias remains neutral at this point. We're holding on to the view that it's close to topping, if not formed. And even in case of another rise, strong resistance should be seen well below 1.2 handle to bring medium term reversal. On the downside, below 1.1670 minor support will turn bias to the downside for 1.1602 support first. Further break of 1.1602 will indicate reversal and turn outlook bearish for 1.1387 and below.
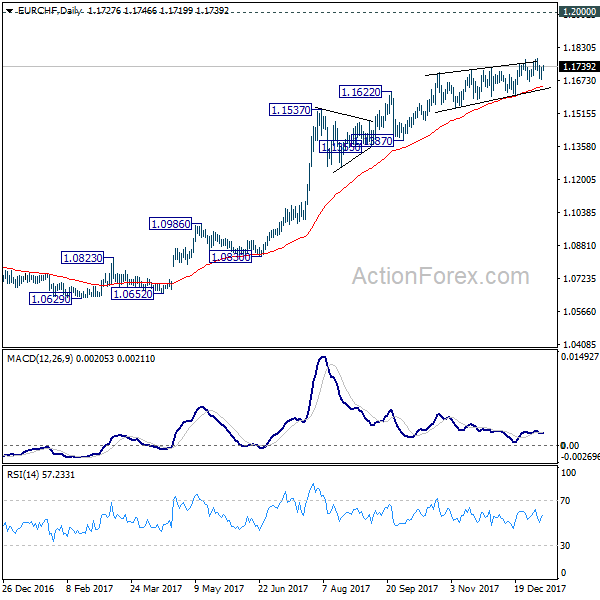
In the bigger picture, while a medium term top could be around the corner, there is no change in the larger outlook. That is, long term rise from SNB spike low back in 2015 is still in progress and would extend. As long as 1.1198 resistance turned support holds, we'll hold on to this bullish view and expect another to prior SNB imposed floor at 1.2000. Though, we'll reassess the outlook if 1.1198 is firmly taken out.
Swiss Unemployment Rate Fell As Expected In December
For the 24 hours to 23:00 GMT, the USD rose 0.62% against the CHF and closed at 0.9834.
Macroeconomic data showed that Switzerland’s seasonally adjusted unemployment rate dropped to 3.0% in December, in line with market expectations. In the prior month, unemployment rate had registered a revised reading of 3.1%.
On the contrary, the nation’s real retail sales slid 0.2% on an annual basis in November, after recording a revised drop of 2.6% in the prior month.
In the Asian session, at GMT0400, the pair is trading at 0.9833, with the USD trading a tad lower against the CHF from yesterday’s close.
The pair is expected to find support at 0.9785, and a fall through could take it to the next support level of 0.9737. The pair is expected to find its first resistance at 0.9862, and a rise through could take it to the next resistance level of 0.9891.
The currency pair is showing convergence with its 20 Hr moving average and trading above its 50 Hr moving average.

Canada’s Housing Starts Declined In December
For the 24 hours to 23:00 GMT, the USD rose 0.33% against the CAD and closed at 1.2462.
On the macro front, Canada's seasonally adjusted housing starts eased to a level of 217.0K in December, less than market expectations for a drop to a level of 211.0K. In the prior month, housing starts had registered a revised level of 251.7K.
In the Asian session, at GMT0400, the pair is trading at 1.2462, with the USD trading flat against the CAD from yesterday's close.
The pair is expected to find support at 1.2414, and a fall through could take it to the next support level of 1.2366. The pair is expected to find its first resistance at 1.2494, and a rise through could take it to the next resistance level of 1.2526.
Ahead in the day, investors would keep a watch on Canada's new house price index for November.
The currency pair is showing convergence with its 20 Hr moving average and trading above its 50 Hr moving average.

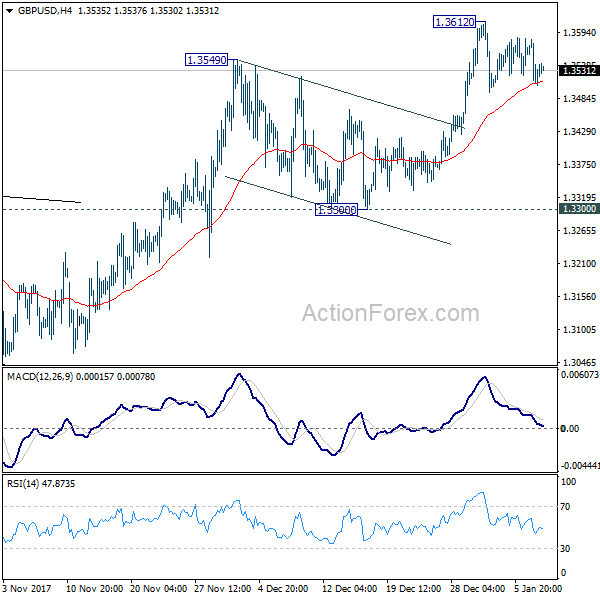
Can GBP/USD Hold 1.3480 Ahead Of UK’s Production Report?
Key Highlights
- The British Pound formed a short-term top at 1.3612 and declined against the US Dollar.
- There is a contracting triangle forming with current support at 1.3500 on the 4-hours chart of GBP/USD.
- The pair must hold the 1.3480-1.3500 support in order to initiate a fresh upside move.
- Today, the UK's Industrial Production for Nov 2017 will be released, which is forecasted to increase by 0.3% (MoM).
GBPUSD Technical Analysis
The British Pound traded higher during the start of January 2018 against the US Dollar. The GBP/USD pair traded as high as 1.3612 before starting a downside correction.
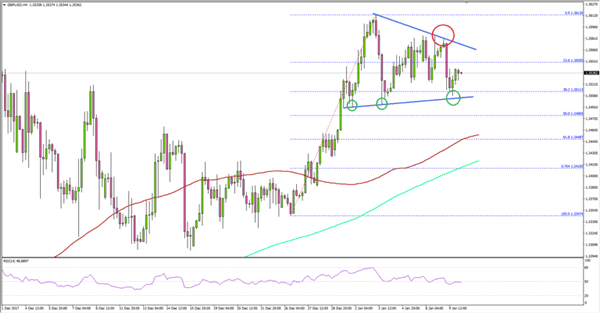
During the mentioned correction, the pair broke the 1.3600 and 1.3550 support levels. The pair even settled below the 23.6% Fib retracement level of the last wave from the 1.3347 low to 1.3612 high.
However, the downside move was contained by the 1.3500 support area. More importantly, the 50% Fib retracement level of the last wave from the 1.3347 low to 1.3612 high is at 1.3480. Therefore, the 1.3480 and 1.3500 support levels are significant for the next move in GBP/USD.
At present, it seems like there is a contracting triangle forming with support at 1.3500 on the 4-hours chart. Should there be a break of 1.3500 followed by a close below 1.3480, the pair could accelerate declines toward the 1.3440 level.
On the flip side, the triangle resistance is at 1.3560. A successful break of 1.3560 would open the doors for a fresh rally towards or above 1.3600.
Today's Industrial Production release for Nov 2017 in the UK may impact the next move in GBP/USD either above 1.3560 or below 1.3480. The market is looking for an increase of 0.3% compared with the previous month.
If the actual beats the forecast, GBP/USD could gain traction and move above 1.3560. On the other hand, disappointing figures will most likely put a lot of pressure on buyers. In the second case, GBP/USD could break the 1.3480 support for more losses toward 1.3440 and 1.3400.
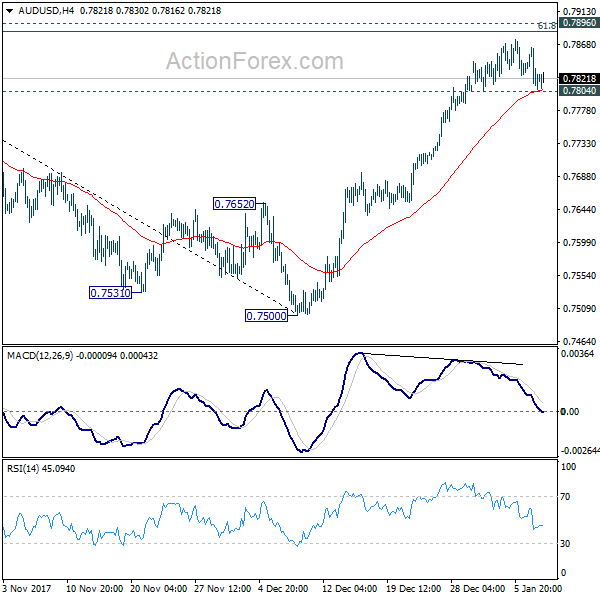
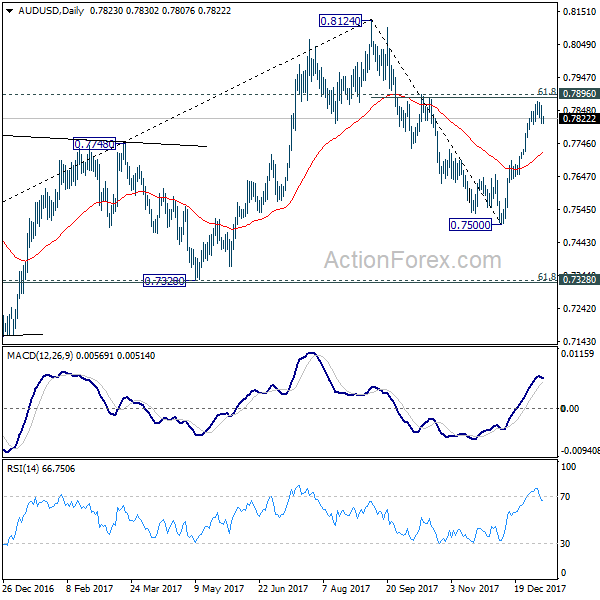
AUD/USD Daily Outlook
Daily Pivots: (S1) 0.7799; (P) 0.7831; (R1) 0.7856; More...
Intraday bias in AUD/USD stays neutral for the moment. Considering bearish divergence condition in 4 hour MACD, even in case of another rise, upside should be limited by 0.7896 cluster resistance (61.8% retracement of 0.8124 to 0.7500 at 0.7886) resistance zone to bring short term topping. Break of 0.7804 minor support will turn bias to the downside for 55 day EMA (now at 0.7719).
In the bigger picture, we're still slightly favoring the case that corrective rise from 0.6826 medium term bottom is completed at 0.8124, after hitting 55 month EMA (now at 0.8032). But stronger than expected rebound from 0.7500 is dampening this bearish view. On the downside, break of 0.7500 will target 0.7328 key cluster support (61.8% retracement 0.6826 to 0.8124 at 0.7322) to confirm this bearish case. But break of 0.8124 will extend the rise from 0.6826 to 38.2% retracement of 1.1079 (2011 high) to 0.6826 (2016 low) at 0.8451 before completion.
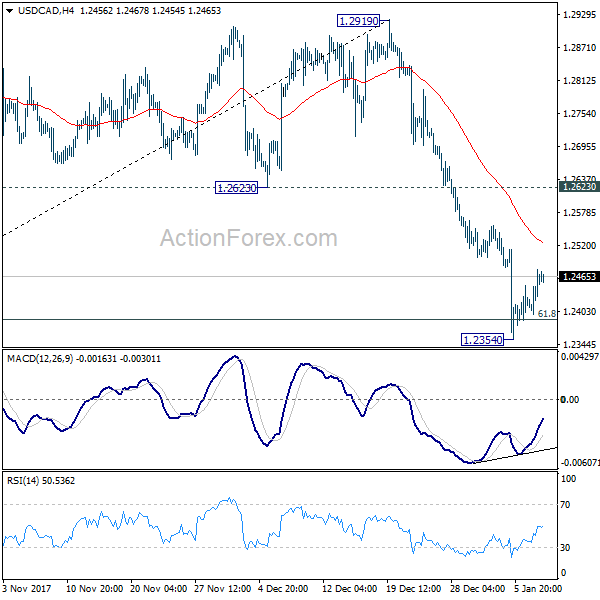
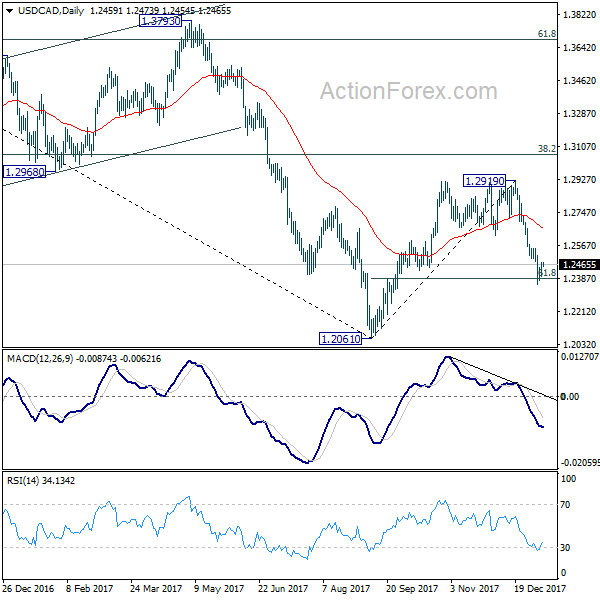
USD/CAD Daily Outlook
Daily Pivots: (S1) 1.2414; (P) 1.2445; (R1) 1.2494; More....
A temporary low is formed at 1.2354 after USD/CAD hit 61.8% retracement of 1.2061 to 1.2919 at 1.2389. Intraday bias is turned neutral first for consolidations. As long as 1.2623 support turned resistance holds, deeper decline is expected. Break of 1.2354 will extend the fall from 1.2910 to retest 1.2061 low.
In the bigger picture, current development argues that rebound from 1.2061 has completed at 1.2919, rejected by 55 week EMA (now at 1.2850) and kept below 38.2% retracement of 1.4689 to 1.2061 at 1.3065. The development also suggests that long term fall from 1.4689 is not completed yet. Decisive break of 1.2061 low will target 61.8% retracement of 0.9406 to 1.4689 at 1.1424. This will now be the favored case as long as 1.2919 resistance holds.
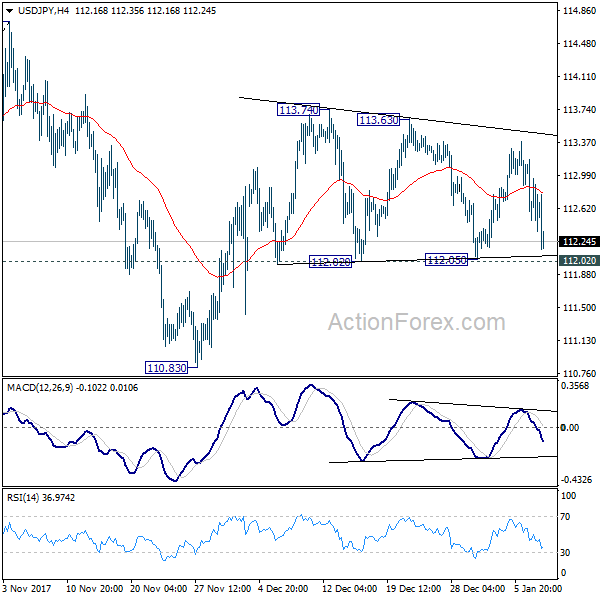
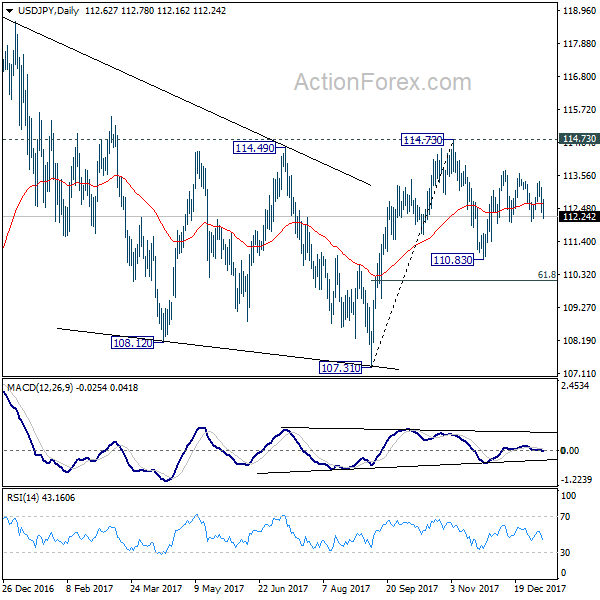
USD/JPY Daily Outlook
Daily Pivots: (S1) 112.28; (P) 112.72; (R1) 113.09; More...
Intraday bias in USD/JPY remains neutral as it's bounded in range of 112.02/113.74.Also, outlook remains cautiously bullish as long as 112.02 holds and further rise is in favor. Break of 113.74 will resume the rebound from 110.83 and target 114.73 key resistance. Decisive break there will carry larger bullish implications. However, break of 112.02 will likely extend the corrective pattern from 114.73 with another leg through 110.83 support.
In the bigger picture, we're holding on to the view that correction from 118.65 is completed at 107.31. And medium term rise from 98.97 (2016 low) is going to resume soon. Sustained break of 114.73 should affirm our view and send USD/JPY through 118.65. However, break of 107.31 will dampen this view and extend the medium term fall back to 98.97 low.
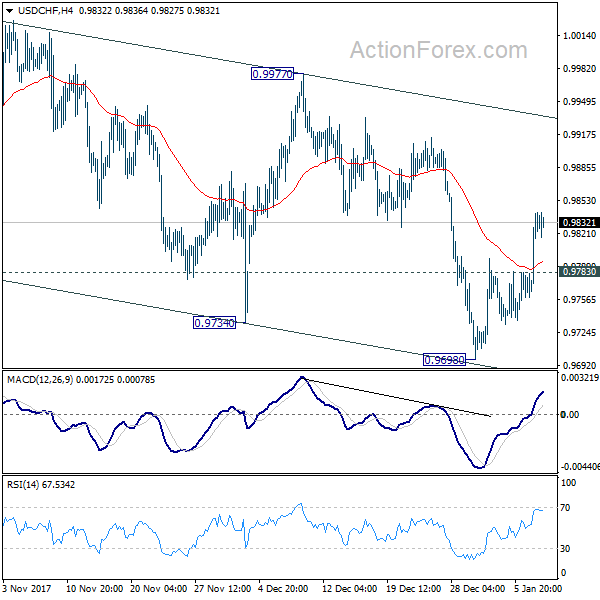
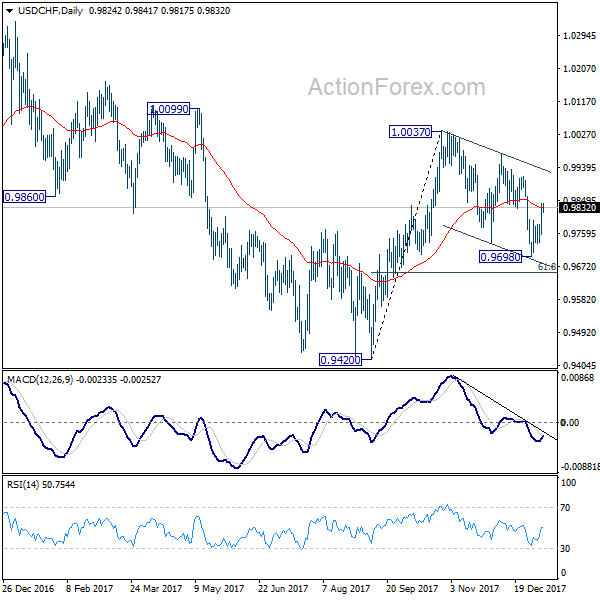
USD/CHF Daily Outlook
Daily Pivots: (S1) 0.9780; (P) 0.9811; (R1) 0.9863; More....
Intraday bias in USD/CHF remains on the upside for 0.9977 resistance. Correction from 1.0037 could have completed three waves down to 0.9698. Break of 0.9977 will confirm this view and resume whole rise from 0.9420 through 1.0037 high. On the downside, below 0.9783 minor support will turn intraday bias neutral first. But this bullish case will be favored as long as 0.9698 support holds.
In the bigger picture, range trading continues between 0.9420/1.0342. At this point, 0.9420 appears to be a strong support level. Therefore, in case of decline attempt, we don't expect a firm break of this level. Nonetheless, strong break of 1.0342 is also needed to confirm upside momentum. Otherwise, medium term outlook will stay neutral.
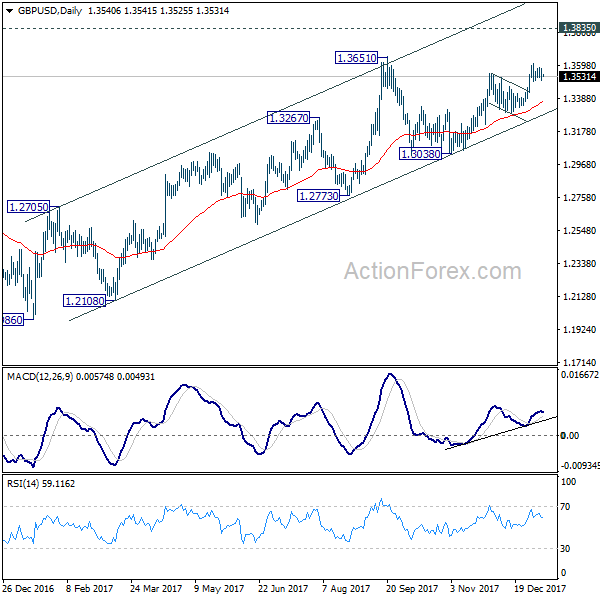
GBP/USD Daily Outlook
Daily Pivots: (S1) 1.3502; (P) 1.3541; (R1) 1.3579; More.....
Intraday bias in GBP/USD remains neutral with focus on 4 hour 55 EMA (now at 1.3512). As long as 4 hour 55 EMA holds, further rally is expected. Above 1.3612 will target 1.3651 key resistance first. Break will resume medium term rise from 1.1946 and target key resistance level at 1.3835. However, sustained break of 4 hour 55 EMA will turn focus back to 1.3300 support instead.
In the bigger picture, the break of long term trend line resistance from 1.7190 (2014 high) is seen as a sign of long term reversal. However, rise from 1.1946 (2016 low) is not impulsive looking. And the pair is limited below 1.3835 key resistance. Hence, we won't turn bullish yet and would continue to monitor the development. On the downside, break of 1.3038 support will now indicate that rebound from 1.1946 has completed and turn outlook bearish. Meanwhile, sustained break of 1.3835 should at least send GBP/USD to 38.2% retracement of 2.1161 (2007 high) to 1.1946 (2016 low) at 1.5466.
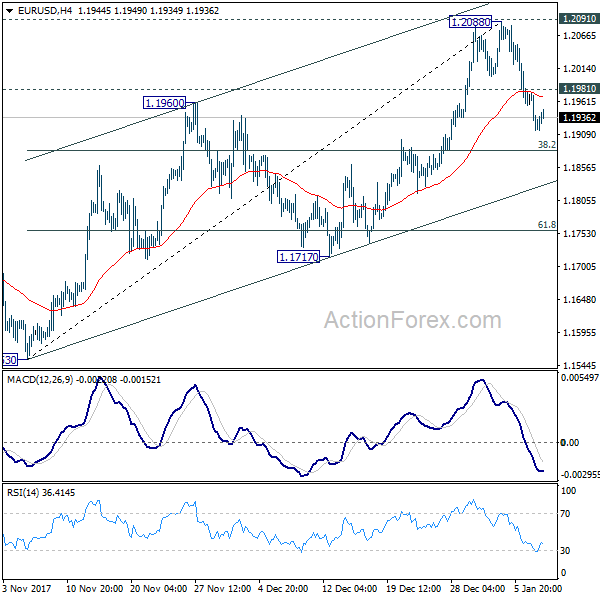
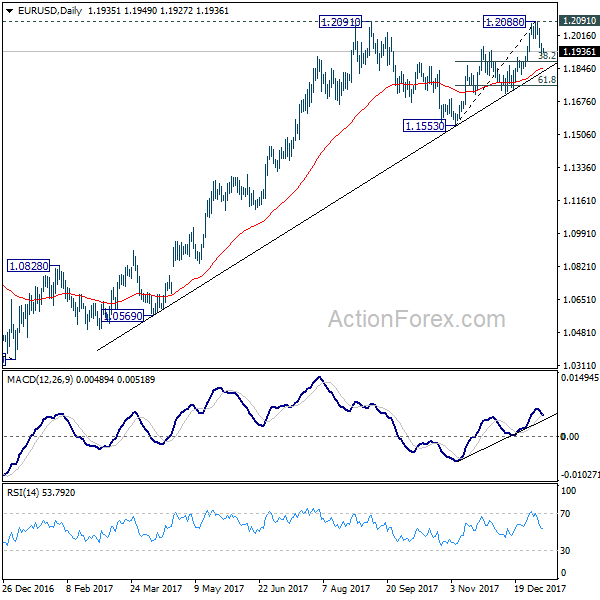
EUR/USD Daily Outlook
Daily Pivots: (S1) 1.1908; (P) 1.1942 (R1) 1.1968; More....
Intraday bias in EUR/USD remains on the downside as fall from 1.2088 is in progress. Such decline could be the the third leg of consolidation pattern from 1.2091. Break of 38.2% retracement of 1.1553 to 1.2088 at 1.1884 will target 61.8% retracement at 1.1757 and below. On the upside, above 1.1981 minor resistance will turn bias neutral first. But firm break of 1.2091 is needed to confirm up trend resumption. Otherwise, we'd expect more corrective trading in near term.
In the bigger picture, rise from 1.0339 medium term bottom is still seen as a corrective move for the moment. Therefore, in case of another rally, we'd be expect 38.2% retracement of 1.6039 (2008 high) to 1.0339 (2017 low) at 1.2516 to limit upside and bring reversal. That is also close to 61.8% projection of 1.0569 to 1.2091 from 1.1553 at 1.2494.