
Sample Category Title
Canadian Housing Starts Moderate in December
Highlights:
- Housing starts in December dropped as expected by 13.8% to an annualized 217k from November's outsized 252k.
- For 2017 as a whole starts rose a solid 11.4% to 221k from 198k in 2016.
- The weakness in December was concentrated in urban multiples (22.0%) and regionally by sizeable declines in Ontario (35.1%) and Alberta (33.2%).
Our Take:
As was widely expected, housing starts declined 13.8% in December to an annualized 217k units from November's outsized 252k with the most recent month's activity more in line with the average level of permits over the last six months of 222k. For 2017 as a whole, starts were up a solid 11.4% to 221k which represented the highest level of activity since 2007. By unit type the December weakness reflected urban multiples dropping 22.0% though this followed strong gains the previous two months of 16.3% and 12.5%. Regionally the weakness was concentrated in Ontario where urban starts dropped 35.1% to 61k largely reflecting weakness in the multiples component. However, the decline failed to fully offset the multiples-driven 67.9% surge in November. Starts in Alberta also contributed to the overall decline dropping 33.2% in the month to 23k.
Looking ahead, our expectation is that recent tightening of mortgage lending, further official interest rate increases in both Canada and the U.S. and current poor affordability in a number of key markets will contribute to housing starts continuing to trend lower. Our forecast assumes that starts will drop to 195k this year and 185k in 2019.
WTI Oil Futures at 2½-Year High; Rally Stalls Around 62 Level
WTI oil futures extended the rally after a brief pause and hit 62.53 earlier today, its highest level since May 2015.
Prices have been rising steadily since late December from the mid-58 handle and successfully breached the key 60 mark for the first time in 2 ½ years. Upside momentum has faded and the market has stabilized around the 62 level. The drop down to the low 61s did not yield significant additional weakness and prices bounced back up.
The level at 61 is seen as minor support now and below this the focus turns to the psychological level at 60, which is considered to be strong support.
Failure to hold at 60 would see prices move back into an important consolidation area between 59.50 and 60. Any move lower from this zone would likely see more sellers enter the market. Continued downside momentum would target 58.50. Breaking this support would take WTI back into its prior range (from late November to December).
The bullish phase that began from late December off the mid-58 area is still in progress and there are no signs of a reversal in the trend as long as the market remains above the 60 level. Another attempt upwards and a successful break above today's peak of 62.53 could see the next major resistance coming at the 64 level.
Canada: Housing Starts Pull Back in December, But Remain Healthy
Following November's surge, Canadian housing starts pulled back to 217k (SAAR) in December. The underlying trend remains firm however, with the 6-month moving average at a healthy 227k.
Multifamily starts dropped by 22% in the month, while single-detached starts advanced by 5% in urban areas.
December's drop was largely driven by Ontario, where starts fell 33k to a relatively modest 66k. However, starts were also lower in Alberta (-11k to 23k units) and PEI. On the opposite end of the spectrum, starts were higher in the other 7 provinces, paced by B.C. (+5k to 52k units).
In Toronto, starts declined by 19k to 26k during the month. However, the pace of new home construction in Toronto was almost unchanged in 2017 compared to the year prior. Homebuilding was solid in Montreal in December, with starts increasing by 15k to 40k. Meanwhile, starts crept higher in Vancouver, totalling 34k (compared to 31k in November).
In 2017, starts came in at 221k, up 11% from 2016 and marking the highest level in over a decade. 2017 was a solid year for multi-unit starts, with hefty gains in Quebec, Ontario, Alberta and Manitoba. Construction of single-detached units also increased in 2017, though at a more subdued rate.
Key Implications
Homebuilding pulled back in December, consistent with the narrative of softer permit issuance in recent months. That said, the pace was still solid and held above the rate of household formation. Starts were strong in 2017 overall, backed by economic strength, low interest rates and population growth, with increased construction in both the single-detached and multi-unit markets.
During the fourth quarter the level of starts was about 3% above its third quarter average, bolstering our expectation that residential construction will make a positive contribution to GDP growth during the quarter.
The modest decline in new home construction in December falls in-line with our view that softening economic growth, tighter lending conditions and higher mortgage rates will slow starts activity during 2018. Notably, the updated B20 guidelines were initiated on January 1st and the Bank of Canada is expected to hike their policy rate on January 17th - the third hike in six months.
All in all, a solid pace of starts in 2017 has helped lead to an elevated level of homes under construction, indicating significant housing supply in the pipeline. As these units reach completion, some downward pressure should materialize on prices in coming years.
Dollar Bulls Back in Action as Gold Dips
The Dollar jumped to a fresh weekly high against a basket of major currencies on Tuesday amid market optimism over the US Federal Reserve raising interest rates at least twice in 2018.
There is a suspicion that Dollar bullish investors are starting to look beyond December's disappointing NFP headline figures, and have their sights set on wage growth which held steady at 2.5% to support the Dollar Index. With the economic calendar fairly light today and no real changes to the Greenback's fundamental drivers overnight, price action is likely to dictate where the Dollar Index trades. From a technical standpoint, the Index remains under pressure on the daily charts. Bears may exploit the current technical bounce towards the 92.80 region, to drive prices lower back to 92.00. Alternatively, a decisive breakout above 93.00 invalidates the current bearish setup, with the next level of interest at 93.40.
Euro tumbles to fresh one-week lows
The Euro extended losses against a strengthening Dollar during Tuesday's trading session, with prices dipping to a fresh weekly low at 1.1920 as of writing.
Although further downside could be on the cards for the EURUSD if the Dollar continues to strengthen, losses are likely to be cushioned by the mighty Euro. With Europe's improving economic conditions supporting the Euro and the outlook for the Dollar still somewhat shaky amid low inflation concerns in the States, the EURUSD remains fundamentally bullish. Taking a look at the technical picture, the EURUSD may be in the process of creating a new higher low, with the 1.1920 acting as the first line of defence for bulls. If 1.1920 is breached, then the EURUSD bulls have a final opportunity to elevate prices higher around the pivotal 1.1850 level. A situation where bulls lose control above 1.1850, threatens the current bullish setup consequently inviting bears back into the game.
Currency spotlight – GBPUSD
Sterling bears lingered in the vicinity on Tuesday as the GBPUSD dipped towards the 1.3520 level.
With fundamental drivers behind Sterling's erratic price action revolving around Brexit developments and political risk, the currency's outlook continues to look murky. Focusing on the technical outlook, traders will continue to observe how the GBPUSD reacts around 1.3520. A breakdown followed by sustained weakness below this level, may encourage a decline towards 1.3440.
Gold prices ease as Dollar strengthens
Gold found itself under pressure during Tuesday's trading, amid renewed market expectations of higher US interest rates this year. A strengthening Dollar contributed to the yellow's downside with prices currently trading around $1315.77 as of writing. Although Gold may witness further losses in the short term amid US rate hike expectations, the yellow still remains bullish on the daily charts above $1300. A weekly close above $1320 could signal further upside with $1333 acting as the next level of interest.
EUR/JPY Mid-Day Outlook
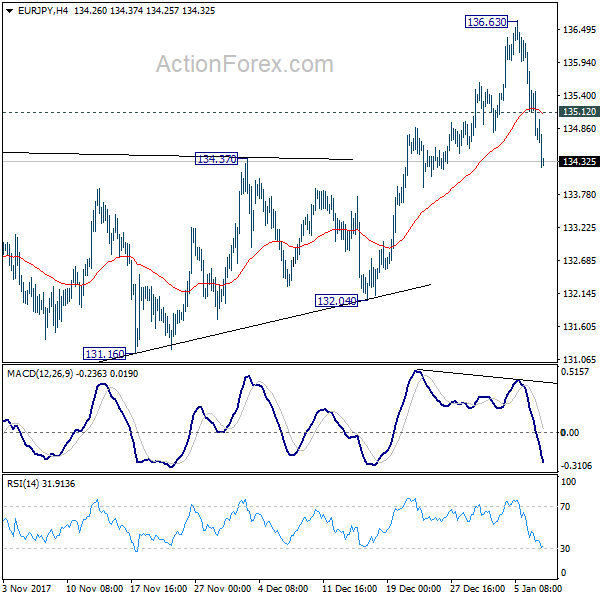
Daily Pivots: (S1) 134.87; (P) 135.59; (R1) 136.05; More....
EUR/JPY's break of 134.39 resistance turned support now suggests that rise from 132.04 has completed at 136.63. It's also seen as an early sign of trend reversal. But it's yet to be confirmed. In any case intraday bias is now on the downside for 132.04 support. Above 135.12 minor resistance will turn intraday bias neutral first. But risk will stay on the downside as long as 136.63 holds.
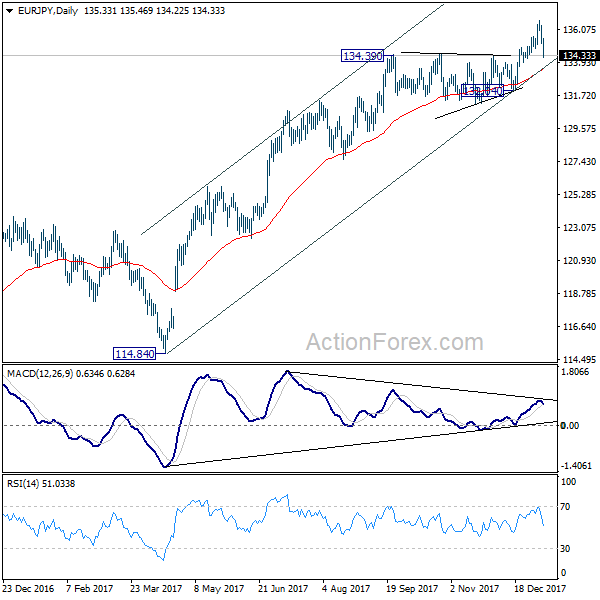
In the bigger picture, medium term rise from 109.03 (2016 low) is seen as at the same degree as the down trend from 149.76 (2014 high) to 109.03 (2016 low). It should now be targeting 141.04/149.76 resistance zone. On the downside, break of 132.04 support is needed to indciate medium term reversal. Otherwise, outlook will stay bullish in case of deep pull back.
EUR/USD Mid-Day Outlook
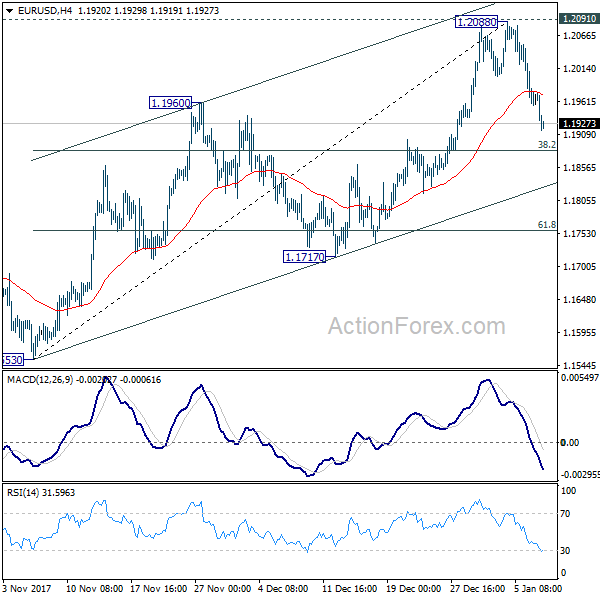
Daily Pivots: (S1) 1.1931; (P) 1.1991 (R1) 1.2028; More....
EUR/USD's fall from 1.2088 is still in progress and intraday bias remains on the downside for 38.2% retracement of 1.1553 to 1.2088 at 1.1884. Such decline might be the third leg of consolidation pattern from 1.2091. Break of 1.1884 will target 61.8% retracement at 1.1757 and below. On the upside, firm break of 1.2091 is needed to confirm up trend resumption. Otherwise, we'd expect more corrective trading in near term.
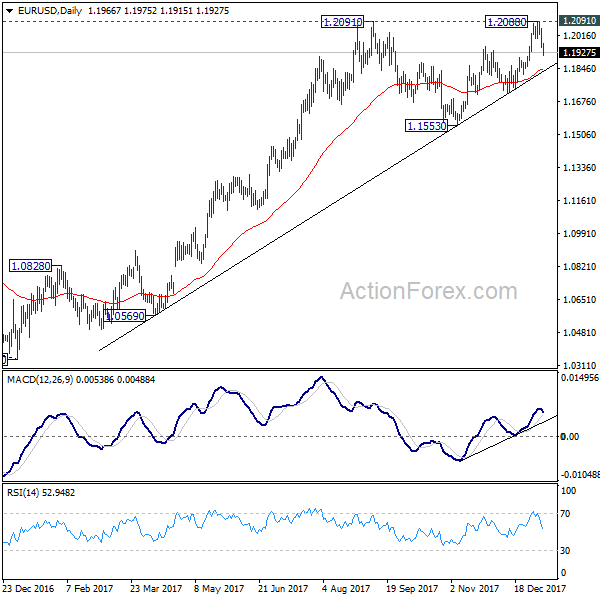
In the bigger picture, rise from 1.0339 medium term bottom is still seen as a corrective move for the moment. Therefore, in case of another rally, we'd be expect 38.2% retracement of 1.6039 (2008 high) to 1.0339 (2017 low) at 1.2516 to limit upside and bring reversal. That is also close to 61.8% projection of 1.0569 to 1.2091 from 1.1553 at 1.2494.
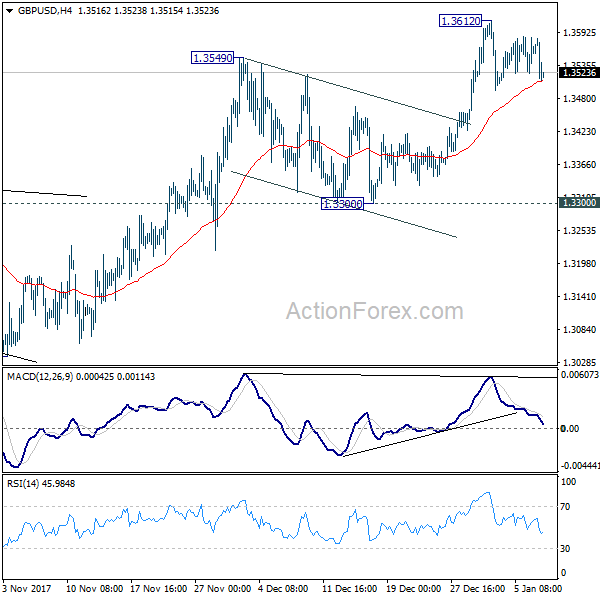
GBP/USD Mid-Day Outlook
Daily Pivots: (S1) 1.3530; (P) 1.3558; (R1) 1.3593; More.....
Outlook in GBP/USD is unchanged. Intraday bias stays neutral. As long as 4 hour 55 EMA (now at 1.3509) holds, further rally is expected. Above 1.3612 will target 1.3651 key resistance first. Break will resume medium term rise from 1.1946 and target key resistance level at 1.3835. However, sustained break of 4 hour 55 EMA will turn focus back to 1.3300 support instead.
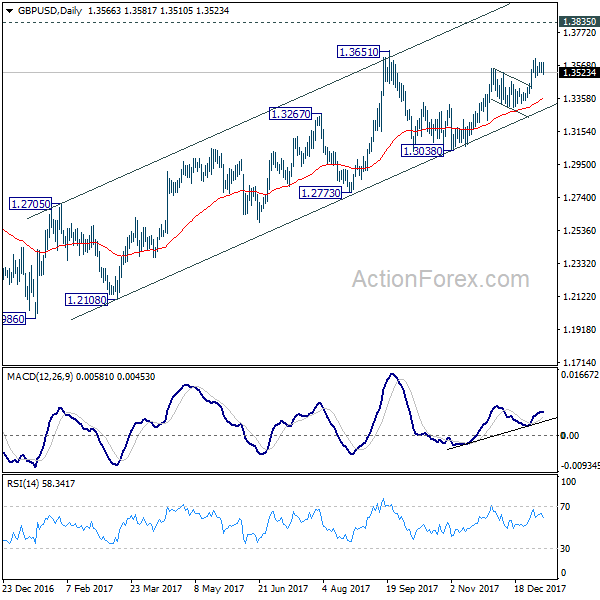
In the bigger picture, the break of long term trend line resistance from 1.7190 (2014 high) is seen as a sign of long term reversal. However, rise from 1.1946 (2016 low) is not impulsive looking. And the pair is limited below 1.3835 key resistance. Hence, we won't turn bullish yet and would continue to monitor the development. On the downside, break of 1.3038 support will now indicate that rebound from 1.1946 has completed and turn outlook bearish. Meanwhile, sustained break of 1.3835 should at least send GBP/USD to 38.2% retracement of 2.1161 (2007 high) to 1.1946 (2016 low) at 1.5466.
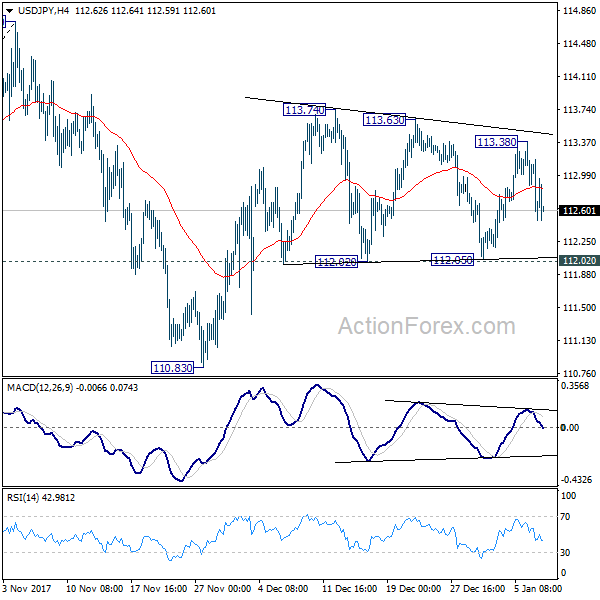
USD/JPY Mid-Day Outlook
Daily Pivots: (S1) 112.85; (P) 113.11; (R1) 113.35; More...
USD/JPY is still staying in range of 112.02/113.74. Intraday bias remains neutral at this point. Also, outlook remains cautiously bullish as long as 112.02 holds and further rise is in favor. Break of 113.74 will resume the rebound from 110.83 and target 114.73 key resistance. Decisive break there will carry larger bullish implications. However, break of 112.02 will likely extend the corrective pattern from 114.73 with another leg through 110.83 support.
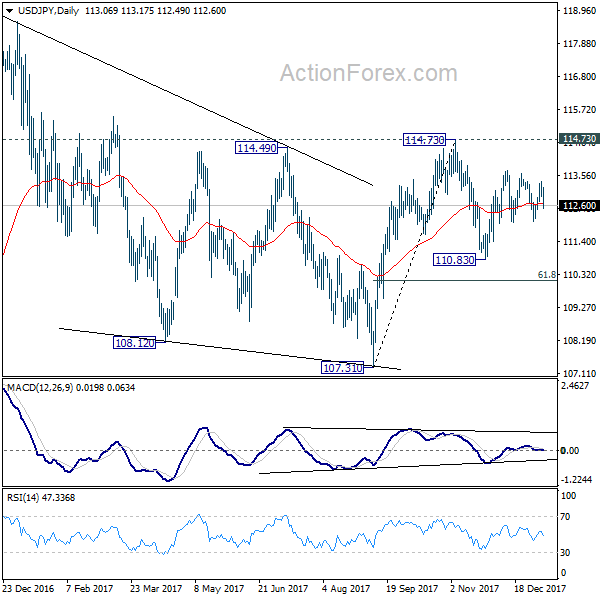
In the bigger picture, we're holding on to the view that correction from 118.65 is completed at 107.31. And medium term rise from 98.97 (2016 low) is going to resume soon. Sustained break of 114.73 should affirm our view and send USD/JPY through 118.65. However, break of 107.31 will dampen this view and extend the medium term fall back to 98.97 low.
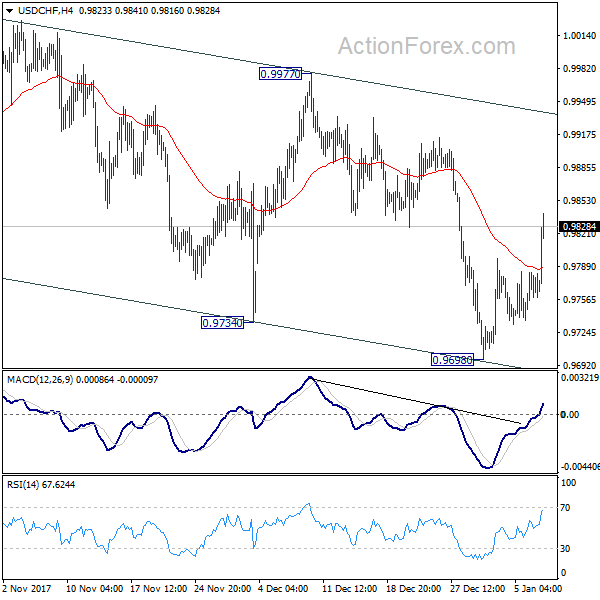
USD/CHF Mid-Day Outlook
Daily Pivots: (S1) 0.9745; (P) 0.9764; (R1) 0.9791; More....
USD/CHF's strong break of 4 hour 55 EMA argues that correction from 1.0037 has completed with three waves down to 0.9698. Intraday bias is back on the upside for 0.9977 resistance first. Break there will likely resume whole rise from 0.9420 through 1.0037 high. For now this will be the favored case as long as 0.9698 support holds.
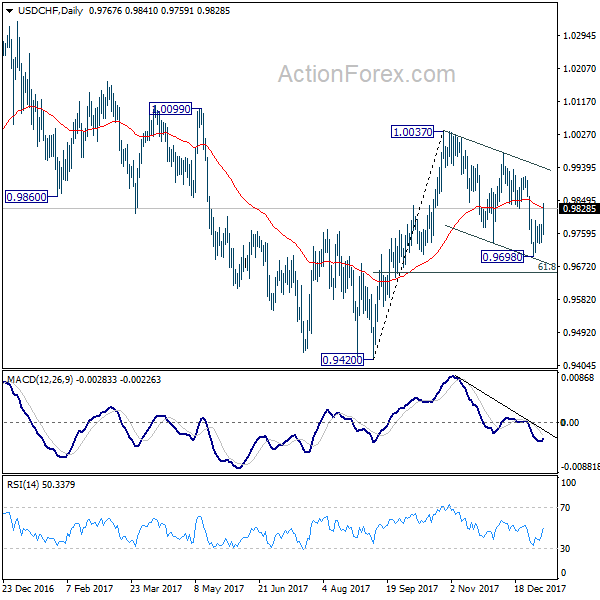
In the bigger picture, range trading continues between 0.9420/1.0342. At this point, 0.9420 appears to be a strong support level. Therefore, in case of decline attempt, we don't expect a firm break of this level. Nonetheless, strong break of 1.0342 is also needed to confirm upside momentum. Otherwise, medium term outlook will stay neutral.
Yen Maintains Gains on BoJ Stimulus Exit Talks, Dollar Catching Up
Yen remains the strongest major currency for today as BoJ operates spurred speculations of stimulus exit. Dollar also follow closely as the second strongest one. On the other hand, European majors are under much selling pressure as recent rally fails to sustain momentum. Euro continue to shrug off positive economic data while EUR/USD's fall gathers steam. Elsewhere, commodity currencies are generally mixed. Speculations for a January BoC rate hike continue to grow. But Loonie's rally is looking stretched.
Technically, USD/CHF takes out 4 hour 55 EMA firmly today. That's accompanied by strong break of 4 hour 55 EMA in EUR/USD too. Both suggests near term reversal and favors more gain in Dollar. EUR/JPY's break of 134.39 also indicates near term reversal and puts 132.04 support back into focus. But USD/JPY is holding in range above 112.02 support, maintaining mild near term bullishness.
Eurozone unemployment hit almost 9 years low
Eurozone unemployment rate dropped to 8.7% in November, down from 8.8% and met expectations. That's also the lowest level in nearly 9 years since 2009. Strength in the economy is translating into jobs and would hopefully into inflation too. While at the last forecast, ECB is not expecting inflation to return to 2% target at least till 2020, there are already calls for exit of stimulus. A key argument is that even if the asset purchase program ends in September, monetary accommodations are still there. Some ECB officials argued that would just mean putting the foot off the gas a little bit, instead of pressing on the break.
Also released from Europe, German industrial production rose 3.4% mom in November. German trade surplus widened to EUR 22.3b in November. Swiss unemployment rate dropped to 3.0% in December, foreign currency reserves rose to CHF 744b. Swiss retail sales dropped -0.2% yoy in November.
BoJ cut 10-25 years JGB purchase by JPY 10b, spurred stimulus exit talks
Yen surges broadly today as data showed BoJ has cut its long-dated JGB purchases in market operations. That's seen as a sign by many of BoJ is finally moving towards stimulus exit. Today, BoJ offered to buy JPY 190b of JGBs with 10 to 25 years maturity. That's JPY 10b lower from the prior tender on December 28. Besides, BoJ also lower the offer on 25 to 40 years maturity JGBs by JPY 10b to JPY 90b. Nonetheless, it should be emphasized that it's far still early for BoJ to start stimulus exit as inflation remains way off target.
Also, it's still uncertain whether BoJ Governor Haruhiko Kuroda's term would be renewed this year. Prime Minister Shinzo Abe said during the weekend that "Gov. Kuroda has met my expectations with job availability at a 43-year high," and "I want him to keep up his efforts". But Abe also noted that "I haven't made up my mind" on who's going to lead BoJ after Kuroda's term expires in April.
Released from Japan, labor cash earnings rose 0.9% yoy in November, above expectation of 0.6% yoy.
North and South Korea agreed military talks to ease tensions
The highly anticipated meeting between North and South Korea officials ended with some fruitful results. The high level meeting was the first time in more than two years, at the Korean peninsula's heavily fortified demilitarized zone known as "peace village". IN a joint closing statement, it's noted that North Korea will send a high-level delegation comprising athletes, a cheering squad, an art troupe, a visitors' group, a Taekwondo demonstration team and a press corps, to the Winter Olympic in South next month.
Also, the two nations announce military talks "to ease the current military tensions between the two Koreas." South Korean unification vice minister Chun Hae-sung said that "We expressed the need to promptly resume dialogue for peace settlement, including denuclearization, and based on the mutual respect (the two Koreas) cooperate and stop activities that would raise tensions on the Korean Peninsula." And that was agreed by the North.
USD/CHF Mid-Day Outlook
Daily Pivots: (S1) 0.9745; (P) 0.9764; (R1) 0.9791; More....
USD/CHF's strong break of 4 hour 55 EMA argues that correction from 1.0037 has completed with three waves down to 0.9698. Intraday bias is back on the upside for 0.9977 resistance first. Break there will likely resume whole rise from 0.9420 through 1.0037 high. For now this will be the favored case as long as 0.9698 support holds.
In the bigger picture, range trading continues between 0.9420/1.0342. At this point, 0.9420 appears to be a strong support level. Therefore, in case of decline attempt, we don't expect a firm break of this level. Nonetheless, strong break of 1.0342 is also needed to confirm upside momentum. Otherwise, medium term outlook will stay neutral.
Economic Indicators Update
| GMT | Ccy | Events | Actual | Forecast | Previous | Revised |
|---|---|---|---|---|---|---|
| 00:00 | JPY | Labor Cash Earnings Y/Y Nov | 0.90% | 0.60% | 0.60% | 0.20% |
| 00:01 | GBP | BRC Retail Sales Monitor Y/Y Dec | 0.60% | 0.30% | 0.60% | |
| 00:30 | AUD | Building Approvals M/M Nov | 11.70% | -1.00% | 0.90% | -0.10% |
| 05:00 | JPY | Consumer Confidence Index Dec | 44.7 | 45 | 44.9 | |
| 06:45 | CHF | Unemployment Rate Dec | 3.00% | 3.00% | 3.00% | 3.10% |
| 07:00 | EUR | German Industrial Production M/M Nov | 3.40% | 1.80% | -1.40% | -1.20% |
| 07:00 | EUR | German Trade Balance Nov | 22.3B | 20.7B | 19.9B | |
| 08:00 | CHF | Foreign Currency Reserves Dec | 744B | 738B | ||
| 08:15 | CHF | Retail Sales Real Y/Y Nov | -0.20% | -2.50% | -3.00% | -2.60% |
| 10:00 | EUR | Eurozone Unemployment Rate Nov | 8.70% | 8.70% | 8.80% | |
| 13:15 | CAD | Housing Starts Dec | 217K | 240K | 252K |