Sample Category Title
Sunset Market Commentary
Global core bonds took a different direction today. The Bund trades neutral following a weaker opening (catch-up with overnight developments) while the US Note future suffers additional losses. European equity market strength (>1%) didn't weigh on the Bund. The new downleg of the Note future occurred following the release of a stellar ADP report (+250k vs +190k expected) which bodes well for tomorrow's payrolls even if the correlation was rather loose of late. US yields increase by 3.7 bps (5-yr) to 2 bps (30-yr) at the time of writing. The German yield curve trades up to 1.3 bps (5-yr) higher. Peripheral bonds profit from a positive risk sentiment with 10-yr yield spreads vs Germany significantly tighter: -14 bps for Greece, -8 bps for Portugal and -6 bps for Spain & Italy. First Spanish supply of the year was well digested (€3.84bn vs €3-4bn target with 2.05 auction bid cover), while the French auction was below average (€8.11bn vs €8-9bn target with 1.62 auction bid cover).
The dollar showed a mixed picture. The US currency returned most of yesterday's gains against the euro even as interest rate differentials widened slightly in favour of the dollar, supported by a very strong ADP labour market report. Strong growth prospects for EMU keep the euro well supported against most other majors as well. EUR/USD is nearing this week's peak, preparing a test of the key 1.2081/92 resistance. At the same time, USD/JPY profited from higher core yields and a buoyant risk sentiment. The pair trended higher in the 112 big figure (currently 112.80 area). The congruent rise of both EUR/USD and USD/JPY pushed EUR/JPY above the 136 mark, the highest level since October 2015.
UK eco data had only a limited impact on sterling trading. The overall rise of the euro helped EUR/GBP to regain the 0.89 barrier. At the same time, cable (currently 1.3535) gained a few ticks as the dollar held a soft bias.
Global equity indices maintain a very strong momentum supported by strong growth data across all regions. Most European equity indices show gains of 1.50% +, the FTSE MIB outperforming with a gain of about 2.5%. US equities also continue the rally that started at the first session of the year. Major US indices opened with gains of about 0.3%/0.4%. Contrary to previous sessions, the Nasdaq underperforms today.
News Headlines
Data published today indicated that the UK economy remains on track for some kind soft landing even as uncertainty on Brexit persisted. The IHS Markit/CIPS services PMI rose to 54.2 in December. The market only expected a stabilization at 53.8. Overall, monthly UK PMI data suggested the UK economy probably grew by 0.4%-0.5% in the fourth quarter. Separate data from the BoE revealed that UK consumers increased borrowing at the slowest pace since mid-2015 in November. Mortgage approvals were slightly stronger than expected.
The EMU economy finished 2017 with the strongest growth in nearly seven years. Activity accelerated in services and manufacturing. IHS Markit's Final Composite Purchasing Managers' Index rose to 58.1 in December from 57.5 in November. The December reading was the highest since February 2011.
Payrolls at US companies increased by a strong 250 000 in December, the most in nine months, according to data released from the ADP Research Institute. Other data indicated that initial claims for unemployment benefits increased by 3 000 to a seasonally adjusted 250 000 for the week ended Dec. 30. However claims data at the end of the year might have been affected by specific factors and probably don't point to a deterioration in labour market conditions.
Commodities End 2017 on Strong Note; Set for a Comeback in 2018
Commodity prices had a mixed start to 2017, with the S&P Goldman Sachs Commodity Index (S&P GSCI) falling by 15% at its low point in June, driven down mainly by the decline in oil prices. However, as the OPEC-led output restrictions started to bite, crude oil prices turned higher, with a strong performance in the fourth quarter. Industrial metals also had an impressive run in 2017, particularly copper and aluminium. Going into 2018, most investors are bullish about commodities, especially against the backdrop of a strengthening global economy.
With growth in China outperforming most economists' forecasts last year, continued solid growth in the United States, and the Eurozone and Japan becoming the surprise economic bright spots of 2017, economies around the world are enjoying their most synchronised growth in a decade. Much of this growth is being generated by a comeback of the manufacturing sector, making commodities very attractive on the improving demand picture for 2018. Their appeal is further enhanced by their relatively low valuations in historic terms, even after the past year's rebound, as well as other assets such as equities now looking expensive in comparison.
The S&P GSCI index ended the year up 5.8%, after reversing higher in June. Goldman Sachs is forecasting prices to increase by a further 10% in 2018.
Oil prices fell by over 20% in the first half of 2017, despite the deal by OPEC and some non-OPEC countries in December 2016 to curb supply. However, after two 9-month extensions to the original 6-month output deal, global crude stocks have started to gradually return to their five-year average, and combined with rising global demand, this has led to oil prices soaring by more than 40% from their trough in June.
Looking ahead, crude oil prices are expected to rise further this year. The output restrictions will stay in place until at least the end of 2018, although a review of the agreement is possible before the deal expires, meaning there is a risk for a negative shock for oil prices. But with world growth forecast to accelerate further in 2018, there is the potential for demand to outstrip supply sooner than the second half of 2018 that is being projected by the International Energy Agency. The possibility of supply outages in unstable regions such as Libya, Nigeria and Venezuela also pose an upside risk for prices.
The medium-term picture for both WTI and Brent prices is very bullish, with price action sharply above the moving averages following the golden cross of the 50- and 200-day moving averages back in the autumn. Analysts have raised their median forecasts for 2018 to $60 a barrel for Brent crude and $54.94 for WTI crude, according to the latest poll by Reuters.
Other energy commodities also had a strong year. Coal prices rallied by about 30% in 2017, driven in part by higher demand from China. However, supply issues also contributed to the rally, and with demand in China now considered to have peaked given the government's tough anti-pollution measures, the outlook for coal in 2018 is bleak. In contrast, natural gas, which has had a bad year due to rising production, is expected to recover slightly in 2018, by about 3% according to the World Bank.
But the big winners for 2017 were metals. Industrial and precious metals were the two sectors with the largest gains during the year, up 31% and 12.9% respectively, according to the S&P GSCI index. The rally in industrial metals was driven by aluminium, copper, zinc, nickel and lead, which are up 34.1%, 30.8%, 29.6%, 27.5% and 23.8% respectively in 2017. The gains in aluminium and copper prices were mainly due to tighter supply, though the copper rally has intensified going into 2018 on expectations of higher demand on the back of faster growth around the world. The price of copper is considered a good indicator of global economic health as it is used intensively in electrical equipment such as motors, wiring and electronic goods.
The commodity hit a near 4-year top of $3.2955 a ton on December 29, extending the bull run that started in October 2016. Copper's long-term uptrend was reinforced by the bullish crossover of the 50-day moving average with the 200-day one in the weekly timeframe in September.
China's ongoing efforts to reduce industrial overcapacity and crack down on polluting plants should benefit metals such as aluminium, steel and iron ore. Though some analysts are doubtful about the degree of possible supply constraints for aluminium, while iron ore prices could come under pressure from increased production elsewhere as new plants come on stream.
Other metals that stand to gain in 2018 are nickel, lithium and cobalt, which are used in the manufacture of batteries. The growing popularity of electric cars will likely lead to greater demand for the elements needed to produce batteries used in electric vehicles. Cobalt gained over 120% in price during 2017, while lithium carbonate is up 36%.
Precious metals had a good run too, with palladium leading the pack with annual gains of about 58%. Palladium has been boosted by a switch to petrol-powered cars in certain regions such as Europe where diesel-powered cars have fallen out of favour. This in turn has led to reduced demand for another precious metal – platinum. Palladium is used in catalytic converters in petrol cars, while platinum is used in diesel cars. The price of platinum rose by only 3% in 2017, ending the year just under $925 an ounce. Silver fared slightly better, rising by almost 6%. In contrast, palladium hit a near 17-year high of $1070 an ounce.
Gold had a surprisingly decent year, rising by around 13% and briefly topping $1350 an ounce in September as geopolitical tensions related to North Korea intensified. Three interest rate hikes by the Fed failed to deter investors from buying the safe-haven asset as long-term US bond yields retreated from their highs set in March. Geopolitical tensions in the Korean peninsula and in the Middle East, as well as a resurgence of political uncertainty in Europe will likely offer further support for gold in 2018. Many analysts expect gold to continue to advance modestly in 2018 on the expectations that the US dollar will remain weak.
However, what happens to inflation in the United States and in other major economies will be key to gold's performance in 2018. Any signs of inflationary pressures making an early appearance could lead to the outlook for gold turning bearish as monetary stimulus would need to be removed more aggressively than currently being anticipated. Apart from the Fed, central banks in the Eurozone and Japan could also surprise markets by bringing forward their stimulus exit plans. At the moment though, the medium-term outlook for gold is increasingly bullish with the spot price trading comfortably above its 50- and 200-day moving averages and eying the $1335 region before targeting the 2017 high of $1357.54.
The worst performing commodity sector in 2017 was agriculture, with prices sliding by 3%. Record production levels in 2016 and 2017 for many agricultural commodities weighed on prices during the past year as most markets were well supplied. Sugar was one of the biggest fallers, dropping by around 22% in 2017. Cocoa and coffee prices also fell sharply, while wheat and corn ended the year slightly higher. However, looking into 2018, agricultural prices could see the biggest improvement. Reduced production and less favourable weather conditions will likely tip the demand/supply balance towards a tighter market.
As always though, the direction of the dollar will play a big role on how commodities will perform in 2018. The dollar's near 10% decline during 2017 was a major positive for commodity prices. Commodities tend to rise when the greenback is depreciating as most are denominated in US dollars, meaning they become cheaper to buy in other currencies, thus increasing their demand. While a big fall in the dollar is not very probable, traders are not betting for major gains either given that monetary divergence between the US and other advanced economies will likely narrow even if the US tax cuts boost growth and inflation picks up. The odds of further dollar weakness in 2018 are therefore high and this could bolster the commodities rally to a more sustainable one.
On the downside, the biggest risk could emerge from China. The world's largest consumer of commodities has adopted a raft of steps to reform its economy during 2017, ranging from measures to cool the property market, cut industrial overcapacity, enforce tougher pollution controls, increase financial regulation and reigning in on risky lending. The impact of these measures on growth have so far been limited but the Chinese economy is expected to slow down more notably in 2018. With China's government now seemingly more relaxed about growth falling below its 6.5% target, counter measures to boost growth are not being foreseen. This opens the prospect of demand for commodities falling short of most estimates and a big determining factor will be to what extent faster growth in other parts of the world would offset the shortfall in such a scenario.
Gold Corrects Downwards; Will Bullish Run Resume?
Gold had edged lower since Wednesday's trading session as the recovery of the greenback caused the sell-off of the metal. The price had posted an aggressive bullish run during the previous three weeks following the rebound on the 1236 support level, which overlaps with the ascending trend line taken from the low of December 15, 2016. The precious metal recorded a new 16-week high at 1321.28 yesterday.
As long as the price continues to trade above the uptrend line, the likelihood for the bulls to take charge again and drive the price higher is high. If there is a bullish run, penetrating the 1321 strong resistance level, the price could extend its gains towards the 1334 barrier, defined by the peaks of the September 13 and 15 as well as the 1357 high level.
On the flip side, a dip below the 1305 support level, could open the door for the 23.6% Fibonacci retracement level, near 1301, with the low at 1236 and the high at 1321. Moreover, a drop lower could push the price to touch the 38.2% Fibonacci level, near 1288.
Having a look at the short-term time frame and the technical indicators, the notion for further correction is also supported by the MACD oscillator. The MACD is moving lower in the positive territory and is losing its strong bullish momentum. However, the RSI indicator is sloping upwards above the 50 level, signaling for a continuation of the upward movement. The indicators seem to be in confusion and traders need to wait for the price to confirm the next move.
GBPUSD Turning Bullish Above 1.3550 Level
The British pound has moved higher against the U.S dollar during the European trading session, after sellers failed to push price-action below the 1.3500 level. Better than expected macro-economic data from the UK economy, and a weaker U.S dollar index have also helped the GBPUSD pair to claw back yesterday's losses. Moving into the U.S trading session, technical traders will battle for positioning around the 1.3550 technical region, ahead of the release of the December ADP jobs report.
The GBPUSD pair will only turn bullish above the 1.3550 technical level, upside targets for buyers remain 1.3567 and 1.3613.
Should price-action on the GBPUSD pair fail to hold price-action above the 1.3550 level, a decline back towards the 1.3500 and 1.3468 levels remains likely.
EURUSD Strongly Bullish Above 1.2050 Level
The euro has pushed sharply higher against the U.S dollar during the European trading sessions, as the U.S dollar index slips back below the key 92.00 level. The EURUSD pair is now trading around the 1.2065 level, with the 2017 price-high at 1.2093 within buyers reach. Above 1.2093, the next technical medium-term hurdle for euro bulls is the 1.2240 level, which represents the 50 percent Fibonacci retracement of the 2014 swing price high to the 2017 yearly price-low. Traders now look to the release of the U.S ADP jobs report, with economists expecting 190,000 jobs to be created during the month of December.
The EURUSD pair is strongly bullish while trading above the 1.2050 level, upside targets remain 1.2093 and 1.2150 in the short-term.
Should the EURUSD pair move below the pivotal 1.2050 level, sellers will likely target the 1.2030 and 1.2000 support regions.
Gold: Rejects Lower Prices, Risk Remains Higher
GOLD: The commodity still faces its broader upside pressure as it saw a rejection of lower prices on Thursday. On the downside, support comes in at the 1,300.00 level where a break will turn attention to the 1,290.00 level. Further down, a cut through here will open the door for a move lower towards the 1,280.00 level. Below here if seen could trigger further downside pressure towards the 1,270.00 level. Conversely, resistance resides at the 1,320.00 level where a break will aim at the 1,330.00 level. A turn above there will expose the 1,340.00 level. Further out, resistance stands at the 1,350.00 level. Its daily RSI is bullish and pointing higher suggesting further strength. All in all, GOLD looks to strengthen further.
USD/JPY Mid-Day Outlook
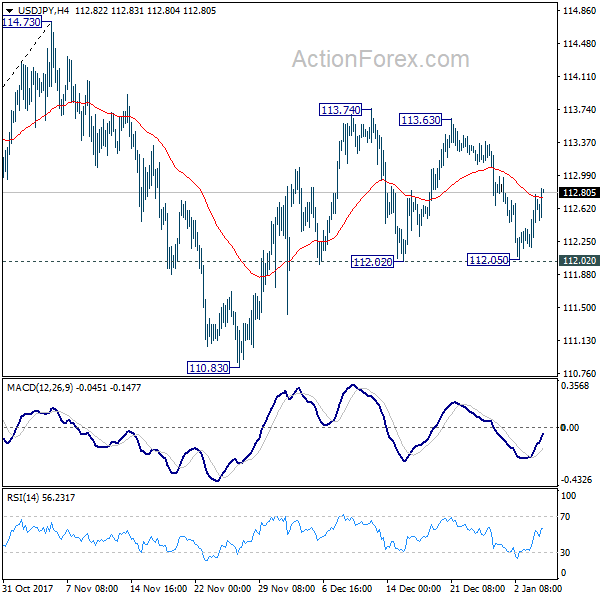
Daily Pivots: (S1) 112.25; (P) 112.42; (R1) 112.68; More...
USD/JPY is still bounded in range of 112.02/113.74. Intraday bias remains neutral first. Also, near term outlook stays bullish as long as 112.02 support holds and further rise is expected. Break of 113.74 will resume the rebound from 110.83 and target 114.73 key resistance. Decisive break there will carry larger bullish implications. However, break of 112.02 will likely extend the corrective pattern from 114.73 with another leg through 110.83 support.
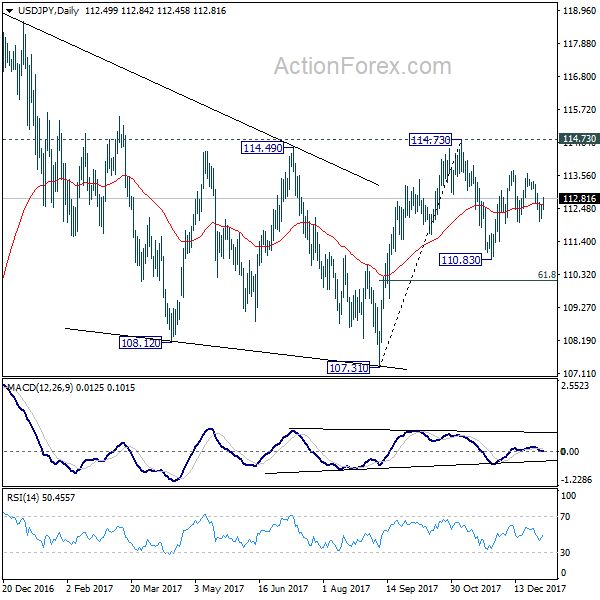
In the bigger picture, we're holding on to the view that correction from 118.65 is completed at 107.31. And medium term rise from 98.97 (2016 low) is going to resume soon. Sustained break of 114.73 should affirm our view and send USD/JPY through 118.65. However, break of 107.31 will dampen this view and extend the medium term fall back to 98.97 low.
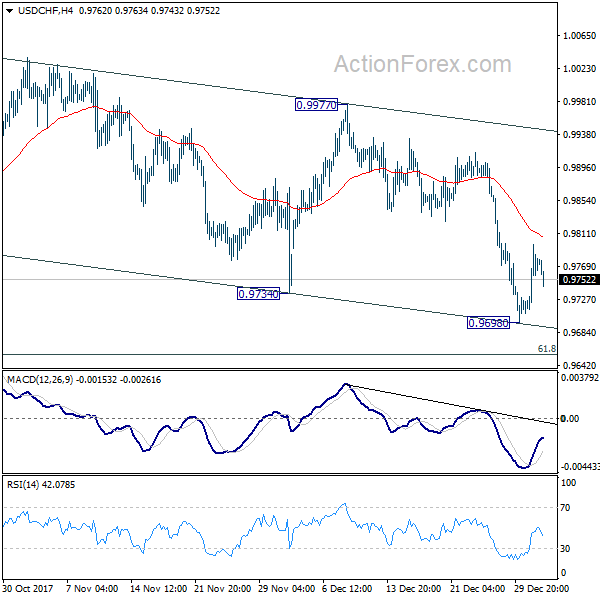
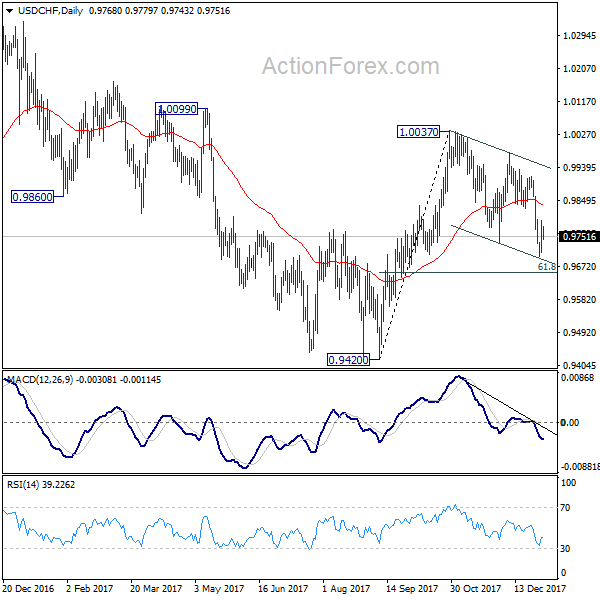
USD/CHF Mid-Day Outlook
Daily Pivots: (S1) 0.9718; (P) 0.9758; (R1) 0.9807; More....
Intraday bias in USD/CHF stays neutral as this point. As long as 4 hour 55 EMA (now at 0.9806) holds, deeper fall is mildly in favor. But we'd expect 61.8% retracement of 0.9420 to 0.1.0037 at 0.9656 to contain downside and bring rebound. Sustained break of 4 hour 55 EMA will argue that the correction from 1.0037 has completed and turn focus to 0.9977 resistance for confirmation.
In the bigger picture, range trading continues between 0.9420/1.0342. At this point, 0.9420 appears to be a strong support level. Therefore, in case of decline attempt, we don't expect a firm break of this level. Nonetheless, strong break of 1.0342 is also needed to confirm upside momentum. Otherwise, medium term outlook will stay neutral.
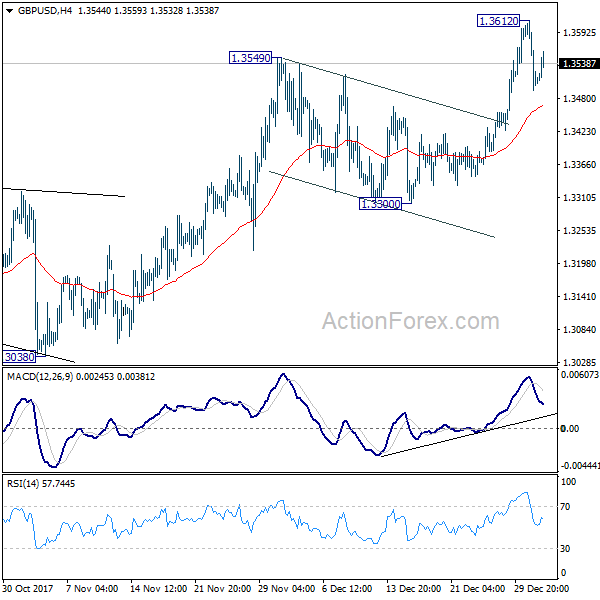
GBP/USD Mid-Day Outlook
Daily Pivots: (S1) 1.3469; (P) 1.3540; (R1) 1.3588; More.....
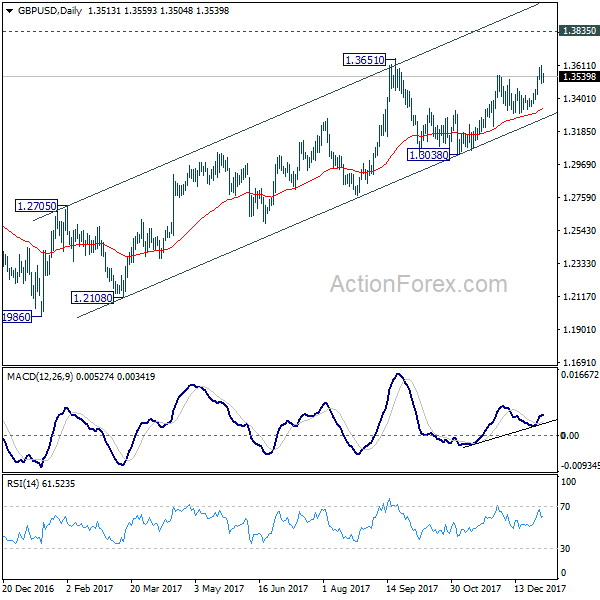
Intraday bias in GBP/USD remains neutral for the moment. As long as 4 hour 55 EMA (now at 1.3468) holds, further rally is expected. Above 1.3612 will target 1.3651 key resistance first. Break will resume medium term rise from 1.1946 and target key resistance level at 1.3835. However, sustained break of 4 hour 55 EMA will turn focus back to 1.3300 support.
In the bigger picture, while the medium term rebound from 1.1946 low was strong, it's limited below 1.3835 key support turned resistance. As long as 1.3835 holds, we'd view such rebound as a correction. That is, we'd expect another leg in the long term down trend through 1.1946 low. However, sustained break of 1.3835 should at least send GBP/USD to 38.2% retracement of 2.1161 (2007 high) to 1.1946 (2016 low) at 1.5466.
EUR/USD Mid-Day Outlook
Daily Pivots: (S1) 1.1987; (P) 1.2026 (R1) 1.2052; More....
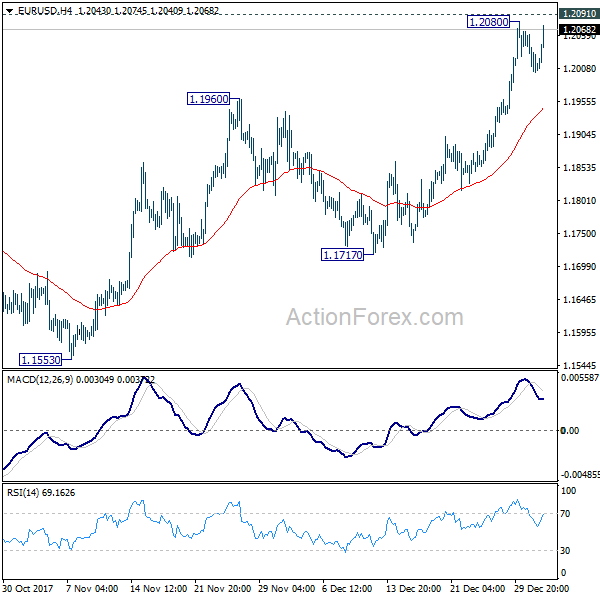
EUR/USD rebounds strongly today but stays below 1.2091 resistance. Intraday bias remains neutral first. Further rise is expected as long as 4 hour 55 EMA (now at 1.1946) holds. Firm break of 1.2091 will confirm medium term rally resumption and target next key fibonacci level at 1.2494/2516. However, sustained break of 4 hour 55 EMA will extend the consolidation pattern from 1.2091 with with another decline through 1.1717 support.
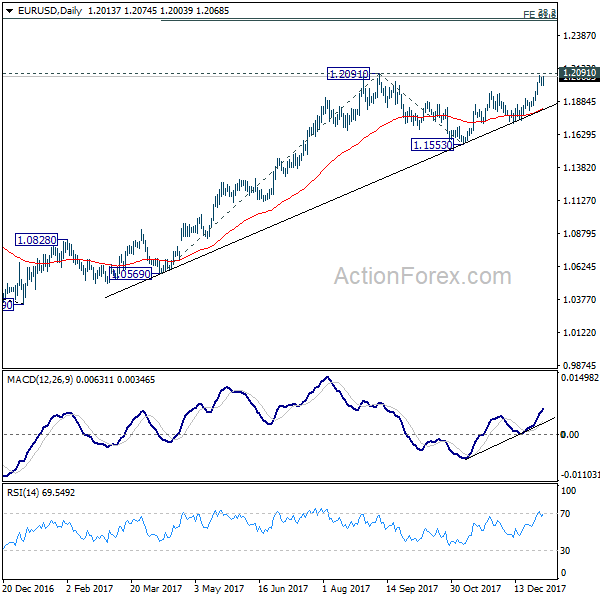
In the bigger picture, rise from 1.0339 medium term bottom is seen as a corrective move for the moment. Therefore, in case of another rally, we'd be expect 38.2% retracement of 1.6039 (2008 high) to 1.0339 (2017 low) at 1.2516 to limit upside and bring reversal. That is also close to 61.8% projection of 1.0569 to 1.2091 from 1.1553 at 1.2494.