Sample Category Title
GBP/USD Analysis: Meets 100-Hour SMA
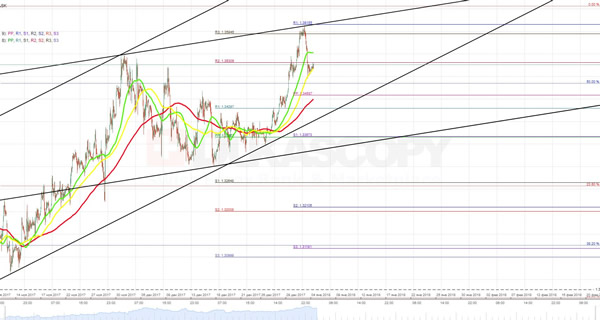
Previous trading session the Pound ended with a 104-pip fall against the Dollar. The support was provided by the 100-hour SMA. Most probably this indicator will continue to drive the cable up to the 55-hour SMA located at 1.3553.
Even in case of release of disappointing British Services PMI data the pair is not expected to fall below the 1.3500-1.3580 marks as this support area is additionally secured by the 50% Fibonacci retracement level and the weekly PP. However, in larger perspective the buck is expected to take the lead once again. This assumption is supported by traders’ sentiment, which is predominantly bearish as well as allocation of pending orders which are mostly set to sell.
USD/JPY Analysis: Heads Down To Test 112.50
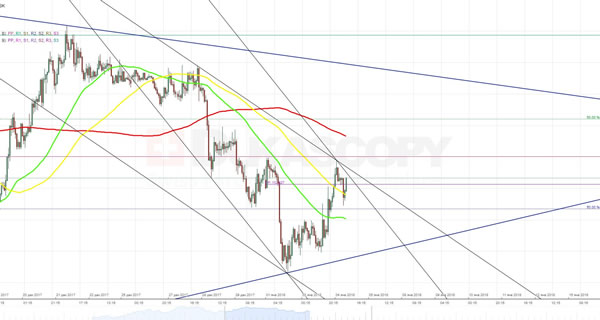
In early hours of this trading session the buck stopped the surge and bounced off from the 112.79 level. In essence, this turning point simultaneously represents the second reaction high of a two unconfirmed descending channels.
As the northern side is additionally secured by the weekly and monthly PP as well as the slipping 200-hour SMA, the Yen is expected to resume the rally against the Dollar tending to reach the 112.13 mark by the end of the week. However, this scenario might be altered due to release of information on the American labour market. In that case the currency rate might end the week near the psychological 113.00 level.
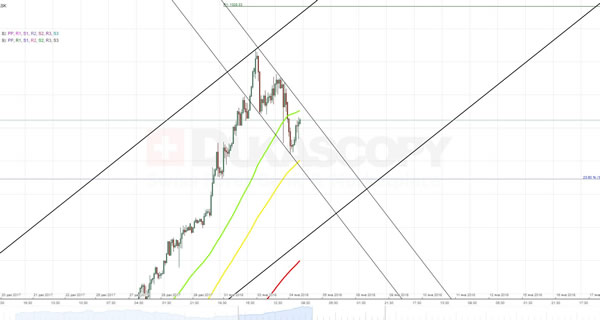
XAU/USD Analysis: Forms Junior Channel Down
During the early hours of new trading session the yellow metal continued to lose value against the buck in a junior descending channel. Basically, the consolidation period might last until the exchange rate will hit the support line of a four-week long ascending channel. A deep plunge below that barrier seems unlikely due to additional support provided by the rising 200-hour SMA as well as the 50% Fibonacci retracement level located at 1,297.00. So, unless the buck gains a momentum from some fundamental event, such as tomorrow’s employment data release, the bullion is likely to test the 1,320.00 level one more time. An allocation of pending orders as well as some technical indicators supports this assumption.
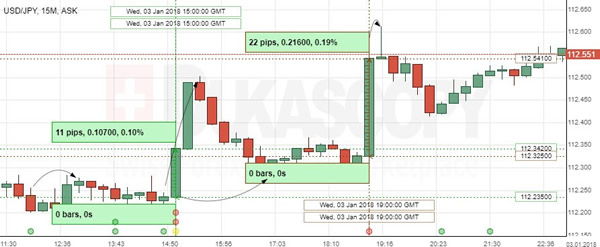
USD/JPY: ISM Manufacturing PMI
The Greenback rose against the Japanese Yen on strong ISM manufacturing and construction release. The USD/JPY exchange rate jumped 11 base points to touch 112.50 areas, ahead of the 22 pips gain on the FOMC meeting minutes release.
The US factory growth accelerated more than projected by the end of 2017, fuelled by stronger new orders’ growth, indicating solid economic momentum in the period. The Institute for Supply Management stated that its Manufactuirng PMI grew to 59.7 in the reported month, suggesting expansion in the sector. In the following FOMS meeting minutes report, the Fed polycimakers indicated that further rate increases would be guided by fiscal stimulus, consumer inflation.
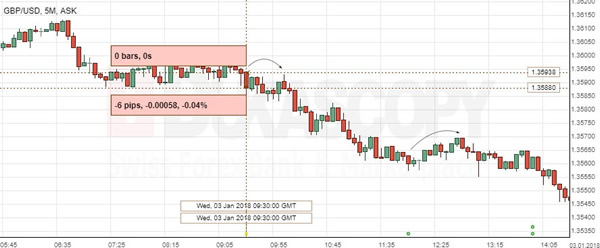
GBP/USD: UK Construction PMI
The Sterling retreated from September highs against the US dollar, following the report showing a slowdown in the UK building business. The GBP/USD currency pair kept falling gradually to 1.3500 level.
The UK construction sector's expansion weakened in December for the first time in four months, as slow growth in commercial and house-building came in with stagnating infrastructure activities, a survey indicated. The Markit/CIPS stated that Britain's construction PMI decreased to 52.2 in December, after being seen at the five-month high of 53.1 in the prior month. Meanwhile, the country's services PMI is scheduled for Thursday to determine whether the economic growth lost momentum in the 2017 end and how Brexit weighed on expansion.
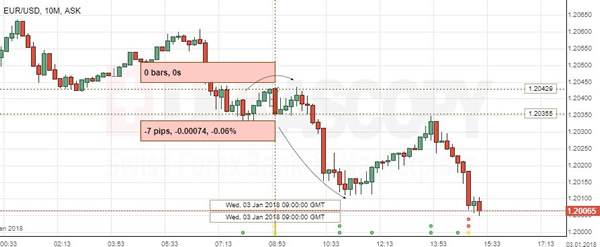
EUR/USD: German Unemployment Rate
The EUR/USD continued the bearish trend on the neutral German job market data. The Euro depreciated against the US Dollar by 7 base points or 0.06% to move close to the edge of 1.2000.
German jobless rate reached a record low, as total unemployment fell more than anticipated in December, reinforcing the economy's broad-based upswing that boded well for strong growth in the future. Germany's unemployment rate matched the prior month's revised reading of 5.5% in December, while the yearly rate declined from 6.1% to 5.7%. The Europe's largest economy continued to benefit from a jobs bonanza, escorted by higher real wages and very low borrowing costs, while exporters face stronger demand from the US and China.
GOLD Trend And Momentum Are Aligned
The recent rise in the Gold price is possibly due to the seasonal effect of Chinese New Year and various festive seasons this time of year. In addition, as Equities continue to rise across the globe, investment flows have been going into Gold as portfolio insurance.Gold is having both trend and momentum aligned. That is obvious due to very shallow retracements and a strong upward move that even surpasses a standard trend zig-zag pattern. But at this point we can see the POC zone has been formed after a long waited retracement. 1305.30-1309.20 is the POC zone. Traders should also pay attention to the possible trend line break. If the trend line breaks (red) -1314.20 we could see the continuation towards 1316.86 and 1327. Pay attention to levels. Only below 1299 we could see a deeper retracement to the downside.
W L3 - Weekly Camarilla Pivot (Weekly Interim Support)
W H3 - Weekly Camarilla Pivot (Weekly Interim Resistance)
W H4 - Weekly Camarilla Pivot (Strong Weekly Resistance)
D H4 - Daily Camarilla Pivot (Very Strong Daily Resistance)
D L3 – Daily Camarilla Pivot (Daily Support)
D L4 – Daily H4 Camarilla (Very Strong Daily Support)
POC - Point Of Confluence (The zone where we expect price to react aka entry zone)
Forex Technical Analysis: EUR/USD, USD/JPY, GBP/USD
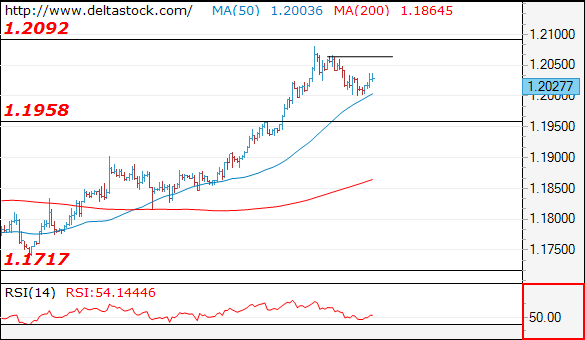
EUR/USD
Current level - 1.2027
The bias is still bearish, for a slide towards 1.1960 static support. Key hurdle on the upside is 1.2060, as it guards the negative outlook below 1.2090.
| Resistance | Support | ||
| intraday | intraweek | intraday | intraweek |
| 1.2060 | 1.2090 | 1.1960 | 1.1910 |
| 1.2090 | 1.2240 | 1.1910 | 1.1715 |
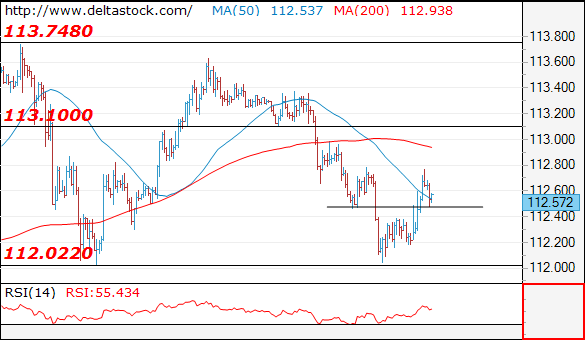
USD/JPY
Current level - 112.57
My outlook remains positive, for a rise towards 113.10 area. Initial support is projected at 112.40.
| Resistance | Support | ||
| intraday | intraweek | intraday | intraweek |
| 113.09 | 113.75 | 112.40 | 112.00 |
| 113.75 | 114.70 | 112.00 | 111.00 |
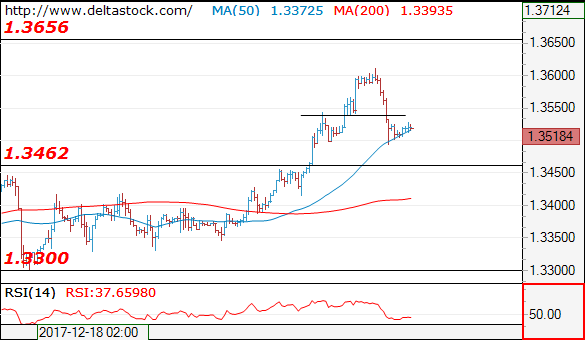
GBP/USD
Current level - 1.3518
A reversal has been confirmed at 1.3610 and the bias is bearish, for a test of 1.3460 area. Minor resistance lies at 1.3540.
| Resistance | Support | ||
| intraday | intraweek | intraday | intraweek |
| 1.3540 | 1.3660 | 1.3460 | 1.3460 |
| 1.3660 | 1.3660 | 1.3340 | 1.3300 |
GBP/JPY Daily Outlook
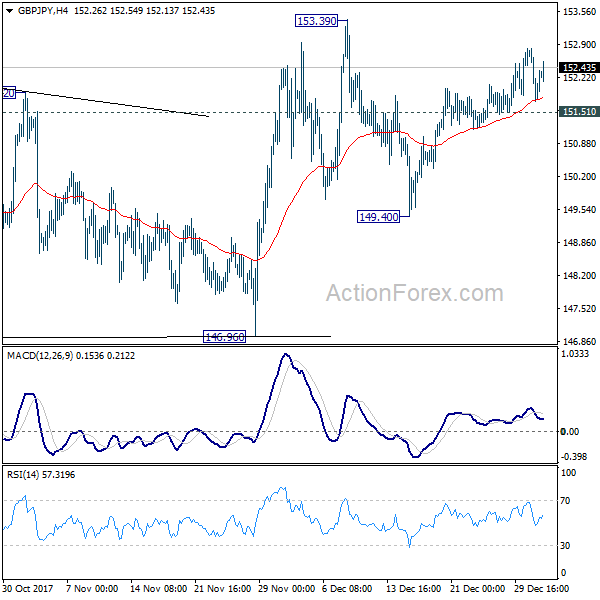
Daily Pivots: (S1) 151.60; (P) 152.20; (R1) 152.67; More...
With 151.51 minor support intact, rebound from 149.40 is expected to continue to 153.39 resistance. Break will resume medium term rally. On the downside, below 151.51 minor support will extend the corrective pattern with another fall through 149.40 before completion.
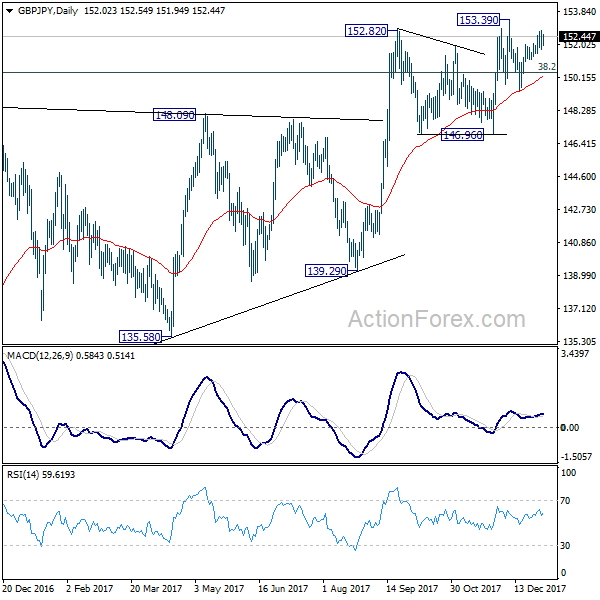
In the bigger picture, outlook is mixed up a bit with last week's sharp decline. But still, as long as 146.96 key support holds, medium term outlook remains bullish. Rise from 122.36 is in favor to extend to 61.8% retracement of 195.86 to 122.36 at 167.78. However, break of 146.96 support will indicate trend reversal. And the corrective structure of rebound from 122.36 will argue that larger down trend is resuming for a new low below 122.26.
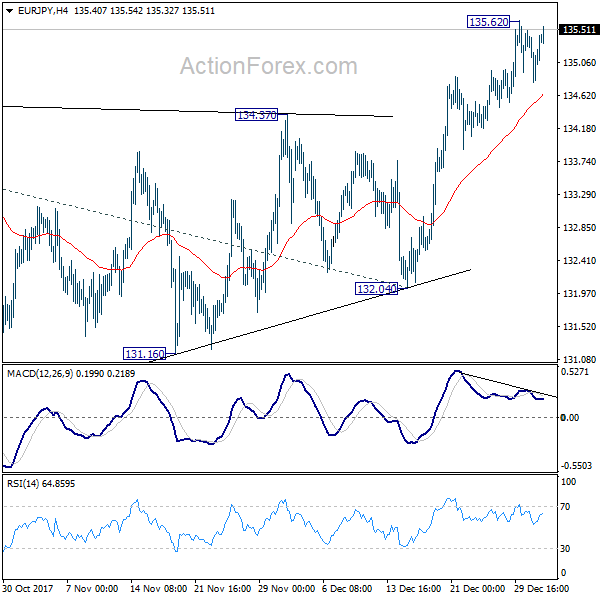
EUR/JPY Daily Outlook
Daily Pivots: (S1) 134.81; (P) 135.15; (R1) 135.51; More....
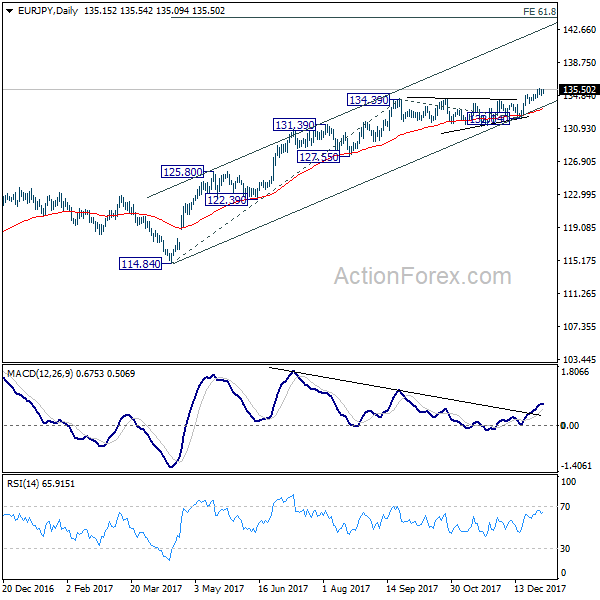
Intraday bias in EUR/JPY is neutral for consolidation below 135.62 temporary top. Further rise is still in favor for the moment. Break of 135.62 will extend the medium term rally to 61.8% projection of 114.84 to 134.39 from 132.04 at 144.12. However, break of 4 hour 55 EMA will bring deeper pull back to 134.37 support and below.
In the bigger picture, medium term rise from 109.03 (2016 low) is seen as at the same degree as the down trend from 149.76 (2014 high) to 109.03 (2016 low). Sustained break of 61.8% retracement of 149.76 to 109.03 at 134.20 will pave the way to key long term resistance zone at 141.04/149.76. However, break of 132.04 support will suggest medium term topping and will turn outlook bearish for deeper fall back 55 week EMA (now at 128.34).