Sample Category Title
USDCAD Loses Some Ground, Records 2-Month Low
USDCAD extended its losses as the Canadian dollar posted a bullish rally. The pair is falling for the sixth straight trading day and has plummeted more than 2% since December 20. Additionally, the price recorded a new 2-month low at 1.2604 during the European session and slipped beneath the narrow range with an upper boundary at 1.2915 and a lower boundary at 1.2665 in Wednesday’s session.
The range was holding in the last two months and after the drop, the price is testing the 100-day simple moving average (SMA). The aforementioned obstacle is acting as strong support and if there is a failed attempt to fall further, the pair could see a retracement back into the range with the nearest resistance to have in mind at the 50-SMA at 1.2765 on the daily timeframe. On the flip side, a continuation of the aggressive sell-off could drive USDCAD to the 1.2440 support barrier.
Remaining on the short to medium-term timeframe, the MACD oscillator fell below the zero line but is still moving with weak momentum. However, the RSI indicator is painting a more bearish picture as it is fast approaching the 30 oversold level.
Overall, the expectation for the next couple of days is a bearish movement as the hit on the 1.2915 upper boundary which overlaps with the 200-day SMA pushed the price sharply lower and this tendency could continue.
Technical Analysis – Outlook 2018: AUDUSD Remains Above Strong Rising Trend Line, More Gains Are Expected
AUDUSD is trying to snap the four-monthly losing period as it is posting a positive December, surging more than 2.6% so far. The pair almost tested the ascending trend line, which is holding since last year, at the beginning of the month and is recouping some of its previous month’s losses. In addition, the price found as strong support the 50% Fibonacci retracement level, near 0.7475, with the low at 0.6820 and the high at 0.8125, and is moving towards the 23.6% Fibonacci level at 0.7816.
It is worth mentioning that AUDUSD successfully surpassed the 100 and 50-simple moving averages (SMAs) on the weekly timeframe and could extend its gains towards the 28-month high at 0.8125 in case of a climb above the 200-SMA, which stands near 0.7860.
An alternative scenario is a break of the rising trend line below the 0.7500 strong psychological level, which could open the door for the 61.8% Fibonacci level at 0.7325.
Remaining on the same long-term timeframe (weekly chart), the technical indicators are confirming the recent bullish move. The MACD oscillator is rising in the negative territory and is approaching the trigger line for a bullish crossover and the ROC oscillator is ready for a climb above the zero line, signaling further gains.
Turning our attention to the short to medium-term chart (daily timeframe), the momentum indicators are standing in the overbought zone with stronger momentum than before, signaling a possible near-term correction.
Technical Analysis – Outlook 2018: NZDUSD Must Surpass Significant Obstacles For Continuation Of Upward Rally
NZDUSD has been in a long-term uptrend but has also recorded significant downward corrections. The price rose more than 58% from January 2001 until August 2011 and hit its highest level through these years at the 0.8840 resistance barrier.
From the technical point of view, on a monthly basis, the stochastic oscillator is ready for a slight upward slope after its entry in the oversold area, signaling an upwards correction. Moreover, the Relative Strength Index (RSI) is moving north but remains in the negative territory.
In the medium-term timeframe (weekly chart), the pair broke the ascending trend line (in place since September 2015) to the downside, indicating for further losses. However, over the last week, the price posted a green session following the bounce off the 0.6770 support level. In case of a rise, the price needs to go through the 100 and 50, and 200-week SMAs as well as the 38.2% Fibonacci level at 0.7053.
The next level to watch is the 0.7560 key level, which coincides with the 100-month simple moving average in the monthly chart and is near with the 50.0% Fibonacci retracement level with the high at 0.8840 and the low at 0.6230. A deeper retracement could risk eliminating the medium-term bullish outlook but if the market remains above the key 0.6770 level there is room for an extension above 0.7000. On the reverse side, a drop below 0.6770 could open the way for a test of the 0.6345 barrier.
Having a look at the momentum indicators in the weekly chart the RSI indicator is approaching the 50 level and the bullish area, whilst the MACD oscillator printed a bullish crossover with its trigger line, suggesting the medium-term momentum is shifting back to the upside.
Technical Analysis – Outlook 2018: USDCAD In Long-Term Upward Reversal, Further Short-Term Bearish Correction Before Gains
USDCAD has been developing within a rounding bottom pattern since 2009 until the end of 2015. Rounding bottom is a reversal pattern and as the previous trend was a downtrend, the expectation is for a rising movement on a long-term basis. During January 2016, the pair recorded a fresh 13-year high at 1.4690 and then started a retracement to the downside with a new 2-year low at 1.2040.
Remaining on the monthly chart, the next resistance to have in mind is 1.3790 as well as 1.4690. Technical indicators are losing some momentum in the long-term, however, are still moving in positive territories. Moreover, the price is holding above the 50 and 100 simple moving averages indicating the potential for further upside move.
Technical Outlook: AUDUSD – Fresh Bullish Extension Pressures Daily Cloud Top At 0.7816
The Aussie dollar extended steep rally on Thursday and cracked psychological 0.7800 barrier, en-route to key resistance at 0.7816 (daily cloud top).
Broader greenback's weakness keeps the Aussie supported, with bulls so far ignoring strongly overbought conditions on daily chart studies.
Sustained break above cloud top will be strong bullish signal for extension of recovery leg from 0.7500 (11 Dec low) towards next key barriers at 0.7886/0.7897 (Fibo 61.8% of 0.8124/0.7500 descend / 13 Oct lower top).
However, corrective action could be anticipated in the near-term on overbought daily RSI / slow stochastic but no firmer bearish signals being generated so far.
Rising daily Tenkan-sen which tracks the advance since mid-Dec, offers solid support at 0.7723.
Res: 0.7816, 0.7865, 0.7886, 0.7897
Sup: 0.7761, 0.7723, 0.7694, 0.7660
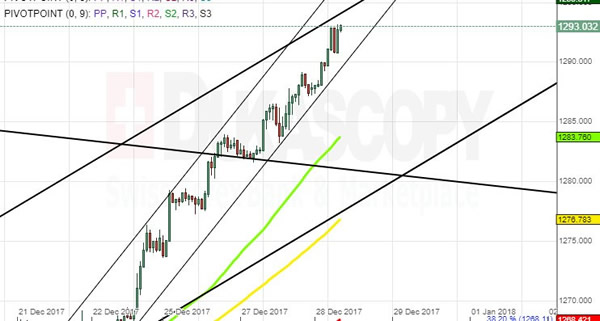
XAU/USD Analysis: Approaches Resistance
As most financial instruments that are denominated against the US Dollar, gold prices have surged. On Thursday morning the commodity price was already approaching an upper trend line of a medium scale channel up pattern. The price was guided to that trend line by a junior channel up pattern.
Due to that reason the metal's price should be watched carefully. An encounter with the mentioned trend line might turn out into a new short term trend, which might take any direction.
The metal might decline down to the 55-hour SMA, begin a consolidation or continue the surge. In short, watch for clues
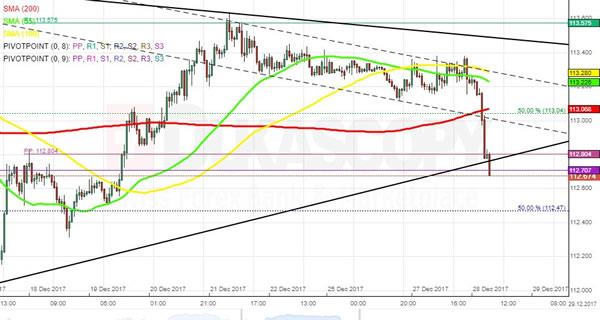
USD/JPY Analysis: Plunges Amid Solid Fundamentals From Japan
The US Dollar extended its losses against the Japanese Yen for the fourth consecutive session. The pair managed to remain near the 100– and 55-hour SMAs on Wednesday. This rather still momentum sideways was disrupted early in this session when the rate, driven primarily by globally weaker US Dollar and solid fundamentals from Japan, dashed through the combined support of the 200-hour SMA and the 50.0% Fibonacci retracement and thus had reached the monthly PP circa 112.70 a few hours later. The bearish sentiment might still prevail during the following hours, but the overall direction in this session should be tended northwards. It is expected that the pair retests the 113.00 area; however, it is yet to be seen if the 200-hour SMA is breached.
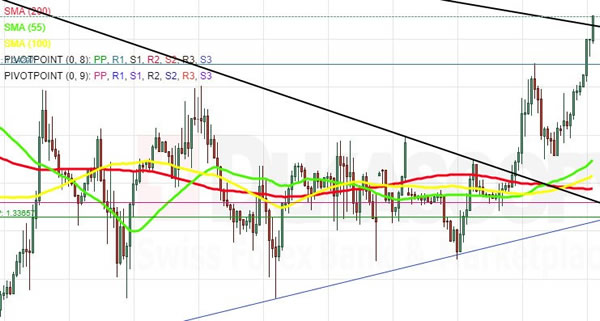
GBP/USD Analysis: Continues To Edge Higher
The Sterling has strengthened against the US Dollar during the past two trading sessions. The broadly-based weakness of the latter has allowed the Pound to push above the 1.3440 mark early on Thursday. Thus, the rate was testing the upper boundary of a four-week descending channel. Apart from the given line, the nearest resistance is provided by the distant 50.0% Fibo located at 1.3485. It is, however, unlikely that the rate pushes this high in this session. Technical indicators suggest that the strong upward movement should allay, but the Sterling could nevertheless remain relatively stable against its American counterpart. The most likely downside target for today is the combined support of the 55-, 100– and 200-hour SMAs and the monthly and weekly PPs circa 1.3370.
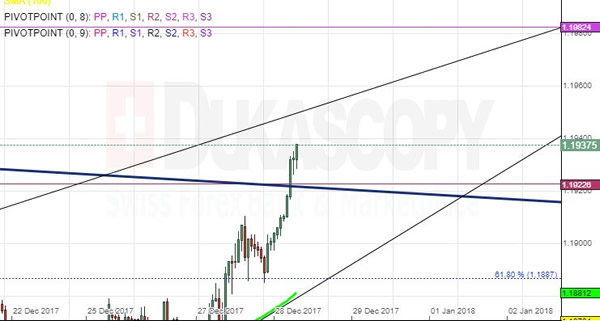
EURUSD Analysis: Breaks Dominant Resistance
The common European currency has gained ground against the US Dollar. The currency exchange rate on Thursday morning was approaching the 1.1940 mark. However, it has to be noted that the reason for the surge was US Dollar’s weakness not the strength of the Euro, as it can be seen that the Buck has given ground on all charts.
In regards to the future of the EUR/USD pair, it can be expected that the surge will continue until it reaches the upper trend line of the pattern, which forced the breaking of the dominant resistance. The trend line at current angle would be reached near the 1.1960 level.
Forex Technical Analysis: EUR/USD, USD/JPY, GBP/USD
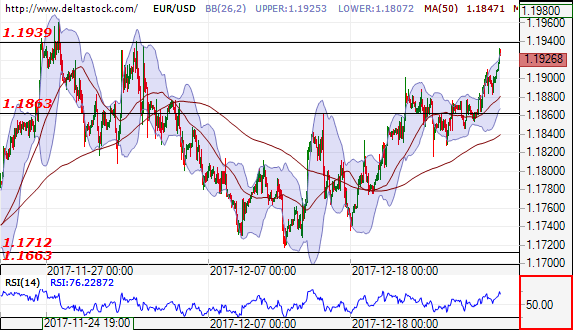
EUR/USD
Current level - 1.1926
The outlook is positive for a test of the resistance level at 1.1939. In negative direction the support level is at 1.1863.
| Resistance | Support | ||
| intraday | intraweek | intraday | intraweek |
|
1.1939 |
1.1939 |
1.1863 |
1.1663 |
|
1.1939 |
1.2090 |
1.1712 |
1.1550 |
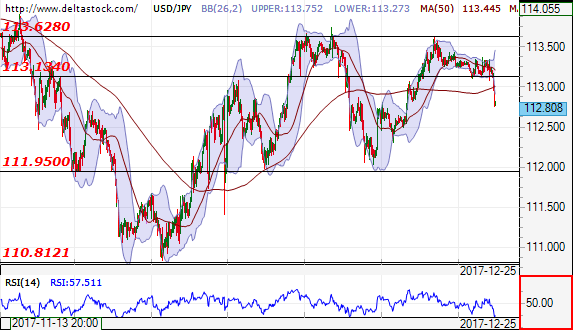
USD/JPY
Current level - 112.80
The unsuccessful breakthrough of the resistance level at 113.62, leaded to a breakthrough of the support at 113.13. The outlook is negative for a test of the next support at 111.95.
| Resistance | Support | ||
| intraday | intraweek | intraday | intraweek |
|
113.13 |
114.48 |
111.95 |
109.50 |
|
113.62 |
114.48 |
110.81 |
107.30 |
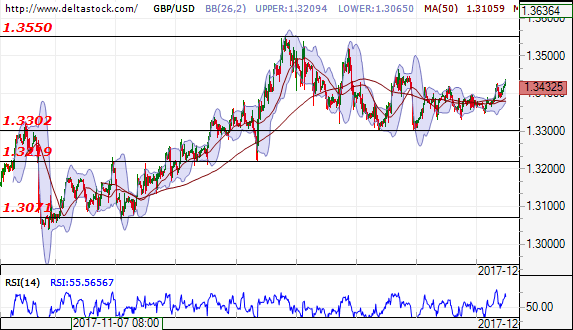
GBP/USD
Current level - 1.3432
The outlook is positive for a test of the resistance level at 1.3550. In negative direction the support level at 1.3302, may determine the market movement of the currency pair.
| Resistance | Support | ||
| intraday | intraweek | intraday | intraweek |
|
1.3550 |
1.3660 |
1.3302 |
1.3220 |
|
1.3550 |
1.3660 |
1.3220 |
1.3070 |