
Sample Category Title
USD/CNH 1H Chart: Greenback Fails To Pick Up Speed
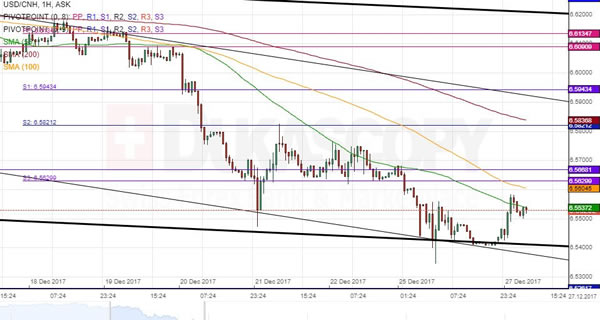
USD/CNH has been guided by a descending channel since mid-October. The lower boundary of this medium-term pattern was tested late on Tuesday. However, a subsequent surge up was halted by the 55-hour SMA—a resistance barrier that was tested early today. Given that the pair failed to surpass this moving average already last week, it is likely that it hinders for several hours near this line and the 100-hour SMA, the weekly S3 and the monthly S1 in the 6.5540/6.5670 territory. The pair might even trade lower during the following hours, but it should eventually pick up speed and push towards the junior channel circa 6.59.
AUD/SGD 1H Chart: Pair Ready To Breach Wedge
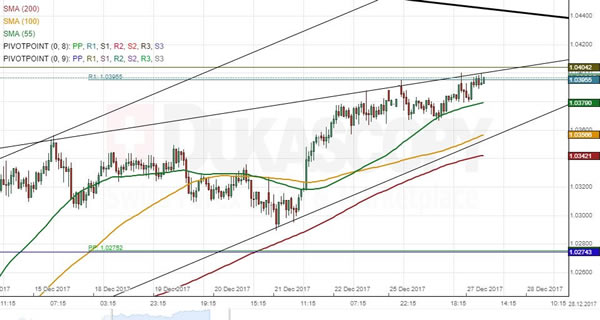
The Australian Dollar has appreciated against the Singapore Dollar during the past three weeks. This movement upwards has sent the pair closer to the upper boundary of a long-term channel down. If looking in the short term, the latest up-wave has been stranded in an ascending wedge. The Aussie has, however, remained near its northern boundary for several trading sessions. This suggest that it could eventually breach the weekly R1 located at 1.0396. This scenario would then push the rate towards the senior channel circa 1.0440. Meanwhile, technical indicators suggest that the rate could afterwards edge lower, thus failing to breach this mark. In case the 55-hour SMA is breached today, the Aussie is likely to stop near 1.0340.
Technical Outlook: USDJPY – Near-Term Bears Pressure Key 113.00 Support Zone
The pair remains in red on Wednesday and extends descend from 113.63 (21 Dec lower top) left after repeated failure to clearly break above daily cloud.
The price continues to move lower since then, tracking descending daily cloud top which marks immediate support (currently at 113.08).
Strong supports lay at 113.00/112.85 zone (daily cloud top / Fibo 38.2% of 112.02/113.63 upleg / 10/55/20SMA’s) and firm break here would generate stronger bearish signal.
Near-term action is weighed by falling and thickening hourly cloud (spanned between 113.32 and 113.41) and the downside is expected to remain at risk while the latter caps.
Res: 113.32, 113.41, 113.63, 113.74
Sup: 113.00, 112.85, 112.68, 112.43
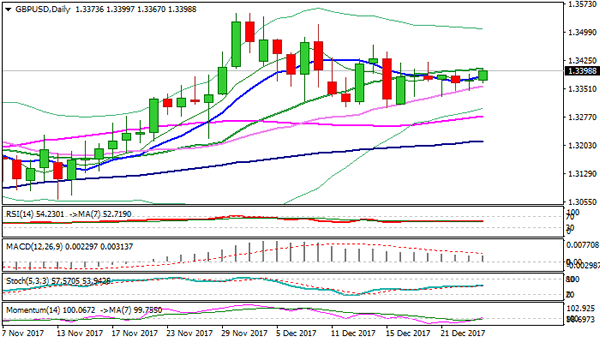
Technical Outlook: GBPUSD – Break Above 1.3400 Zone Needed For Bullish Signal
Near-term price action remains directionless and holding in narrow range between 30 and 20 SMA’s (1.3357 / 1.3403 respectively).
Choppy trading between 1.3300 and 1.3465 extends into third week, with basing attempt at 1.3300 zone (weekly Tenkan-sen).
Rising daily cloud continues to underpin, along with bullishly aligned daily studies.
However, sustained break above pivotal 1.3400 resistance zone (Fibo 38.2% of 1.3549/1.3300 pullback / 20SMA) is required to generate stronger bullish signal for extension of recovery leg from 1.3300 higher base.
Conversely, violation of supports at 1.3357 (rising 30SMA) and 1.3341 (daily cloud top) would weaken near-term structure and risk retest of 1.3300 support, loss of which will be bearish.
Res: 1.3400, 1.3426, 1.3455, 1.3464
Sup: 1.3367, 1.3357, 1.3341, 1.3300
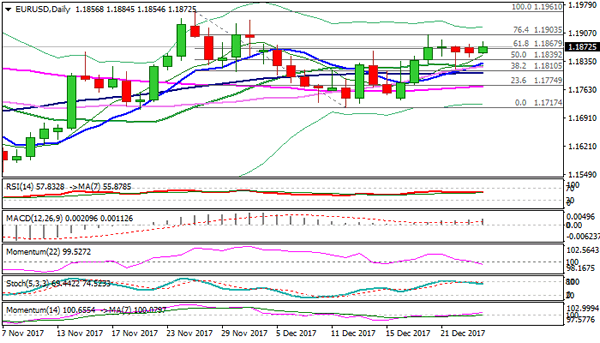
Technical Outlook: EURUSD Trades In Extended Consolidation At 1.1860 Zone
The Euro trades in extended consolidation within 1.1860 zone on Wednesday, with near-term focus turned towards initial target at 1.1900. The pair probes again above cracked pivot at 1.1867 (Fibo 61.8% of 1.1961/1.1717 pullback) as previous attempts did not result in clear break. Technical studies remain supportive, as multiple MA's bull-crosses and bullish momentum on daily chart continue to underpin. Sustained break above 1.1867/1.1900 Fibo barriers (61.8%/76.4%) is needed to open way for retest of key short-term resistance at 1.1961 (27 Nov high). On the other side, repeated rejections under 1.1900 would be initial signal of stall of recovery leg from 1.1737 (18 Dec low), with return and close below 1.1820 (converged 20/30 SMA's), to generate stronger bearish signal. Daily cloud twists next week (1.1793) and could attract for fresh weakness.
Res: 1.1884, 1.1900, 1.1940, 1.1961
Sup: 1.1854, 1.1836, 1.1820, 1.1793
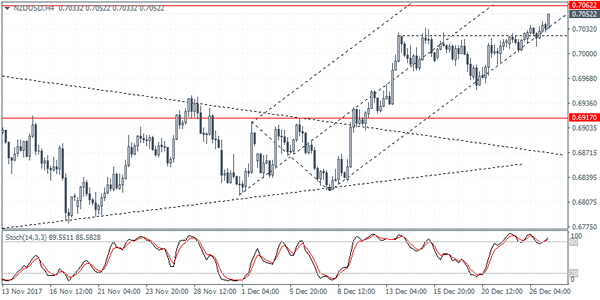
NZDUSD Intraday Analysis
NZDUSD (0.7052): The New Zealand dollar managed to consolidate above the 0.7023 level. After breaking out higher above this level, price action briefly dipped to establish support. The current bullish momentum is expected to push NZDUSD to the upside as it approaches the next key resistance level of 0.7062. Price action could either continue to the upside on a successful breakout above this resistance level. Alternately, a reversal here could see price turning flat and trading within the range.
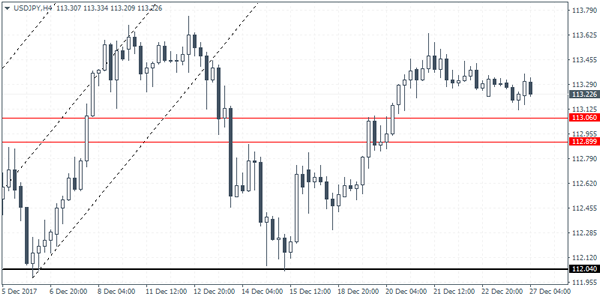
USDJPY Intraday Analysis
USDJPY (113.22): The USDJPY continues to trade flat with yesterday's session closing with a doji pattern once again. Price initially opened lower but the U.S. dollar quickly recovered to the fill gap but only to close flat on the day. Yesterday's doji marks a third consecutive day of trading flat. On the 4-hour chart time frame, USDJPY is likely to find support near the 113.00 level. Establishing support at this level could potentially indicate further upside in price. However, USDJPY will need to breakout above the previous highs posted near 113.60 in order to post further gains.
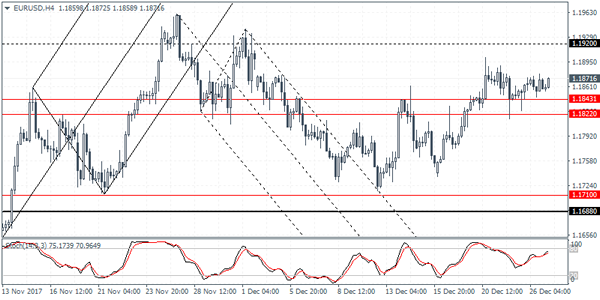
EURUSD Intraday Analysis
EURUSD (1.1871): The EURUSD closed with a doji candlestick pattern on the daily session yesterday. Price action was seen consolidating above the 1.1843 - 1.1822 level of support which indicates further upside in price. On the 4-hour chart, the EURUSD is likely to break the consolidation to the upside with the potential bull flag pattern. Immediate resistance at 1.1920 is likely to be the near term upside target in price. Alternately, in the event that EURUSD fails to break higher, we could expect price action to continue trading flat above the support level.
Markets Subdued Amid Holiday Trading
The markets were relatively quiet yesterday with most of Europe closed while the economic data from the U.S. were scant. The S&P/CS housing price index data rose 6.4%, beating estimates of 6.3%. However, the Richmond Fed manufacturing index showed a decline as the index fell to 20, down from 30 and below estimates of 22.
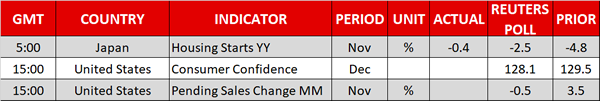
Looking ahead, the economic calendar today will see the release of the U.S. conference board's consumer confidence data. Economists expect consumer confidence to slip to 128.2 following the previous month's increase to 129.5. This is later followed by pending home sales data which is expected to post a 0.4% decline after rising 3.5% previously.
Dollar Hits 3-Week Low As Commodity Currencies Gain Ground
Here are the latest developments in global markets:
FOREX: The dollar index continued retreating, recording a three-week low. Meanwhile, commodity currencies, including the loonie, aussie and the kiwi, were posting multi-week highs versus the greenback.
STOCKS: The Nikkei 225 closed 0.1% higher. The Hang Seng was down by 0.1%, while the Shanghai Composite lost 0.9%. Euro Stoxx 50 futures traded higher by 0.1% at 0728 GMT, with Dow, S&P 500 and Nasdaq 100 contracts all being roughly flat.
COMMODITIES: WTI and Brent crude lost some ground, though they were still trading not far below the 2-½-year high levels reached yesterday. Tuesday's rise in oil prices came on the back of news of an explosion in a Libyan crude pipeline, with ongoing OPEC/non-OPEC supply cuts also being supportive of higher prices. WTI was at $59.75 a barrel and Brent at $66.74. Gold traded 0.1% up at $1,284.70 per ounce, this being a four-week high. The precious metal was finding some support from a weakening dollar.
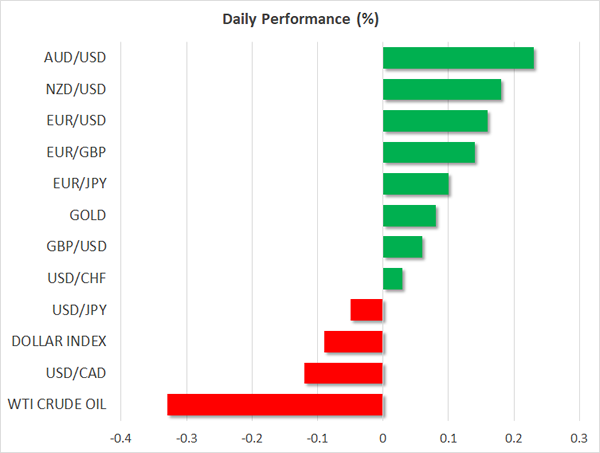
Major movers: Dollar retreats in thin trading ahead of New Year; commodity-currencies at multi-week highs
The dollar index, which gauges the US currency's strength versus the currencies of six major US trading partners, was 0.1% down at 93.18. Earlier in the day it fell to a three-week low of 93.15. The greenback was losing ground versus most other major rivals, though its losses were limited.
Despite the release of some data out of the US later on, it is expected that it will be a mostly quiet day following the Christmas holidays and ahead of celebrations for the New Year.
Dollar/yen was not much changed at 113.15. Euro/dollar was up by a bit less than 0.2% at 1.1875, with pound/dollar trading slightly higher at 1.3382.
The oil-linked Canadian dollar was on its sixth straight day of advancing versus the greenback, with dollar/loonie trading 0.1% lower at 1.2672, not far above a three-week low recorded earlier in the day.
The also commodity-linked antipodeans posted gains versus the greenback as well. Aussie/dollar was 0.2% higher at 0.7748, trading at two-month high levels. Kiwi/dollar also traded higher by 0.2%, at 0.7052. At one point it touched 0.7055, its highest since October 19.
Day ahead: US reports on consumer confidence and releases housing data
Trading volumes are anticipated to be thin on Wednesday in a holiday-shortened week. The economic calendar during today's European session will be light, with US releases being the only focus in terms of data.
At 1500 GMT the Conference Board will deliver readings on US consumer confidence. In November, the relevant index hit a 17-year high of 129.5 but now analysts expect the measure to drop back to 128.1 in December.
Meanwhile, pending home sales in the US are said to decline by 0.5% m/m in November after surging by 3.5% in the previous month. Worse-than-expected figures could drive the dollar lower versus its peers before the end of the European session.
Despite the US tax overhaul story being more or less a done deal, investors will be looking forward to the US President Donald Trump signing the relevant bill probably in early January after Congress approved the plan in the previous week.
In the Eurozone and in the absence of data, some attention will be in Catalonia where political uncertainty increased after separatist parties won parliamentary majority in the latest regional elections, bringing new headaches to the Spanish government which was the one to call the elections.
In oil markets, the API report on US crude stockpiles is due at 2135 GMT.
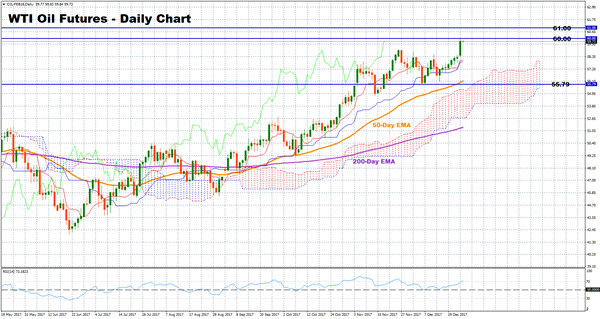
Technical Analysis: WTI oil futures peak at 2-½-year high; risk tilted to downside
WTI crude oil futures for February delivery exited a neutral phase on Tuesday, painting a bullish picture after the market peaked at more than two-year high levels. However, downside movements in the short-term are not ruled out as the futures are currently overbought, suggested by the RSI rising above 70.
In case of a decline, support could be found around the 58-59 area which acted as resistance during the past four weeks. Further decreases from here could also target a recently recorded bottom of 55.79.
On the upside, immediate resistance might occur at the 60 key-level before the 61 and 62 levels come into view.