Sample Category Title
Elliott Wave View: Nasdaq Upside Resumes
Nasdaq Short Term Elliott Wave view suggests that the decline to 6232.3 ended Intermediate wave (4). Up from there, Nasdaq has resumed the rally higher as a double three Elliott Wave structure. The first leg Intermediate wave W unfolded also as a double three Elliott Wave structure where Minute wave ((w)) ended at 6427.75, Minute wave ((x)) ended at 6383, and Minute wave ((y)) of W ended at 6545.75.
Minor wave X pullback is proposed complete at 6432.25 in the green box. Internal structure of Minor wave X unfolded as a double three Elliott Wave structure where Minute wave ((w)) ended at 6463.25, Minute wave ((x)) ended at 6520.75, and Minute wave ((y)) of X ended at 6432.25. Near term, while dips stay above 6432.25, but more importantly as far as pivot at 12/5 low (6232.3) stays intact, expect Index to extend higher. We don't like selling the Index. Unless already long with a risk free trade from 100% equal leg of Minute wave ((w))-((x)) at 6436 in the green box area, we prefer to wait for the Index to break above Minor wave W at 6545.75 before buying the dips again. At this stage, until the Index breaks above Minor wave W at 6545.75, a double correction in Minor wave X still can't be ruled out.
Nasdaq 1 Hour Elliott Wave Chart
GBP/JPY Daily Outlook
Daily Pivots: (S1) 151.21; (P) 151.39; (R1) 151.60; More...
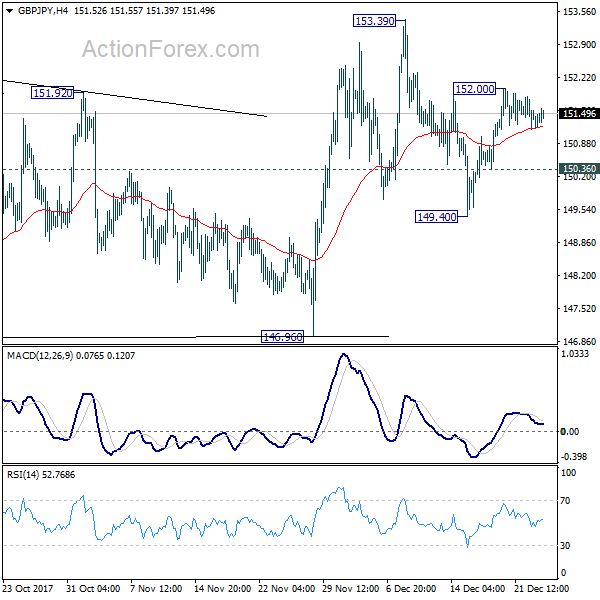
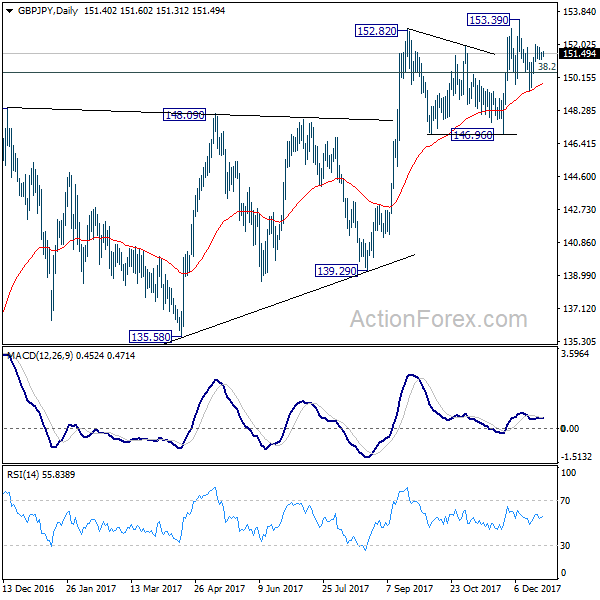
A temporary top is in place at 152.00 and intraday bias in GBP/JPY is turned neutral first. Further rally is expected as long as 150.36 holds. Above 152.00 will target 153.39 first. Break will resume medium term rally. On the downside, below 150.36 minor support will turn bias back to the downside and extend the correction from 153.39. But we'd look for strong support from 146.96 to bring rebound.
In the bigger picture, outlook is mixed up a bit with last week's sharp decline. But still, as long as 146.96 key support holds, medium term outlook remains bullish. Rise from 122.36 is in favor to extend to 61.8% retracement of 195.86 to 122.36 at 167.78. However, break of 146.96 support will indicate trend reversal. And the corrective structure of rebound from 122.36 will argue that larger down trend is resuming for a new low below 122.26.
EUR/JPY Daily Outlook
Daily Pivots: (S1) 134.02; (P) 134.29; (R1) 134.51; More....
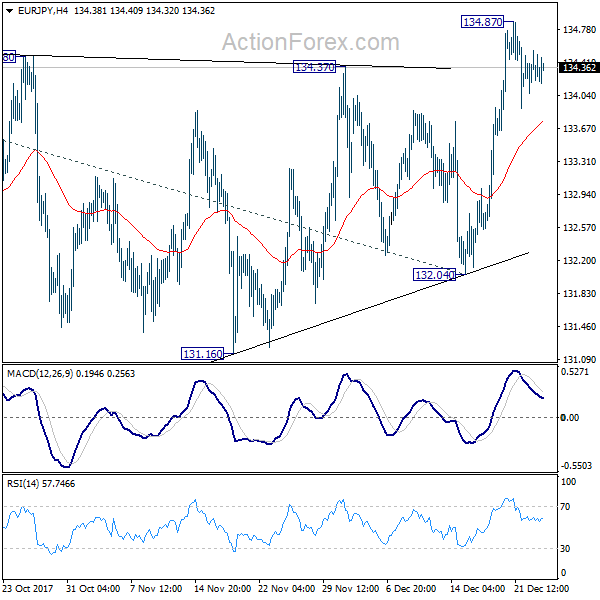
With a temporary top in place at 134.87, intraday bias in EUR/JPY is turned neutral first. Near term outlook stay bullish as long as 132.04 support holds. Above 134.87 will resume medium term rally and target 61.8% projection of 114.84 to 134.39 from 132.04 at 144.12.
In the bigger picture, medium term rise from 109.03 (2016 low) is seen as at the same degree as the down trend from 149.76 (2014 high) to 109.03 (2016 low). Sustained break of 61.8% retracement of 149.76 to 109.03 at 134.20 will pave the way to key long term resistance zone at 141.04/149.76. However, break of 132.04 support will suggest medium term topping and will turn outlook bearish for deeper fall back 55 week EMA (now at 127.82).

EUR/GBP Daily Outlook
Daily Pivots: (S1) 0.8851; (P) 0.8872; (R1) 0.8885; More...
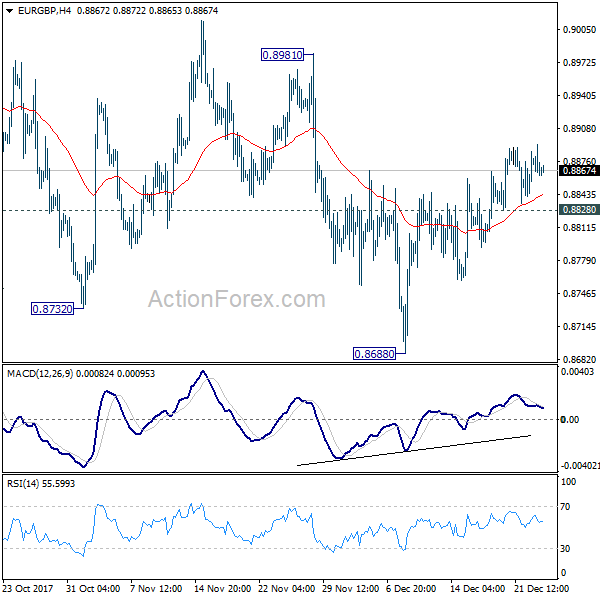
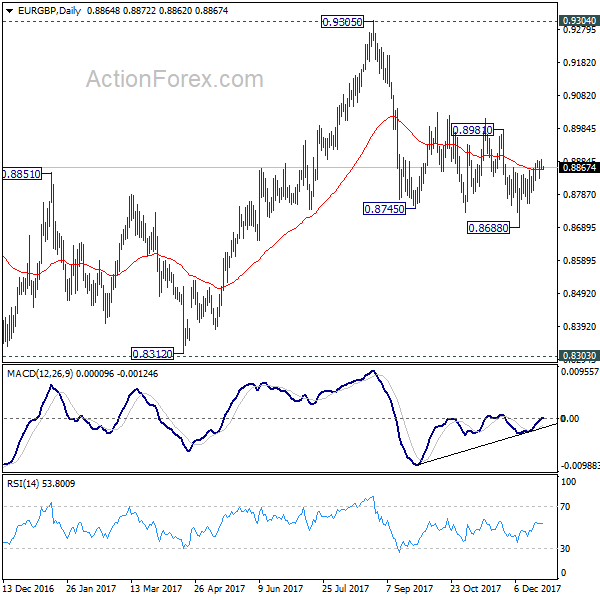
With 0.8828 minor support intact, further rise is mildly in favor in EUR/GBP for 0.8981 resistance. Sustained break there will indicate that whole decline from 0.9305 has completed. In such case, EUR/GBP will target a test on 0.9304/5 key resistance. On the downside, below 0.8828 minor support will turn bias back to the downside for 0.8668 instead.
In the bigger picture, there are various ways to interpret price actions from 0.9304 high. But after all, firm break of 0.9304/5 is needed to confirm up trend resumption. Otherwise, range trading will continue with risk of deeper fall. And in that case, EUR/GBP could have a retest on 0.8303. But we'd expect strong support from 0.8116 cluster support (50% retracement of 0.6935 to 0.9304 at 0.8120) to contain downside.
EUR/AUD Daily Outlook
Daily Pivots: (S1) 1.5327; (P) 1.5355; (R1) 1.5370; More....
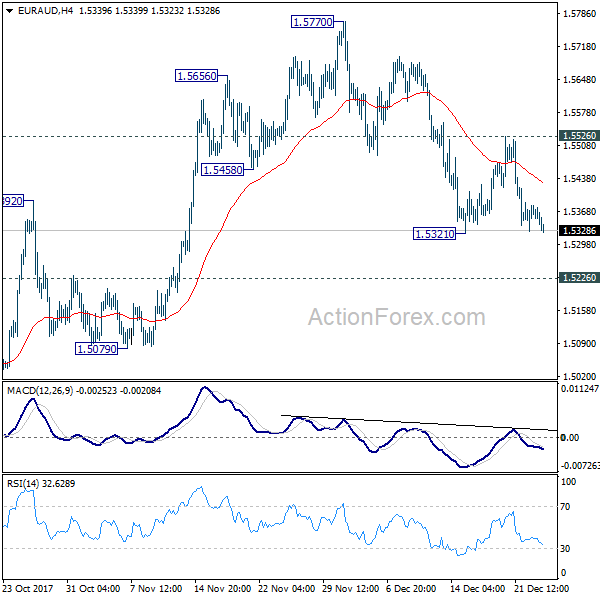
No change in EUR/AUD's outlook. Correction from 1.5770 is still in progress and deeper fall could be seen through 1.5321 support. But outlook will remain bullish as long as 1.5226 resistance turned support holds. Above 1.5526 minor resistance will turn bias back to the upside for retesting 1.5770 resistance.
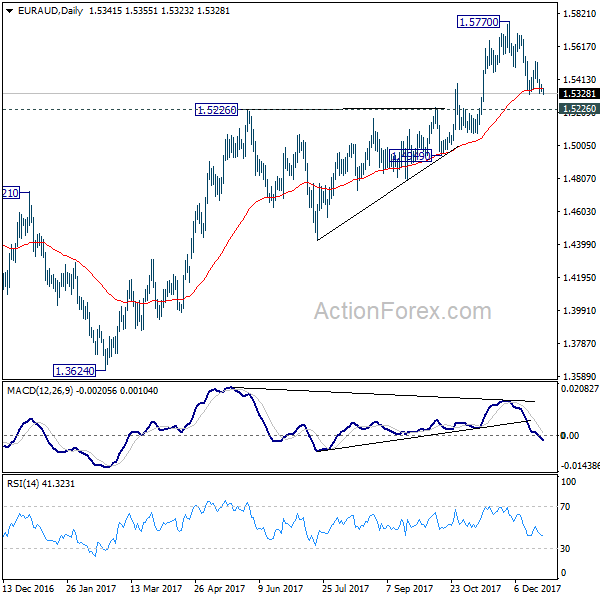
In the bigger picture, we're holding on to the view that corrective decline from 1.6587 medium term top (2015 high) has completed at 1.3624. Rise from 1.3624 is expected to extend to retest 1.6587. We'll hold on to this bullish view as long as 1.5226 resistance turned support holds. Firm break of 1.6587 will resume long term rise from 1.1602 (2012 low). However, sustained break of 1.5226 will indicate trend reversal and target 1.3624 again.
EUR/CHF Daily Outlook
Daily Pivots: (S1) 1.1673; (P) 1.1696; (R1) 1.1738; More...
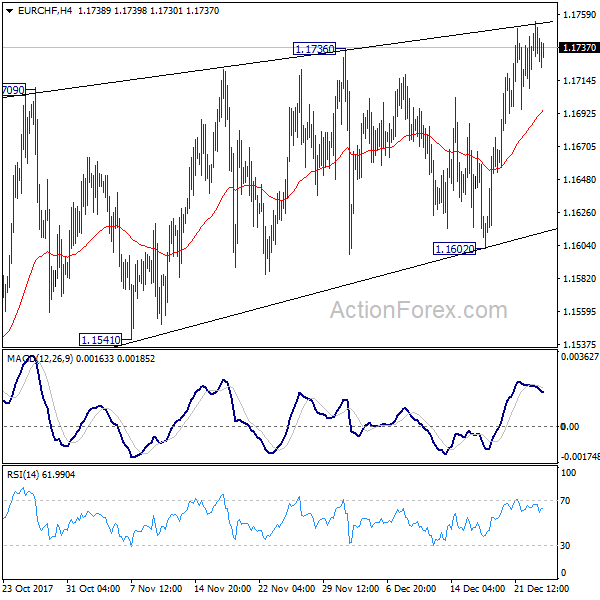
Further rise could be seen in EUR/CHF in near term. But based on weak upside momentum, we'd expect strong resistance well below 1.2 handle to bring medium term topping. On the downside, break of 1.1602 support will indicate reversal and turn outlook bearish for 1.1387 and below.
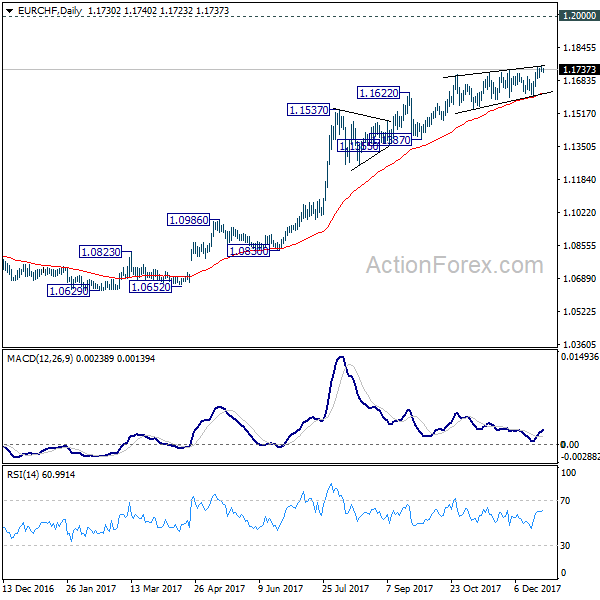
In the bigger picture, while a medium term top could be around the corner, there is no change in the larger outlook. That is, long term rise from SNB spike low back in 2015 is still in progress and would extend. As long as 1.1198 resistance turned support holds, we'll hold on to this bullish view and expect another to prior SNB imposed floor at 1.2000. Though, we'll reassess the outlook if 1.1198 is firmly taken out.
EUR/USD Daily Outlook
Daily Pivots: (S1) 1.1843; (P) 1.1861 (R1) 1.1875; More....
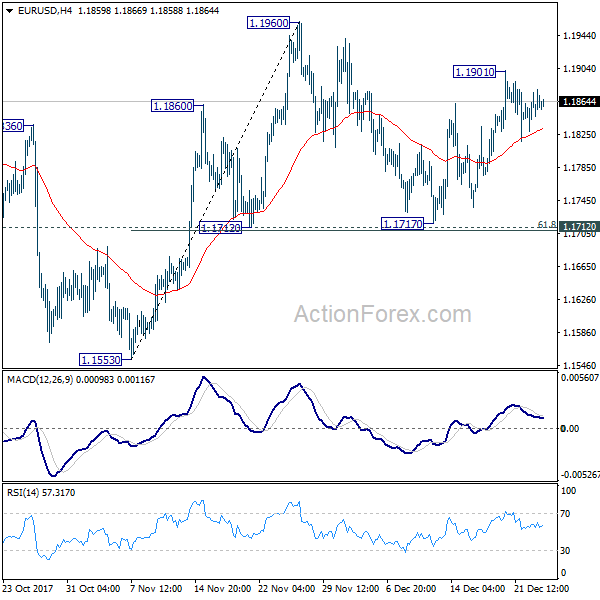
Intraday bias in EUR/USD remains neutral for the moment. As long as 1.1712 cluster support (61.8% retracement of 1.1553 to 1.1960 at 1.1708) remains intact, near term outlook stays bullish. Above 1.1901 will target 1.1960 resistance first. Break of 1.1960 will resume whole rise from 1.1553 and target 1.2091 high.
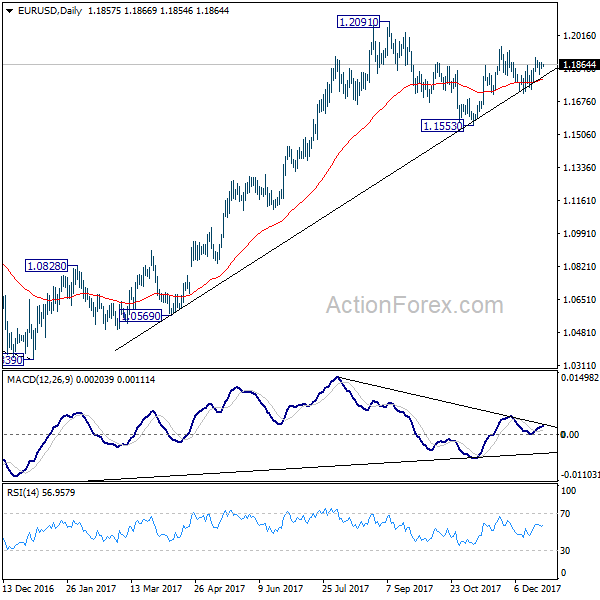
In the bigger picture, rise from 1.0339 medium term bottom is seen as a corrective move for the moment. Therefore, in case of another rally, we'd be expect 38.2% retracement of 1.6039 (2008 high) to 1.0339 (2017 low) at 1.2516 to limit upside and bring reversal. Meanwhile, sustained trading below 55 week EMA (now at 1.1435) will suggest that such medium term rebound is completed and could then bring retest of 1.0339 low.
GBP/USD Daily Outlook
Daily Pivots: (S1) 1.3350; (P) 1.3370; (R1) 1.3392; More.....
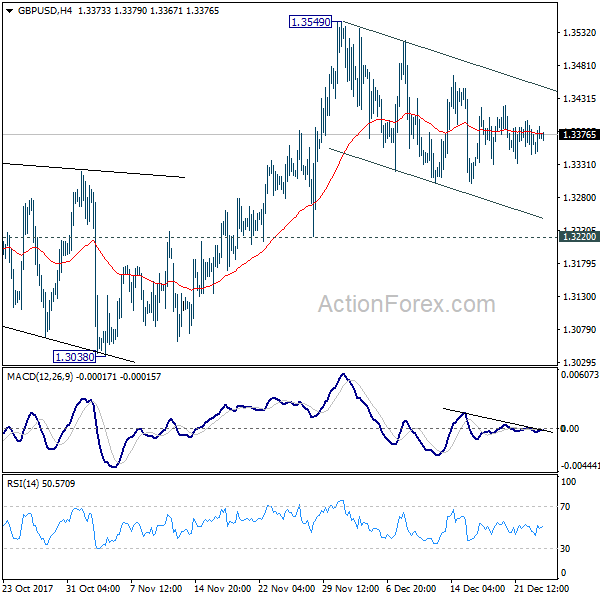
The correction from 1.3549 is still extending and intraday bias in GBP/USD remains neutral. As long as 1.3220 support holds, we'd favor another rise. Break of 1.3549 will target 1.3651 high next. Break there will resume medium term rally from 1.1946. However, firm break of 1.3220 will turn near term outlook bearish for 1.3038 key support level.
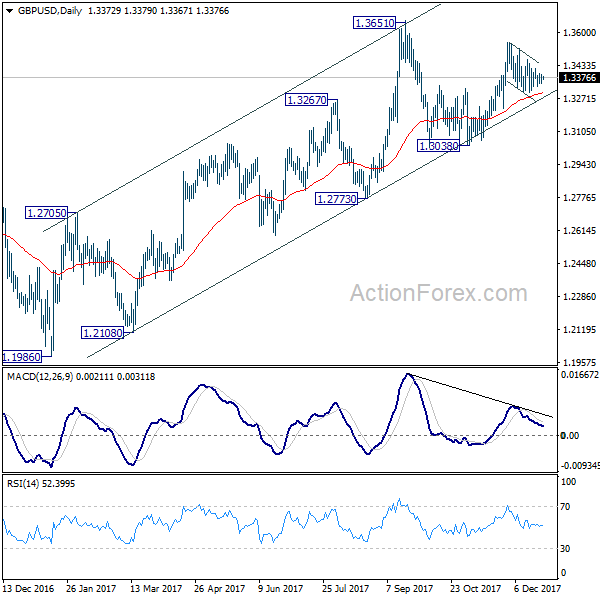
In the bigger picture, while the medium term rebound from 1.1946 low was strong, it's limited below 1.3835 key support turned resistance. As long as 1.3835 holds, we'd view such rebound as a correction. That is, we'd expect another leg in the long term down trend through 1.1946 low. However, sustained break of 1.3835 should at least send GBP/USD to 38.2% retracement of 2.1161 (2007 high) to 1.1946 (2016 low) at 1.5466.
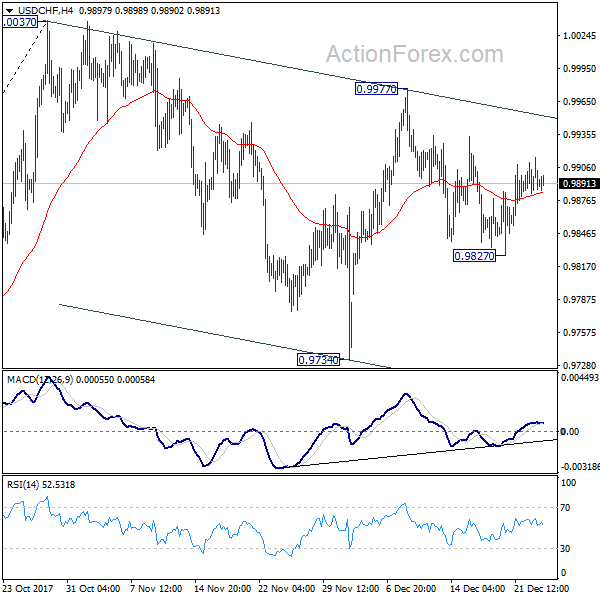
USD/CHF Daily Outlook
Daily Pivots: (S1) 0.9875; (P) 0.9895; (R1) 0.9913; More....
Intraday bias in USD/CHF remains neutral for the moment. On the upside, above 0.9977 will resume the rebound from 0.9734 for 1.0037 resistance. On the downside, below 0.9834 will probably extend the correction from 1.0037 through 0.9734. But we'd expect strong support from 61.8% retracement of 0.9420 to 0.1.0037 at 0.9656 to complete the correction from 1.0037 and bring rebound.
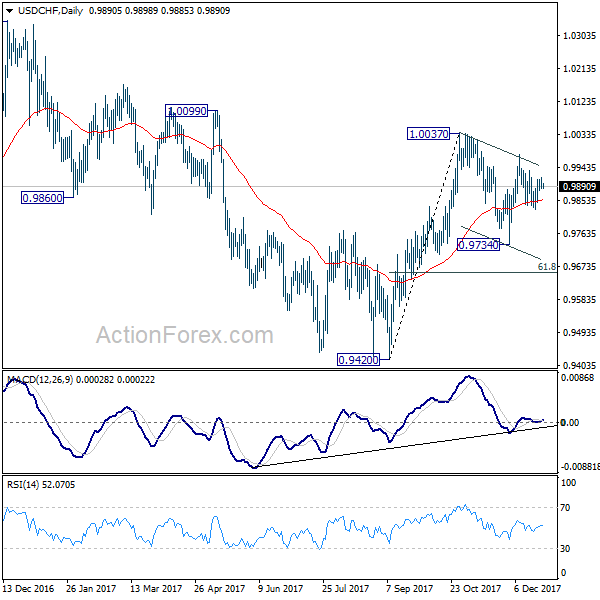
In the bigger picture, range trading continues between 0.9420/1.0342. At this point, 0.9420 appears to be a strong support level. Therefore, in case of decline attempt, we don't expect a firm break of this level. Nonetheless, strong break of 1.0342 is also needed to confirm upside momentum. Otherwise, medium term outlook will stay neutral.
USD/JPY Daily Outlook
Daily Pivots: (S1) 113.11; (P) 113.23; (R1) 113.35; More...
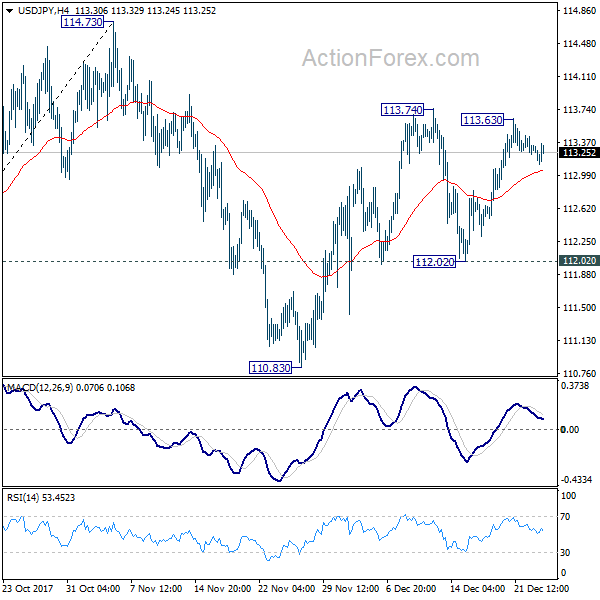
A temporary top is in place at 113.63, ahead of 113.74 resistance. Intraday bias is turned neutral first. Overall, near term outlook remains bullish as long as 112.02 support holds. Break of 113.74 will resume the rebound from 110.83 and target 114.73 key resistance. Decisive break there will carry larger bullish implications.
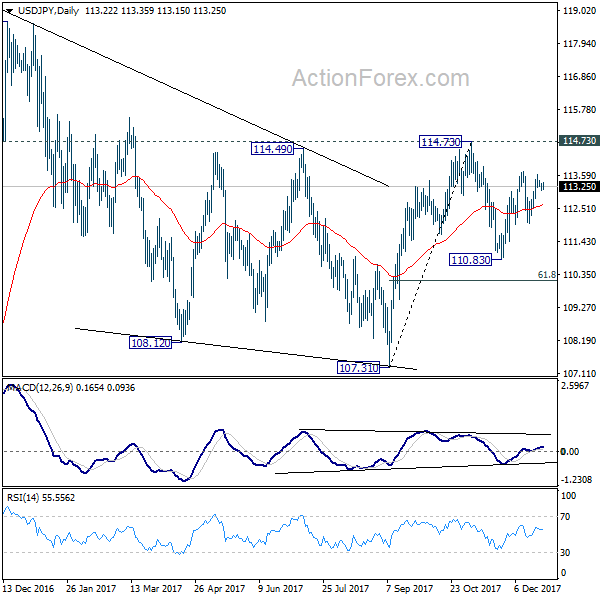
In the bigger picture, we're holding on to the view that correction from 118.65 is completed at 107.31. And medium term rise from 98.97 (2016 low) is going to resume soon. Sustained break of 114.73 should affirm our view and send USD/JPY through 118.65. However, break of 107.31 will dampen this view and extend the medium term fall back to 98.97 low.