Sample Category Title
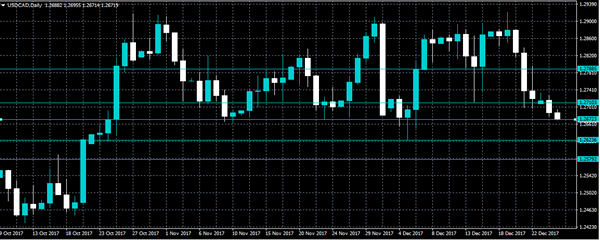
USDCAD Strongly Bearish Below 1.2672 Level
The U.S dollar has fallen sharply against the Canadian dollar, as oil prices move to multi-year highs, after a burst pipe at a major Libyan oil production plant. The price of WTI crude oil has now moved above the psychological $60 per barrel mark, for the first time since mid-2015. The USDCAD pair is now trading around the 1.2670 level, with selling pressure likely to increase if price-can clearly stay below this key level. The USDCAD pair should remain volatile, as the commodity sector remains underpinned by a strong bid tone.
The USDCAD pair is likely to remain under strong selling pressure while trading below the 1.2672 level. Further declines towards the 1.2632 and 1.2579 levels seems likely.
Should the USDCAD pair move above the 1.2672 level, further upside towards the 1.2710 and 1.2740 level remains possible.
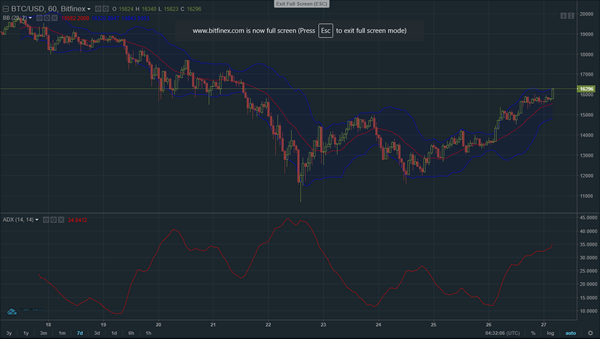
SANTA BITCOIN?
Last week, bitcoin dropped from near $20,000 to a low of below $12,000. The massive sell-off was unexpected leading to some in Wall Street to call it Armageddon.
On Christmas Eve, it started to rise and as of this article, it is trading at above $16,000.
Yesterday, reports from Israel indicated that the country was about to ban listed companies dealing with bitcoin.
Also, a Morgan Stanley report stated that bitcoin could be worth zero. According to them, bitcoin retained no value if retailers and other sellers failed to accept it.
They forgot one thing. Bitcoin might continue to do well even if no retailer accepted it. This is because of the large market that exists in the dark areas of the internet. In addition, considering that cybercrime is on the rise, bitcoin might continue to soar as criminals seek ransom in form of bitcoin. Other heavily sanctioned countries like North Korea could use bitcoin to do business without the dollar.
As shown above, bitcoin’s ADX is currently at 34, an indication that a new bullish trend is forming. This is further enhanced by the upward moving – narrow Bollinger bands.
For sure, no one knows what the future holds for bitcoin and other cryptocurrencies. However, in the meantime, traders may be skeptical on any moves to short the currencies. Instead, perhaps remaining biased towards buying the dips.
Economic Calendar Sees Light Release Schedule After Holiday
Investors can expect very little in the way of economic data on Wednesday, signalling a continuation of low-volume trade following Christmas.
UBS kicks things off at 07:00 GMT with its Swiss consumption indicator for the month of November. The monthly gauge provides a snapshot of private consumption trends in Switzerland.
One hour later, the Spanish government will report on November retail sales. Receipts at retail stores are forecast to rise 0.6%, following a 0.1% drop the previous month.
At 09:00 GMT, the Centre for European Economic Research (ZEW) will publish its monthly business survey covering the Swiss economy. The report provides a snapshot of business conditions, employment and other elements impacting the domestic economy.
Shifting gears to the United Kingdom, the British Bankers Association (BBA) will report on mortgage approvals at 09:30 GMT. Mortgage approvals are forecast to dip slightly in November to 40,472 from 40,488 the previous month.
The North American calendar will be headlined by the US pending home sales index courtesy of the National Association of Realtors (NAR). The monthly gauge, which is seen as a proxy for future sales, is expected to drop 0.5% for November. Pending home sales jumped 3.5% the month before.
Commodity traders will also be keeping close tabs on weekly oil stock data courtesy of the American Petroleum Institute (API). Last week, the industry association reported a 5.2 million-barrel drop in crude supplies.
The US Energy Information Administration (EIA) will release official inventory data on Thursday morning.
Trade volumes on the major exchanges have been lighter in recent sessions, with many market participants remaining on holiday. Low volume trading is expected to characterize the rest of the week leading up to the new year.
In currencies, the US dollar index (DXY) was little changed on Tuesday, eventually settling at 93.26. The greenback is on track for a nearly 9% drop this year.
EUR/USD
The euro gained traction on Tuesday but failed to sustain its rally. The EUR/USD exchange rate touched a session high of 1.1876 on Tuesday before paring gains later in the session. At last check, it was trading steadily at 1.1860. Trade activity is expected to remain subdued amid a dearth of economic data this week.
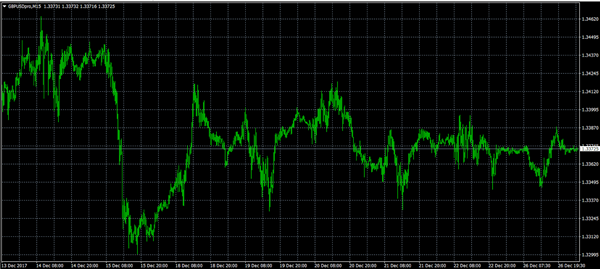
GBP/USD
The Cable had a relatively active Tuesday, as value fluctuated between 1.3346 and 1.3376. At last check, the GBP/USD exchange rate was trading at 1.3373. The pair faces immediate support at 1.3340. On the opposite side of the ledger, immediate resistance is seen at 1.3385.
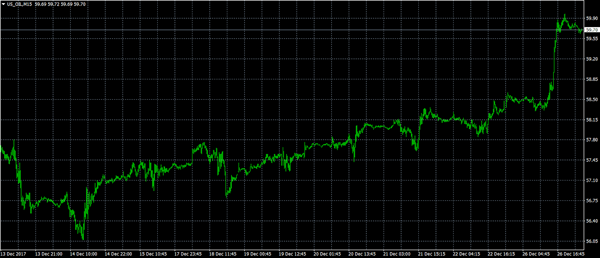
WTI OIL
US crude prices briefly traded above $60 a barrel on Tuesday for the first time in two-and-a-half years amid news of major supply disruptions in Libya. US crude prices were last seen trading around $59.70 a barrel, with further upside in store.
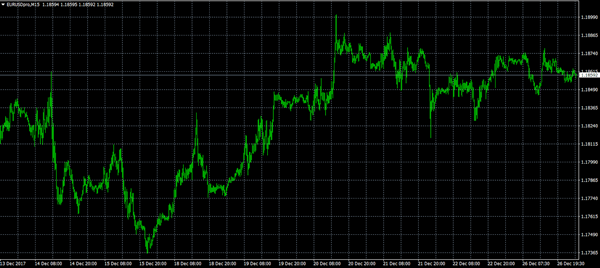
EURUSD Buying The Dip Continues During Holidays
The EUR/USD has been bought on the dip that formed the right shoulder of the bullish SHS pattern also known as - Inverted Head and Shoulders. Holiday trading is always risky due to low liquidity, and lower liquidity might in turn, produce higher volatility. But at this point, the trading has been a bit quiet. The ATR for the last 14 days is only 62 pips, and the EUR/USD has made 29 by the time of writing this analysis. As long as the EUR/USD is kept above 1.1835 targets are 1.1890. 1.1905 and 1.1950. Have in mind the ATR projection high is 1.1917, so the pair needs to break above 1.1917 with a stronger momentum to reach the W H4 resistance. If it manages to touch and stay above 1.1906, 1.1950 could be achieved by the end of the week providing we don't see any profit taking on long trades.W H3 - Weekly Camarilla Pivot (Weekly Interim Resistance)
W H4 - Weekly Camarilla Pivot (Strong Weekly Resistance)
M H4 - Monthly Camarilla Pivot (Very Strong Monthly Resistance)
M L3 – Monthly Camarilla Pivot (Monthly Support)
M L4 – Monthly H4 Camarilla (Monthly Strong Daily Support)
POC - Point Of Confluence (The zone where we expect price to react aka entry zone)
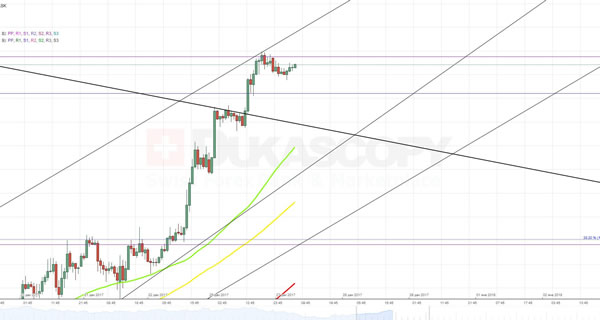
Technical Outlook: AUDUSD Extends Rally, Underpinned By Rising Metals’ Prices
The Aussie dollar remains well supported and hits fresh two-month high at 0.7768 on Wednesday's strong bullish acceleration, in extension of four-day rally, supported by rally in metals prices. Today's rally broke above pivotal barrier at 0.7738 (Fibo 38.2% of 0.8124/0.7500 descend) and pressures 100SMA (0.7779), break above which will open next key barrier at 0.7816 (daily cloud top). Bullish setup on daily chart suggests further advance, as bulls so far ignore strongly overbought conditions of slow stochastic. However, corrective action could be anticipated in the near-term (daily RSI is approaching overbought territory) with signs of stall expected on approach to daily cloud top. Corrective dips should be contained above 200SMA (0.7692) to keep bullish structure intact.
Res: 0.7779, 0.7816, 0.7865, 0.7886
Sup: 0.7738, 0.7723, 0.7692, 0.7684
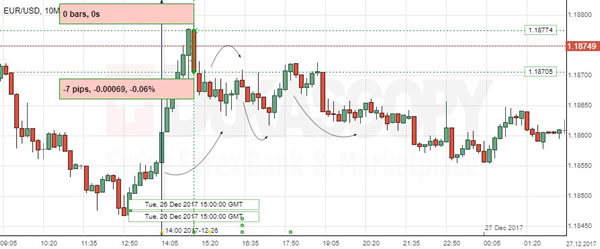
EUR/USD: Richmond Fed Manufacturing Index
The Greenback strengthened against the Euro, following the Richmond Fed report of unexpected decline in its Manufacturing Index. The EUR/USD exchange rate lost 7 base points or 0.06% to rebound from the daily high of 1.1880.
The Federal Reserve of Richmond released its survey, showing that the manufacturing growth was slower over the month of December. The Manufacturing Index dropped to 20 from 30 in the reported month, being an additional sign for the Fed to keep interest rate hike plans in 2018. Meanwhile, markets remained on a cautions stance ahead of the New Year, with the US Dollar taking less attractive stand, which could be sustained until the Fed’s new President Powell takes the position.
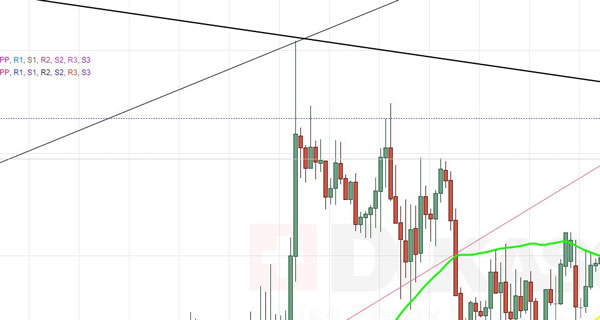
EUR/USD Tries To Bypass 1.1885
In accordance with expectations, previous trading session the currency rate mostly spent fluctuating between support and resistance zones located near the 1.1848 and 1.1876 levels. From the very first hours of the new trading day the pair inched higher to test the 61.8% Fibonacci retracement level at 1.1887. Due to formation of a junior ascending channel that is backed up by a combination of the 55- and 100-hour SMAs the exchange rate might actually break to the top. The fact that majority of pending orders are set to buy confirms this assumption. On the other hand, a number of technical indicators signal that the pair has already become overbought. There is a need to notice that apart of the CB Consumer Confidence release there are planned no macroeconomic data releases that could heat the further surge.
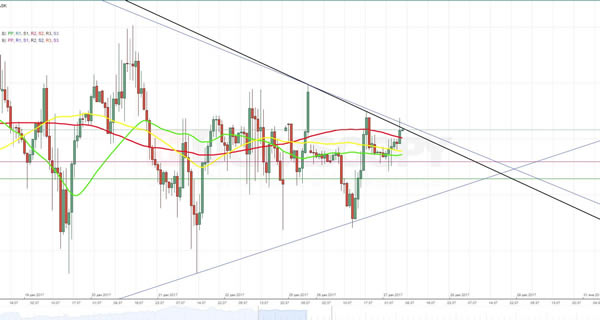
GBP/USD Still Fluctuates In Triangle
Yesterday's trading session did bring any notable changes, as expected. The Sterling is continuing to fluctuate against the Dollar in a two-week long symmetrical triangle whose upper boundary simultaneously represents the slope of a larger falling wedge formation.
Theoretically, a release of information on the American consumers' sentiment could trigger a breakout especially if data appears worse than expected. However, this event traditionally does cause high volatility, which means that the cable might stay within the pattern until the end of the day. In larger perspective, there is a need to take into account that market sentiment is rather bullish and larger part of pending orders are also set to buy.
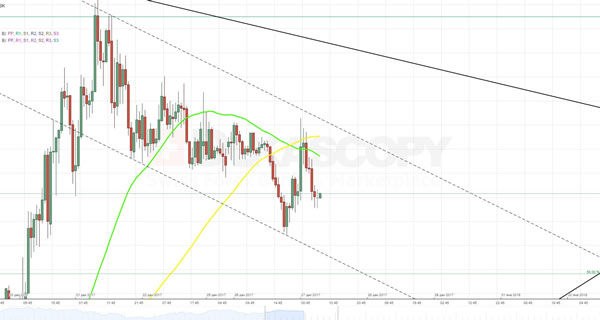
USD/JPY Prepares To Test Weekly PP
In line with expectations, first half of the previous trading session the currency rate spent in a limbo between the 55- and 100-hour SMAs and then slipped to the weekly PP at 113.10. It appears that this movement confirmed existence of a new minor descending channel. If this assumption is true, then the rate is expected to make another attempt to test the above support barrier. The positive sentiment on the buck points out on a new rebound. However, the additional pressure from two moving averages might help to push it lower. But even if this scenario materializes, the plunge should not exceed the 113.00 level, as it is secured by the 200-hour SMA and the 50% Fibonacci retracement level.
XAU/USD Breaks Through Monthly PP
Despite existence of a strong resistance barrier formed by the monthly PP and the upper trend-line of a four-month long dominant descending channel the yellow metal continued to rally against the buck and managed to reach the weekly R1 at 1,283.37. Apart from this indicator the exchange rate faces no obstacles on its way up until the 1,287.00 level, which represents location of the 100-day SMA. As more than half of all pending orders are set to buy, the bullion is likely to continue the surge. The upward movement is also supported by the junior ascending channel, which can be clearly seen on daily chart. However, this scenario could be altered if release of the CB Consumer Confidence appears to be worse than expected.