
Sample Category Title
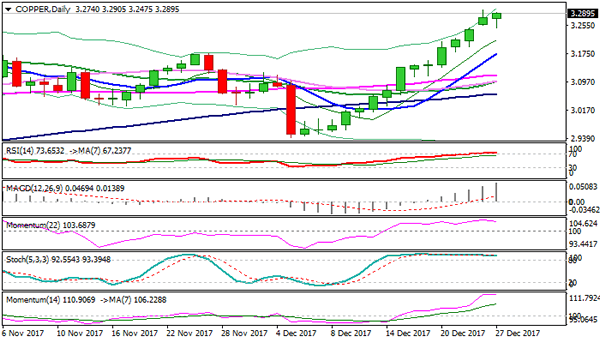
Copper Trades Near 3 ½ Year High
Copper future contract for delivery hit 3 1/2 year high at $3.2980 in extension of two-week uninterrupted rally from $2.9425 trough. Metal rallied to new high on Tuesday after post-holiday trading started with gap-higher opening, with strong support coming from expectations of stronger demand from China – metal's top consumer. The price was slightly lower on Wednesday, but dips were so far limited, despite reversal signals developing on overbought daily studies. However, corrective action should be anticipated in coming session as daily RSI and slow stochastic are turning south in overbought territory. Near-term action was so far contained by rising hourly cloud (spanned between $3.2620 and $3.2397) with limited downside risk seen while the cloud holds dips. Sustained break lower is needed to confirm correction, which should be ideally contained by supports at $3.1760 (10SMA) and $3.1622 (Fibo 38.2% of $2.9425/$3.2980 ascend) to keep bullish structure intact for extension and close above $3.2930 (14 July 2014 peak) which would signal further advance. The price is currently riding on the third wave of five-wave sequence from $1.9360 (15 Jan 2015 low) which could extend to its 100% Fibonacci expansion at $3.3600. Conversely, deeper pullback towards $3.1200 zone (daily cloud top) could be expected on firm break below $3.1622 pivotal support.
Res: 3.2980; 3.3050; 3.3325; 3.3600
Sup: 3.2620; 3.2475; 3.2141; 3.1760
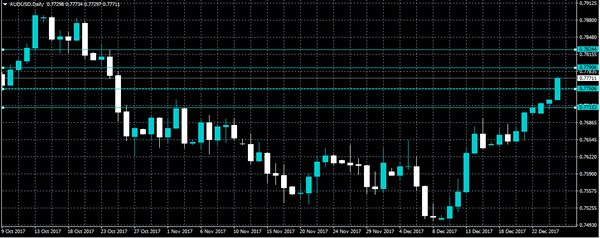
AUDUSD Strongly Bullish Above 0.7750 Level
The Australian dollar has moved to a two-month trading high against the U.S dollar, hitting 0.7775, as commodity related currencies gain strength across the board. The AUDUSD pair currently trades around the 0.7770 level, underpinned by soaring gold and iron-ore prices, and a much weaker U.S dollar index. After performing multiple daily closes above the key 0.7715 technical level, AUDUSD buyers are now firmly in control of the pair. Traders now look to the U.S markets reaction to rising global commodity prices, and high-impacting macro-economic data from the United States economy.
The AUDUSD pair remains strongly bullish while trading above the 0.7750 technical level. Further upside towards 0.7790 and 0.7824 remains possible.
Should the AUDUSD pair move below the 0.7750 level, sellers are likely to re-test the key 0.7715 technical support level.
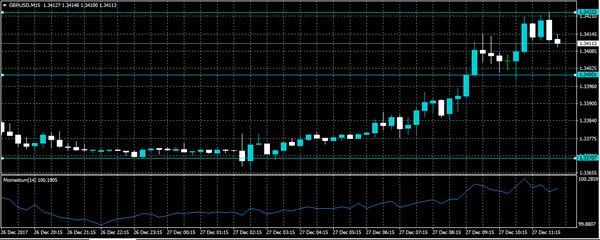
GBPUSD Intraday Bullish Above 1.3400
The British pound is gaining upside momentum against the U.S dollar, with the pair starting to maintain price-action above the key 1.3400 level. Traders have sold the greenback across the board on Wednesday, leading to a weakening of the U.S dollar index towards the 93.00 mark. The GBPUSD pair currently trades around the 1.3410 level, after posting a fresh new price-high at 1.3422. Heading into the U.S trading session, financial markets await the release of December Consumer Confidence data from the U.S economy, and Pending Home Sales for the month of November.
The GBPUSD pair remains intraday bullish while trading above the 1.3400 level, further upside towards the 1.3422 and 1.3444 levels appears likely.
Should price-action on the GBPUSD fall below the 1.3400 level, sellers may push price-action towards the 1.3370 and 1.3340 support levels.
CAC Unchanged in Subdued Trading
After posting strong gains late last week, the CAC index is showing little movement. The Paris exchange was closed on Monday and Tuesday. In Wednesday trade, the CAC is at 5367.80, up 0.06% since the Friday close. There are no eurozone or French events on the schedule, so traders can expect a quiet Wednesday session.
The CAC has been quiet this week, but that could change after the Christmas break, when investors return from holidays and assess the volatile political situation after the election in Catalonia. Will the stock markets react negatively to the strong showing by pro-independence parties? The vote marks a scathing rebuke for Spanish Prime Minister Mariano Rajoy, who called the snap election after imposing direct rule on the region after Catalonia declared independence from Spain. Rajoy's heavy-handed approach has failed to curb the pro-independence movement, and Spain could be headed for more political turmoil in the coming months.
The French economy continues to rebound, as indicators in the second largest economy in the eurozone continue to point upwards. The economy has been expanding, exports are up and unemployment has dropped. Consumer spending, a key driver of economic growth, looked sharp in November, jumping 2.2%. The impressive reading comes after a decline of 1.9% in October and marked the highest gain since February 2012.
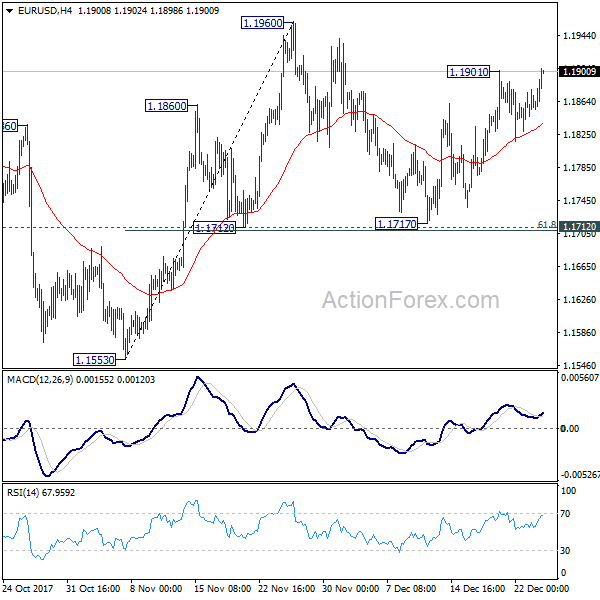
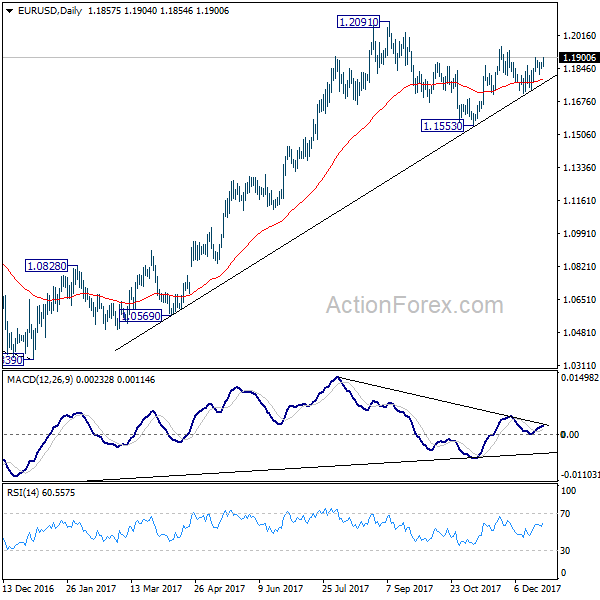
EUR/USD Mid-Day Outlook
Daily Pivots: (S1) 1.1843; (P) 1.1861 (R1) 1.1875; More....
EUR/USD's breach of 1.1901 temporary top suggests that rebound from 1.1717 is resuming. Intraday bias is back on the upside for 1.1960 first. Break there will also resume the rise from 1.1553 and target 1.2091 high. In case case, near term outlook will remains bullish as long as 1.1712 cluster support (61.8% retracement of 1.1553 to 1.1960 at 1.1708) remains intact.
In the bigger picture, rise from 1.0339 medium term bottom is seen as a corrective move for the moment. Therefore, in case of another rally, we'd be expect 38.2% retracement of 1.6039 (2008 high) to 1.0339 (2017 low) at 1.2516 to limit upside and bring reversal. Meanwhile, sustained trading below 55 week EMA (now at 1.1435) will suggest that such medium term rebound is completed and could then bring retest of 1.0339 low.
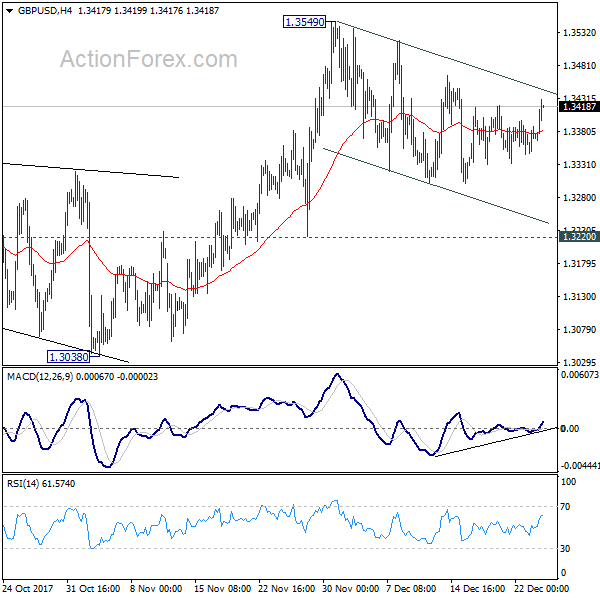
GBP/USD Mid-Day Outlook
Daily Pivots: (S1) 1.3350; (P) 1.3370; (R1) 1.3392; More.....
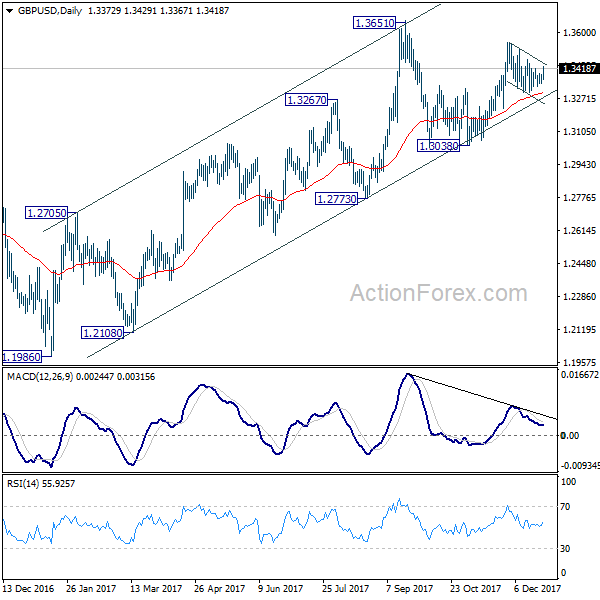
GBP/USD rebounds today but still, it's staying in corrective pattern from 1.3549. Intraday bias remains neutral at this point. As long as 1.3220 support holds, we'd favor another rise. Break of 1.3549 will target 1.3651 high next. Break there will resume medium term rally from 1.1946. However, firm break of 1.3220 will turn near term outlook bearish for 1.3038 key support level.
In the bigger picture, while the medium term rebound from 1.1946 low was strong, it's limited below 1.3835 key support turned resistance. As long as 1.3835 holds, we'd view such rebound as a correction. That is, we'd expect another leg in the long term down trend through 1.1946 low. However, sustained break of 1.3835 should at least send GBP/USD to 38.2% retracement of 2.1161 (2007 high) to 1.1946 (2016 low) at 1.5466.
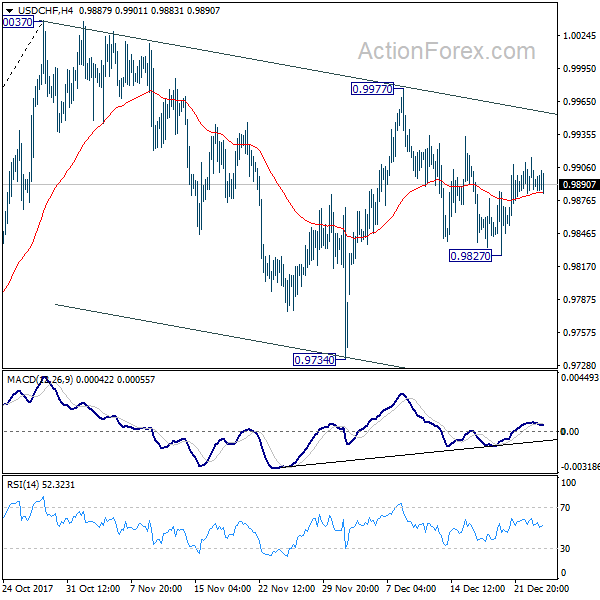
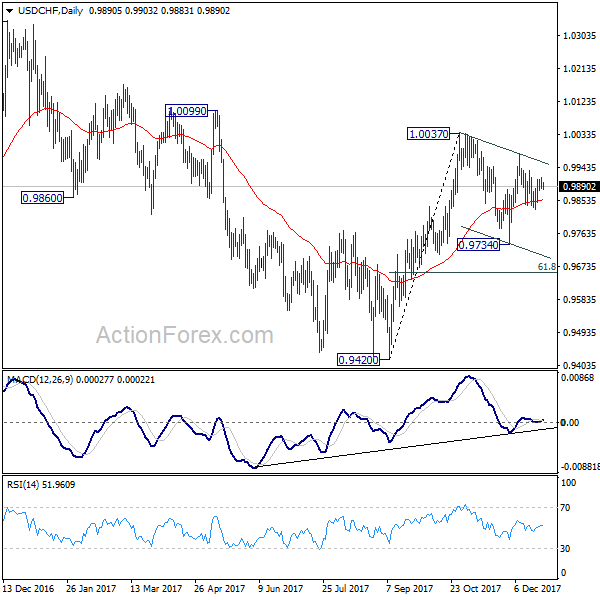
USD/CHF Mid-Day Outlook
Daily Pivots: (S1) 0.9875; (P) 0.9895; (R1) 0.9913; More....
Intraday bias in USD/CHF remains neutral at this point and more consolidative trading would be seen. On the upside, above 0.9977 will resume the rebound from 0.9734 for 1.0037 resistance. On the downside, below 0.9834 will probably extend the correction from 1.0037 through 0.9734. But we'd expect strong support from 61.8% retracement of 0.9420 to 0.1.0037 at 0.9656 to complete the correction from 1.0037 and bring rebound.
In the bigger picture, range trading continues between 0.9420/1.0342. At this point, 0.9420 appears to be a strong support level. Therefore, in case of decline attempt, we don't expect a firm break of this level. Nonetheless, strong break of 1.0342 is also needed to confirm upside momentum. Otherwise, medium term outlook will stay neutral.
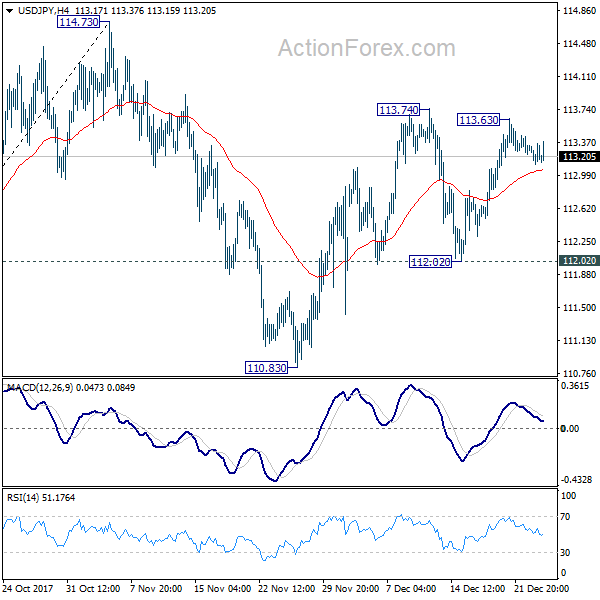
USD/JPY Mid-Day Outlook
Daily Pivots: (S1) 113.11; (P) 113.23; (R1) 113.35; More...
Intraday bias in USD/JPY remains neutral for consolidation below 113.63/74. Overall, Overall, near term outlook remains bullish as long as 112.02 support holds. Break of 113.74 will resume the rebound from 110.83 and target 114.73 key resistance. Decisive break there will carry larger bullish implications.
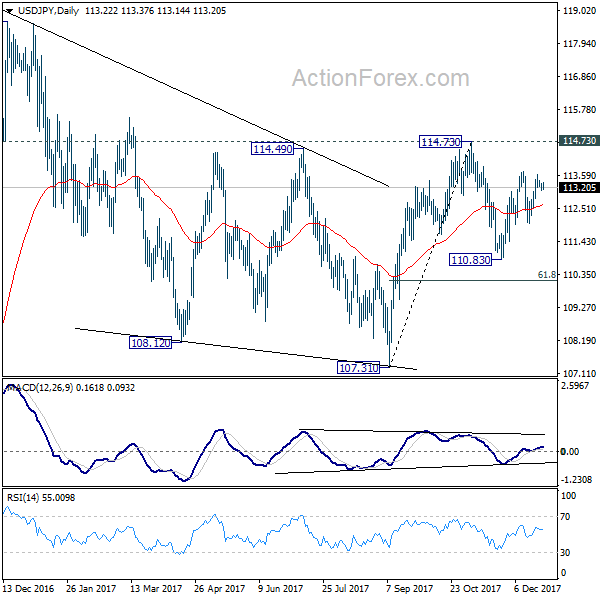
In the bigger picture, we're holding on to the view that correction from 118.65 is completed at 107.31. And medium term rise from 98.97 (2016 low) is going to resume soon. Sustained break of 114.73 should affirm our view and send USD/JPY through 118.65. However, break of 107.31 will dampen this view and extend the medium term fall back to 98.97 low.
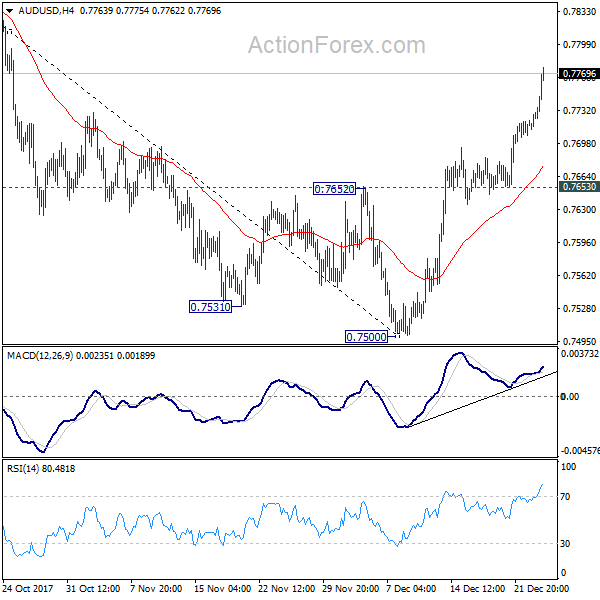
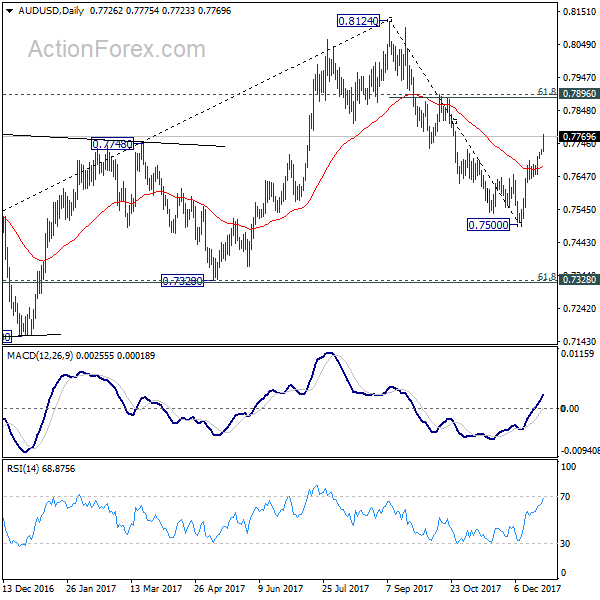
AUD/USD Mid-Day Outlook
Daily Pivots: (S1) 0.7717; (P) 0.7723; (R1) 0.7734; More...
AUD/USD surges to as high as 0.7775 so far as rebound from 0.7500 extends. Current development suggests that the decline from 0.8124 is completed. It remains to be seen if rise from 0.7500 is an impulsive move. But intraday bias will stay on the upside for 0.7896 cluster resistance (61.8% retracement of 0.8124 to 0.7500 at 0.7886). On the downside, break of 0.7653 support is needed to indicate the completion of the rebound. Otherwise, further rise will remain in favor in case of retreat.
In the bigger picture, we're still slightly favoring the case that corrective rise from 0.6826 medium term bottom is likely completed at 0.8124, after hitting 55 month EMA (now at 0.8034). But stronger than expected rebound from 0.7500 is dampening this bearish view. On the downside, break of 0.7500 will target 0.7328 key cluster support (61.8% retracement 0.6826 to 0.8124 at 0.7322) to confirm this bearish case. But break of 0.8124 will extend the rise from 0.6826 to 38.2% retracement of 1.1079 (2011 high) to 0.6826 (2016 low) at 0.8451 before completion.
Aussie Extends Rally as Copper Surges to Highest Since 204 on China Production Cut
Commodity currencies continue to shine today with help of surge in copper prices. Aussie is so far the biggest winner, while Canadian Dollar is also strong. Sterling also gained in post-holiday trading on optimism of smoother Brexit negotiations ahead in 2018. While Dollar is weak, Swiss Franc and Yen are even weaker as markets are back in risk seeking mode.
LME copper surged to the highest level since 2014 on news that China's is cutting production. Hitting as high as It's also having a winning streak of nine days, longest since 2004. China's authority orders largest copper producer Jiangxi Copper Co to stop production for at least a week for environmental impact assessments. That followed news that earlier in the month, the no. 2 producer Tongling Nonferrous Metals Group was asked to cut production. The news also boosted the two copper stocks in HK markets, with Jiangxi gained 3.4% while Tongling rose 0.7% in Shenzen. These gains were driven by expectation of further rise in copper price. The news also gave Australian Dollar a strong boost with AUD/USD powering through 0.7732 resistance to as high as 0.7775 so far.
Oil price slips slightly today but stays generally firm. WTI crude oil is trading at around 59.50, comparing to last week's 58.50. WTI has indeed breached 60 handle earlier this week, for the first time since mid-2015. Explosion in Libyan pipeline is a key factor in the spike in oil price. The blast happened near 30km northwest of Marada. The surge in oil is giving Canadian Dollar a lift. USD/CAD dropped to as low as 1.2626 so far and is set to take on 1.5980 key support level.
Elsewhere, Japan housing starts dropped -0.4% yoy in November. Swiss UBS consumption indciator dropped to 1.47 in November, down from 1.68.
AUD/USD Mid-Day Outlook
Daily Pivots: (S1) 0.7717; (P) 0.7723; (R1) 0.7734; More...
AUD/USD surges to as high as 0.7775 so far as rebound from 0.7500 extends. Current development suggests that the decline from 0.8124 is completed. It remains to be seen if rise from 0.7500 is an impulsive move. But intraday bias will stay on the upside for 0.7896 cluster resistance (61.8% retracement of 0.8124 to 0.7500 at 0.7886). On the downside, break of 0.7653 support is needed to indicate the completion of the rebound. Otherwise, further rise will remain in favor in case of retreat.
In the bigger picture, we're still slightly favoring the case that corrective rise from 0.6826 medium term bottom is likely completed at 0.8124, after hitting 55 month EMA (now at 0.8034). But stronger than expected rebound from 0.7500 is dampening this bearish view. On the downside, break of 0.7500 will target 0.7328 key cluster support (61.8% retracement 0.6826 to 0.8124 at 0.7322) to confirm this bearish case. But break of 0.8124 will extend the rise from 0.6826 to 38.2% retracement of 1.1079 (2011 high) to 0.6826 (2016 low) at 0.8451 before completion.
Economic Indicators Update
| GMT | Ccy | Events | Actual | Forecast | Previous | Revised |
|---|---|---|---|---|---|---|
| 5:00 | JPY | Housing Starts Y/Y Nov | -0.40% | -2.60% | -4.80% | |
| 7:00 | CHF | UBS Consumption Indicator Nov | 1.47 | 1.54 | 1.68 | |
| 15:00 | USD | Consumer Confidence Index Dec | 128 | 129.5 | ||
| 15:00 | USD | Pending Home Sales M/M Nov | -0.50% | 3.50% |