Sample Category Title
Swiss Franc Trading A Tad Higher This Morning
For the 24 hours to 23:00 GMT, the USD rose 0.11% against the CHF and closed at 0.9907 on Friday.
In the Asian session, at GMT0400, the pair is trading at 0.9902, with the USD trading marginally lower against the CHF from Friday’s close.
The pair is expected to find support at 0.9872, and a fall through could take it to the next support level of 0.9843. The pair is expected to find its first resistance at 0.9933, and a rise through could take it to the next resistance level of 0.9965.
The currency pair is showing convergence with its 20 Hr moving average and trading above its 50 Hr moving average.

Canadian Manufacturing Sales Unexpectedly Dropped In October
For the 24 hours to 23:00 GMT, the USD rose 0.59% against the CAD and closed at 1.2879 on Friday.
In economic news, Canada’s manufacturing shipments surprisingly eased 0.4% on a monthly basis in October, defying market expectations for a rise of 1.0% and compared to a revised advance of 0.4% in the previous month.
In the Asian session, at GMT0400, the pair is trading at 1.2853, with the USD trading 0.2% lower against the CAD from Friday’s close.
The pair is expected to find support at 1.2764, and a fall through could take it to the next support level of 1.2676. The pair is expected to find its first resistance at 1.2916, and a rise through could take it to the next resistance level of 1.2980.
Amid a lack of any macroeconomic releases in Canada today, investor sentiment would be governed by global macroeconomic factors.
The currency pair is trading above its 20 Hr and 50 Hr moving averages.

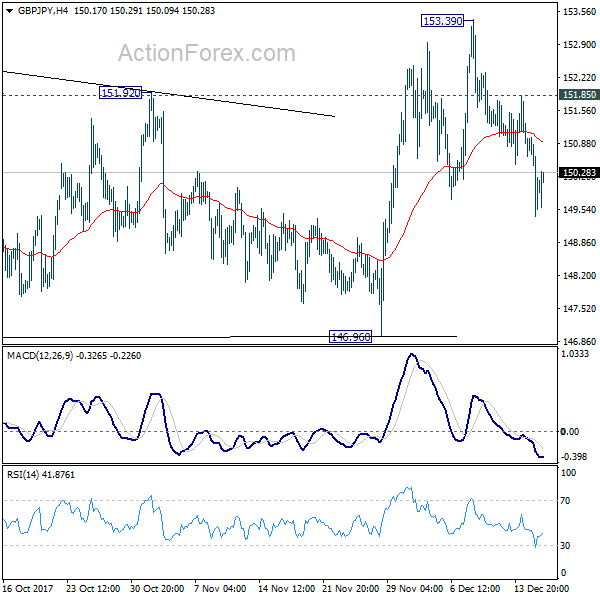
GBP/JPY Daily Outlook
Daily Pivots: (S1) 149.24; (P) 150.12; (R1) 150.85; More...
As long as 151.85 minor resistance holds, pull back from 153.39 should extend lower for 146.96 key support level. We'd look for strong support from there to bring rebound. On the upside, above 151.85 minor resistance will indicate that the pull back is finished. And intraday bias will be turned back to the upside for 153.39.
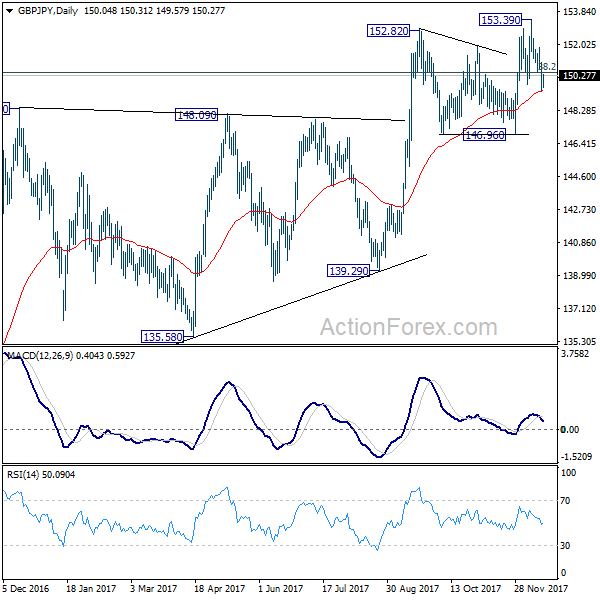
In the bigger picture, outlook is mixed up a bit with last week's sharp decline. But still, as long as 146.96 key support holds, medium term outlook remains bullish. Rise from 122.36 is in favor to extend to 61.8% retracement of 195.86 to 122.36 at 167.78. However, break of 146.96 support will indicate trend reversal. And the corrective structure of rebound from 122.36 will argue that larger down trend is resuming for a new low below 122.26.
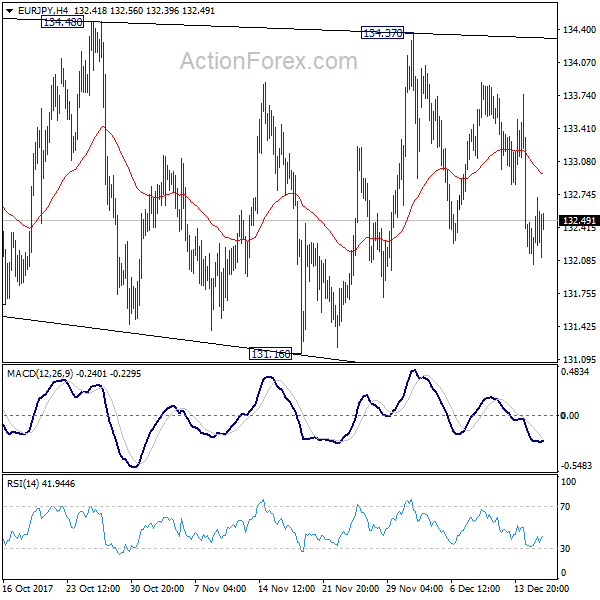
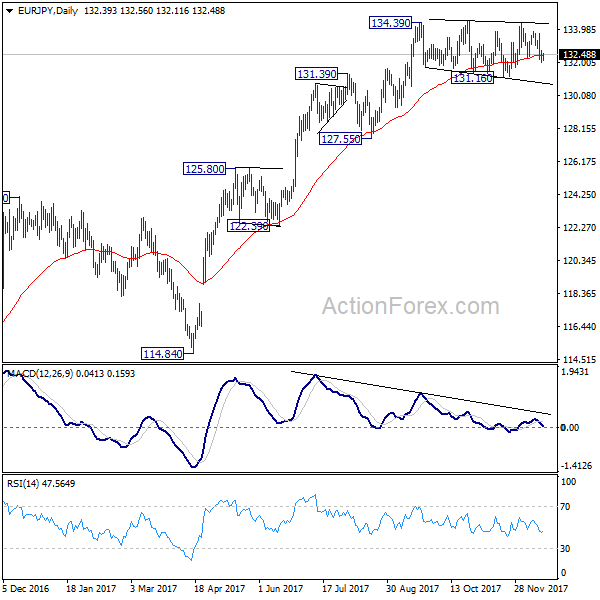
EUR/JPY Daily Outlook
Daily Pivots: (S1) 131.98; (P) 132.35; (R1) 132.66; More....
Intraday bias in EUR/JPY remains neutral and range trading continues. As long as 131.16 support holds, further rise is mildly in favor. Decisive break of 134.48 will resume medium term rise from 114.84 and target 141.04 resistance next. However, sustained break of 131.16 support will now indicate near term trend reversal and turn outlook bearish for 127.55 key support.
In the bigger picture, medium term rise from 109.03 (2016 low) is seen as at the same degree as the down trend from 149.76 (2014 high) to 109.03 (2016 low). Sustained break of 61.8% retracement of 149.76 to 109.03 at 134.20 will pave the way to key long term resistance zone at 141.04/149.76. However, break of 127.55 support will suggest medium term topping and will turn outlook bearish for deeper fall back to 114.84/124.08 support zone at least.
EURUSD Facing Crucial Support Test
Key Highlights
- The Euro failed to move above the 1.1850 resistance against the US Dollar and moved down.
- EUR/USD is now approaching a major support area around 1.1710, which must hold declines.
- Japan’s Adjusted Merchandise Trade Balance in Nov 2017 came in at ¥364.1B, better than the forecast of ¥342.4B.
- Today, the Euro Zone CPI for Nov 2017 will be released (Forecast +1.5% vs +1.5% previous, YoY), which could have a huge impact on EUR/USD.
EURUSD Technical Analysis
There were a few swing moves in the Euro this past week above 1.1800 against the US Dollar. At the end, EUR/USD failed to hold gains above 1.1820 and declined.
The US industrial production in Nov 2017 increased by +0.2% (MoM), which was less than the forecast of +0.3%. However, the EUR/USD pair failed to gain traction and started a downside move below the 1.1800.
The pair broke the 1.1780 support area and even settled below the 50% fib retracement level of the last wave from the 1.1716 low to 1.1862 high. More importantly, the pair broke the 1.1750 support and the 200 simple moving average (green, 4-hour). Later, it recovered a few pips, but struggling to move above 1.1780.
On the downside, the pair is approaching a major support area near 1.1710, which should hold declines in the short term. It seems like there is an expanding triangle forming with resistance at 1.1820 on the 4-hour chart.
As long as the pair is below 1.1820 and the 100 simple moving average (red, 4-hour), it might continue to struggle. Today, the Euro Zone will see the release of the CPI figures of Nov 2017. It is forecasted to increase by 1.5% (YoY), similar to the last reading.
Any major deviation from the +1.5% increase could ignite swing moves in EUR/USD either toward 1.1710 or 1.1820.
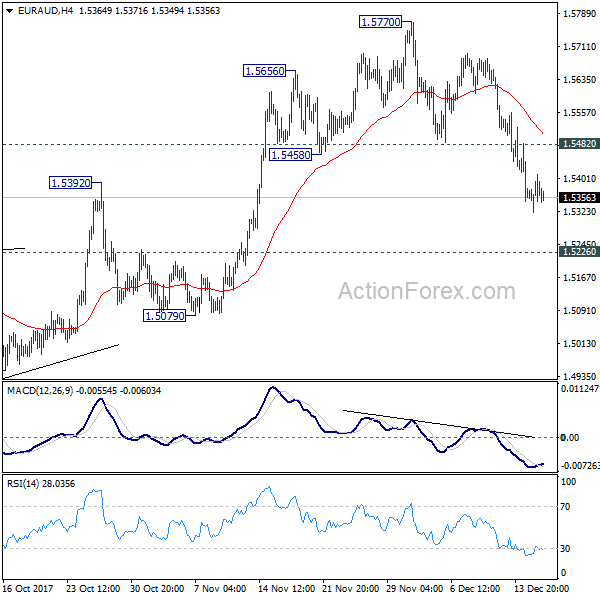
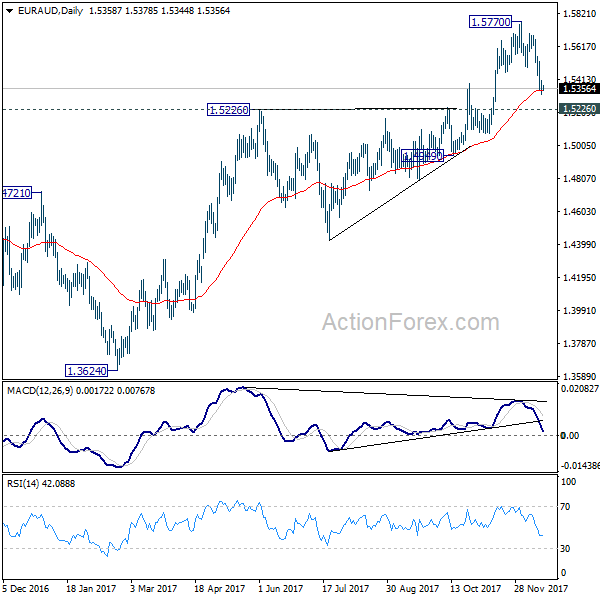
EUR/AUD Daily Outlook
Daily Pivots: (S1) 1.5323; (P) 1.5366; (R1) 1.5411; More....
EUR/AUD's correction from 1.5770 could extend lower. But we'd expect strong support from 1.5226 to contain downside to bring up trend resumption. On the upside, above 1.5482 will bring retest of 1.5770 first. However, sustained break of 1.5226 will carry larger bearish implications and turn outlook bearish.
In the bigger picture, we're holding on to the view that corrective decline from 1.6587 medium term top (2015 high) has completed at 1.3624. Rise from 1.3624 is expected to extend to retest 1.6587. We'll hold on to this bullish view as long as 1.5226 resistance turned support holds. Firm break of 1.6587 will resume long term rise from 1.1602 (2012 low). However, sustained break of 1.5226 will indicate trend reversal and target 1.3624 again.
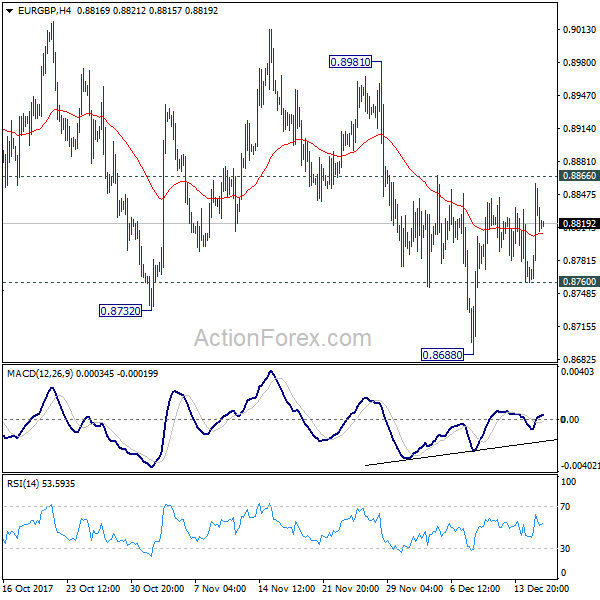
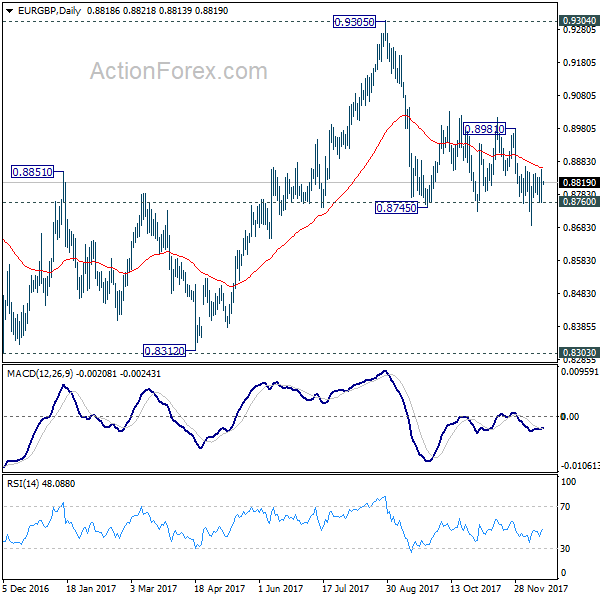
EUR/GBP Daily Outlook
Daily Pivots: (S1) 0.8764; (P) 0.8812; (R1) 0.8863; More...
Intraday bias in EUR/GBP remains neutral for the moment. Another fall is mildly in favor as long as 0.8866 holds. Below 0.8760 minor support will turn bias to the downside for 0.8688 first. Break will resume whole decline from 0.9305. However, firm break of 0.8866 resistance will indicate near term reversal and turn bias back to the upside for 0.8981 resistance and above.
In the bigger picture, there are various ways to interpret price actions from 0.9304 high. But after all, firm break of 0.9304/5 is needed to confirm up trend resumption. Otherwise, range trading will continue with risk of deeper fall. And in that case, EUR/GBP could have a retest on 0.8303. But we'd expect strong support from 0.8116 cluster support (50% retracement of 0.6935 to 0.9304 at 0.8120) to contain downside.
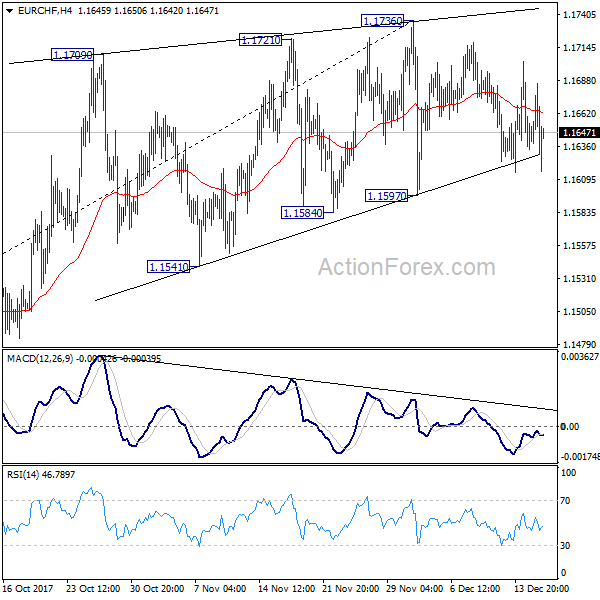
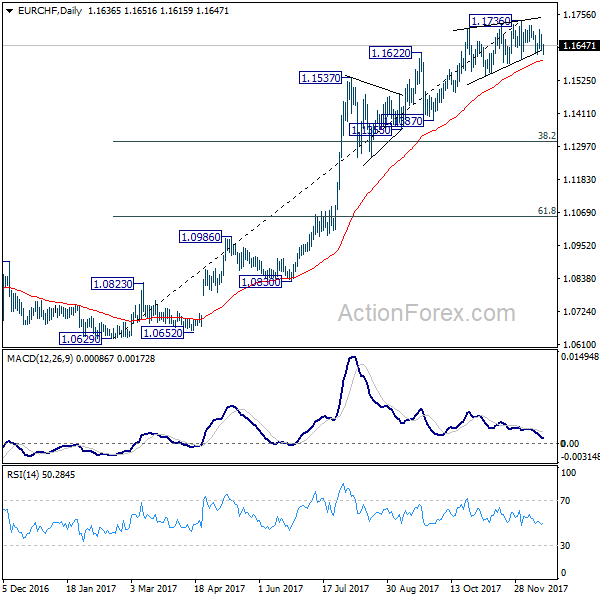
EUR/CHF Daily Outlook
Daily Pivots: (S1) 1.1613; (P) 1.1649; (R1) 1.1670; More...
Intraday bias in EUR/CHF remains neutral at this point and outlook is unchanged. We believe that the cross is close to topping, if not formed. This is under persistent bearish divergence condition in 4 hour MACD, and rising wedge like structure since 1.1709. On the downside, decisive break of 1.1597 support will a strong sign of trend reversal and should turn outlook bearish for 38.2% retracement of 1.0629 to 1.1736 at 1.1313.
In the bigger picture, while a medium term top could be around the corner, there is no change in the larger outlook. That is, long term rise from SNB spike low back in 2015 is still in progress and would extend. As long as 1.1198 resistance turned support holds, we'll hold on to this bullish view and expect another to prior SNB imposed floor at 1.2000. Though, we'll reassess the outlook if 1.1198 is firmly taken out.
Gold Shorts Still In Play
Welcome back to the final trading week before Christmas. It will be from this week that liquidity starts to fall and things could go one of two ways.
First, price could well do absolutely nothing. Trade in a boring, sideways range as tight as 20 pips a day. But it could just as easily lurch a couple of hundred pips straight down on next to no news, simply because there aren't any orders in the market to absorb the move.
I want to start off the week with a warning to keep this mind and manage your risk accordingly. There is no point in ruining what has been a great year for so many of you, simply because you're unable to step away and enjoy yourself at the very end of the year.
Onto the charts and a continuation of the bearish Gold trend we've been trading, with price still stepping down and turning previous support into resistance cleanly.
XAU/USD Hourly:
While there have been a few more steps, I've just highlighted the 2 that are actual retests thats are still in play.
I'm interested to hear how you've managed your position if you were trading short off the higher time frame resistance that held. Are you still in?
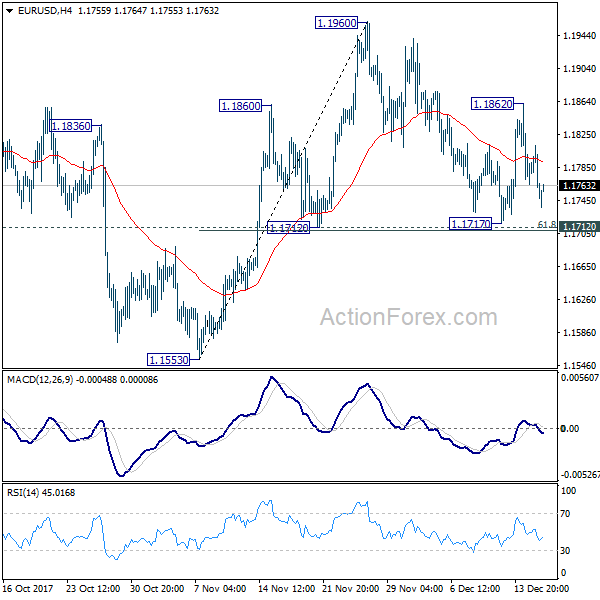
EUR/USD Daily Outlook
Daily Pivots: (S1) 1.1727; (P) 1.1770 (R1) 1.1791; More....
Intraday bias in EUR/USD remains neutral for the moment. Focus is on 1.1712 cluster support (61.8% retracement of 1.1553 to 1.1960 at 1.1708). Decisive break there should confirm completion of rebound from 1.1553 at 1.1960. This would also be supported by a head and shoulder pattern (ls: 1.1860; h: 1.1960; rs: 1.1862). And in that case, deeper fall should be seen through 1.1553 to extend the medium term decline from 1.2091. Meanwhile, above 1.1862 will revive near term bullishness and target 1.1960 and above.
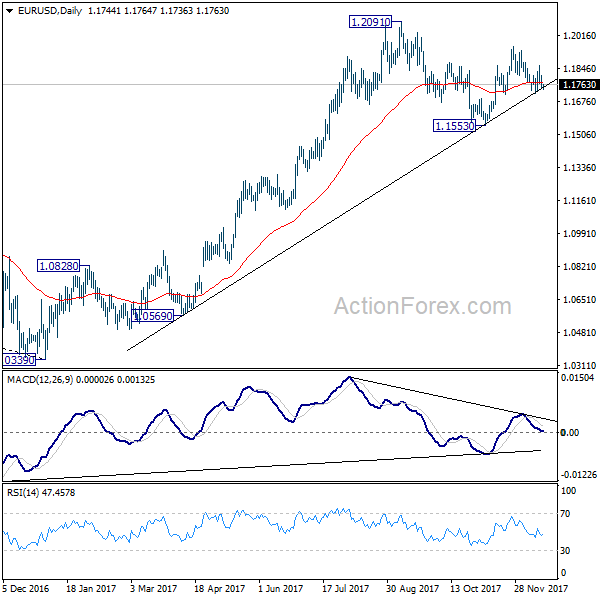
In the bigger picture, rise from 1.0339 medium term bottom is seen as a corrective move for the moment. Therefore, in case of another rally, we'd be expect 38.2% retracement of 1.6039 (2008 high) to 1.0339 (2017 low) at 1.2516 to limit upside and bring reversal. Meanwhile, sustained trading below 55 week EMA (now at 1.1435) will suggest that such medium term rebound is completed and could then bring retest of 1.0339 low.