Sample Category Title
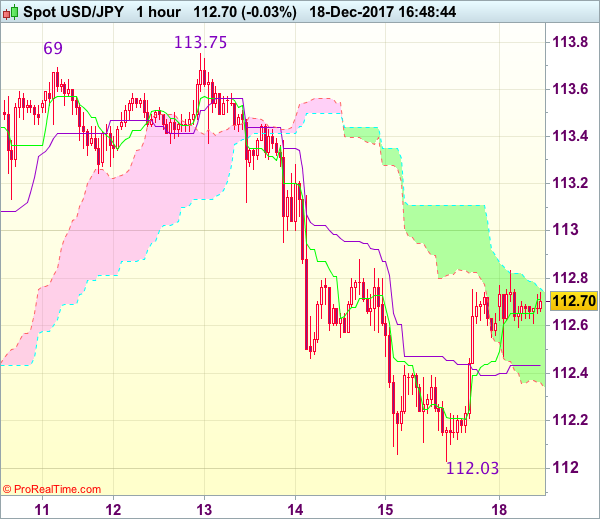
USD/JPY Rises To 112.70
An absence of any significant news in first half of the previous trading session expectedly led to a rebound from support zone located near the 112.10 mark. But then reports about agreement reached on tax reform by the House and Senate caused a spike up to the 112.70 mark.
As further path to the north is obstructed by the falling 100- and 200-hour SMAs together with the weekly PP, the Dollar is unlikely to gain much value against the Yen.
On the other hand, the 55-hour SMA in conjunction with the 50% Fibonacci retracement level should allow an active plunge as well. As a result, before the advent of some substantial news, the pair is expected to move horizontally between the above support and resistance barriers.
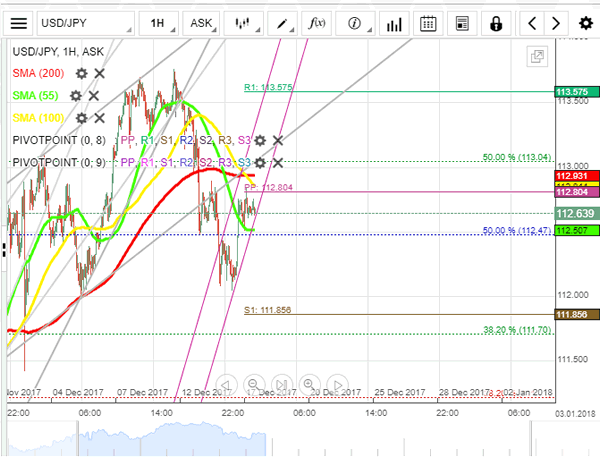
XAU/USD Tests Upper Boundary Of Senior Channel
During the last trading session the exchange rate expectedly tried to break through the upper boundary of a senior descending channel.
In the middle of the day it even managed to reach the alleged resistance zone near 1,259.00 but then was forced to retreat.
Today these attempts are expected to resume due to continuous pressure exercised by the 55 SMA. However, the growing optimist related to adoption of tax bill by the Congress is likely to result in ultimate appreciation of the buck.
On the other hand, an effect from this fundamental event might not be especially sharp due to existence of a strong support zone located around the 1,254.00 mark that is backed up by the 200-hour SMA.
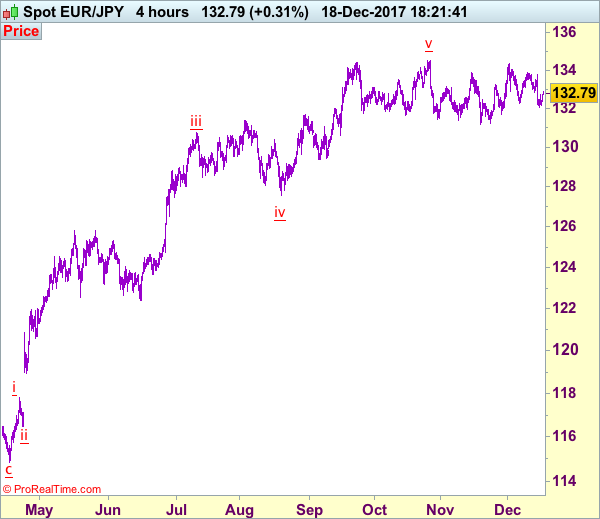
Trade Idea: EUR/JPY – Stand aside
EUR/JPY - 132.79
Original strategy:
Bought at 132.70, stopped at 132.20
Position: - Long at 132.70
Target: -
Stop: - 132.20
New strategy :
Stand aside
Position: -
Target: -
Stop:-
Although the single currency fell to as low as 132.05 late last week, the subsequent rebound suggests consolidation above this level would be seen and recovery to 133.00-10 cannot be ruled out, however, as broad outlook remains consolidative, reckon upside would be limited to 133.50-60 and price should falter below resistance at 133.89, bring further choppy trading later. Only above 133.89 resistance would revive bullishness and signal the retreat from 134.38 has ended at 132.05, bring retest of this level first.
In view of this, would be prudent to stand aside in the meantime. Below said support at 132.05 would signal the fall from 134.38 is still in progress and bring test of support at 131.72 but break there is needed to signal the rebound from 131.17 has ended, bring retest of this level first.
Our latest preferred count is that wave (ii) is ABC-X-ABC which ended at 123.33 and wave (iii) is unfolding with wave iii ended at 100.77, followed by wave iv at 111.57 and wave v as well as the wave (iii) has ended at 97.04, followed by wave (iv) at 111.43 and wave (v) has ended at 94.12 which is also the end of the larger degree v, this also implied the major wave (C) has also ended there, hence major correction has commenced from there with (A) leg unfolding in its lower degree wave c which has possibly ended at 145.69. Under this count, A-B-C wave (B) has commenced with A leg ended at 136.23, wave B at 143.79 and wave C has possibly ended at 149.79.
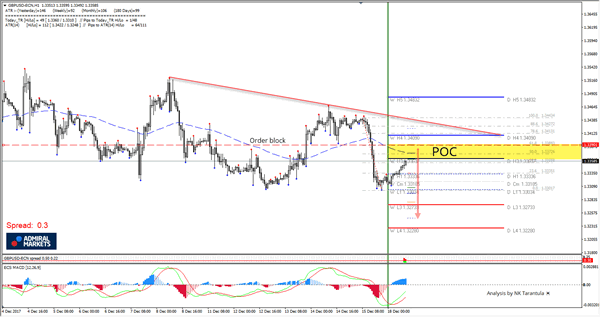
GBP/USD Is Bearish Below W H4 Camarilla Pivot
The GBP/USD has been sold on rallies recently as the Brexit talks continue to weight on the pound. Technically the pair is very close to the POC. 1.3365-89 is the POC zone ( W H3, EMA89, order block, 61.8 and ideally the pair should stay below the W H4 - 1.3409 to remain bearish. However it is Monday and we might see some up-and-down price action until the price settles down a bit. Targets are 1.3303 and if we see a clear break below, then 1.3273 and 1.3247 could be next.
W L3 - Weekly Camarilla Pivot (Weekly Interim Support)
W H3 - Weekly Camarilla Pivot (Weekly Interim Resistance)
W H4 - Weekly Camarilla Pivot (Strong Weekly Resistance)
D H4 - Daily Camarilla Pivot (Very Strong Daily Resistance)
D L3 – Daily Camarilla Pivot (Daily Support)
D L4 – Daily H4 Camarilla (Very Strong Daily Support)
POC - Point Of Confluence (The zone where we expect price to react aka entry zone)
USD/JPY Candlesticks and Ichimoku Analysis
Weekly
• Last Candlesticks pattern: Dark cloud cover
• Time of formation: 10 Jul 2017
• Trend bias: Down
Daily
• Last Candlesticks pattern: Evening doji
• Time of formation: 7 Aug 2017
• Trend bias: Down
USD/JPY – 112.87
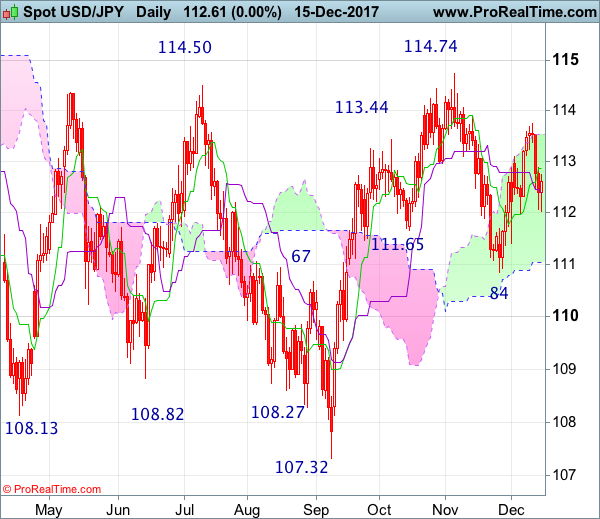
Although the greenback continued meeting resistance around 113.75 (two consecutive doji stars were formed on the daily chart) and retreated quite sharply (a long black candlestick was formed as well), as long as indicated support at 111.99 holds, further consolidation would be seen and mild upside bias remains for another rebound, above 113.30 would bring another test of 113.75 but break of previous resistance at 113.91 is needed to retain bullishness and confirm the fall from 114.74 has ended, bring further gain to 114.40-50 first.
On the downside, expect pullback to be limited to 112.30 and bring another rebound. A drop below 111.99 support would abort and signal top has been formed at 113.75 instead, bring further fall towards support at 111.41. Only below this support would shift risk to downside and signal the rebound from 110.84 low has ended, bring retest of this level. In the unlikely event that dollar drops below 110.84, this would signal the fall from 114.74 top has resumed for weakness to 110.00, then 109.50-60 but price should stay above 109.00-10.
Recommendation : Hold long entered at 112.10 for 114.10 with stop below 111.95
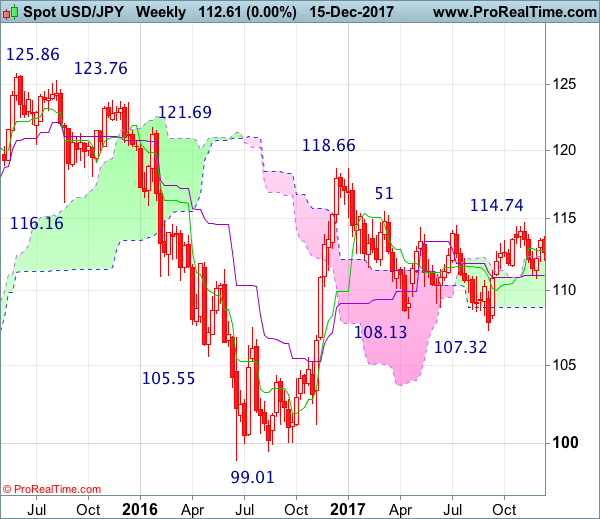
On the weekly chart, although the greenback edged higher to 113.75 early last week, lack of follow through buying and the subsequent retreat formed a black candlestick, suggesting consolidation below this level would be seen, however, still reckon support at 111.99 would limit downside and bring another rebound later, above 113.75 would extend gain to 114.00, break there would add credence to our view that the pullback from 114.74 has ended, bring retest of this level. Once this resistance is penetrated, this would signal the rise from 107.32 low has resumed for headway to 115.51-62 resistance area, break there would add credence to our view that early erratic decline from 118.66 has ended at 107.32, then upmove to 116.50-60 and possibly 117.00-10 would follow.
On the downside, expect pullback to be limited to 112.00-10 and bring another rebound later to aforesaid upside targets. Below 111.41 support would abort and suggest the rebound from 110.84 has ended instead, bring retest of this level, break there would extend the fall from 114.74 to 110.00-10, then 109.50-60 but reckon downside would be limited to 109.00 and 108.10-15 should hold from here.
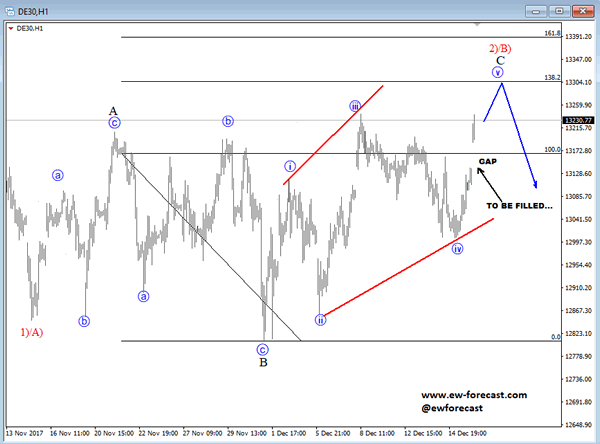
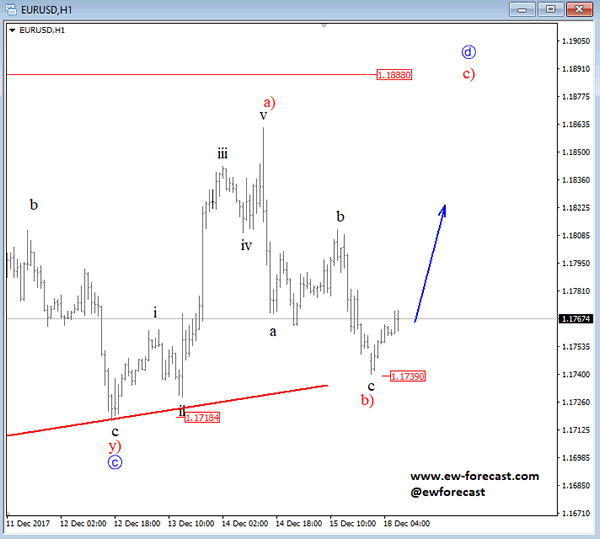
Elliott Wave Analysis: Dax Looking For A Top, While EURUSD Aiming Towards 1.1880
We have seen a new strong leg up on US stocks on Friday, which has a strong impact also on Asian and EU shares. We see a gap up on DAX, ideally into wave five of C that we were talking about already last week. As such, despite a strong push higher there can be limited upside on European shares as that gap 100 points lower is expected to get filled. We see resistance at 1.3260-1.3330.
German DAX, 1h
While stocks were up, the EURUSD came under pressure, but so far only with three legs against the previous five wave rise, so we see current leg down as a corrective b-wave that can cause a new leg up this week for wave d, ideally towards 1.1880. However, a confirmation would be a daily close above 1.1811 black wave b swing high.
EURUSD, 1h
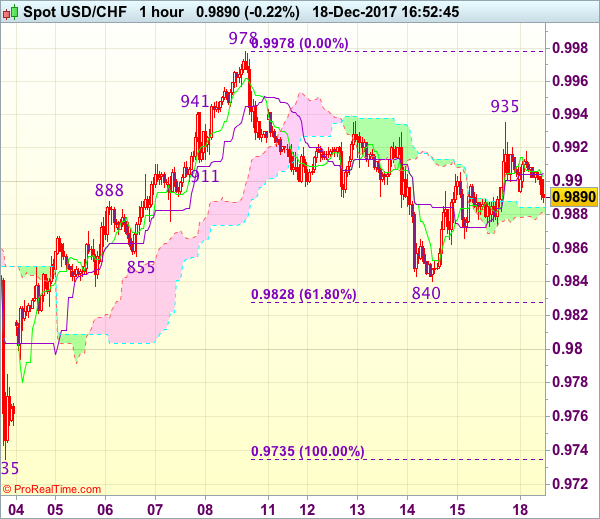
Trade Idea : USD/CHF – Hold long entered at 0.9870
USD/CHF - 0.9892
Most recent candlesticks pattern : N/A
Trend : Near term up
Tenkan-Sen level : 0.9899
Kijun-Sen level : 0.9905
Ichimoku cloud top : 0.9885
Ichimoku cloud bottom : 0.9880
Original strategy :
Bought at 0.9870, Target: 0.9970, Stop: 0.9870
Position : - Long at 0.9870
Target : - 0.9970
Stop : - 0.9870
New strategy :
Hold long entered at 0.9870, Target: 0.9970, Stop: 0.9870
Position : - Long at 0.9870
Target : - 0.9970
Stop : - 0.9870
Although the greenback has retreated again after meeting resistance at 0.9935 on Friday and consolidation below this level would be seen, as long as 0.9865-70 holds, mild upside bias remains for another rebound, above resistance at 0.9935-36 would signal low is formed at 0.9840 last week, bring further rise towards resistance at 0.9978, however, only break there would confirm recent upmove has resumed and extend headway to psychological resistance at 1.0000.
In view of this, we are holding on to our long position entered at 0.9870. Only below said support at 0.9840 would extend the fall from 0.9978 top for retracement of recent rise to 0.9820, then towards 0.9790-95, having said that, near term oversold condition should limit downside and price should stay above 0.9755-60, bring rebound later.
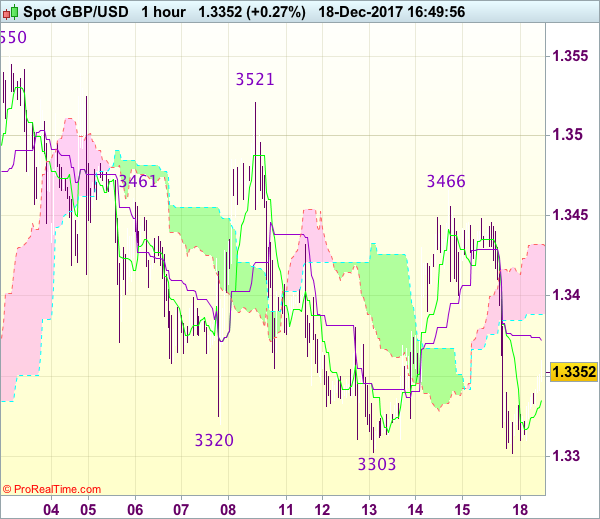
Trade Idea : GBP/USD – Sell at 1.3390
GBP/USD - 1.3352
Most recent candlesticks pattern : N/A
Trend : Sideways
Tenkan-Sen level : 1.3344
Kijun-Sen level : 1.3371
Ichimoku cloud top : 1.3432
Ichimoku cloud bottom : 1.3389
Original strategy :
Sell at 1.3370, Target: 1.3270, Stop: 1.3405
Position : -
Target : -
Stop : -
New strategy :
Sell at 1.3390, Target: 1.3290, Stop: 1.3425
Position : -
Target : -
Stop : -
As the British pound has rebounded after Friday’s cross-inspired selloff to 1.3302. suggesting consolidation above this level would be seen and test of the lower Kumo (now at 1.3389) cannot be ruled out, however, upside would be limited and cable shall head south again from there, below said support at 1.3302 would signal recent decline from 1.3550 top has resumed and may extend further weakness to 1.3280, then towards 1.3250 but still reckon previous support at 1.3221 would remain intact.
In view of this, we are looking to sell cable on recovery as 1.3385-90 should limit upside and bring another decline. Above 1.3420-25 would defer and risk rebound to 1.3445-50 but said resistance at 1.3466 should remain intact and bring another decline later.
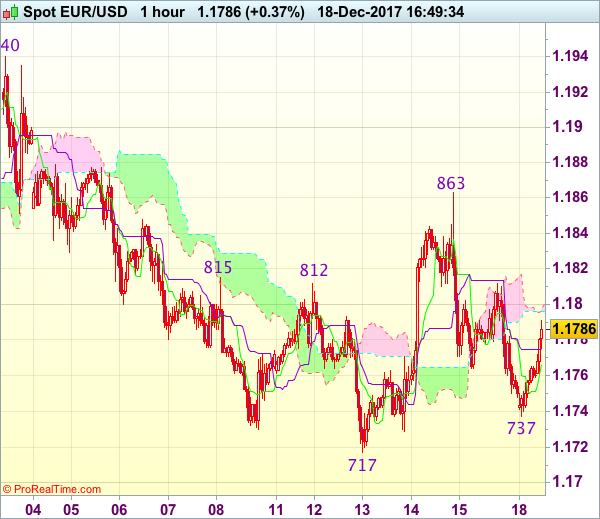
Trade Idea : EUR/USD – Stand aside
EUR/USD - 1.1789
Most recent candlesticks pattern : N/A
Trend : Near term down
Tenkan-Sen level : 1.1770
Kijun-Sen level : 1.1775
Ichimoku cloud top : 1.1799
Ichimoku cloud bottom : 1.1796
New strategy :
Stand aside
Position : -
Target : -
Stop : -
Despite intra-day initial fall to 1.1737, the subsequent rebound suggests further consolidation above last week’s low at 1.1717 would be seen and gain to 1.1815-20 cannot be ruled out, however, reckon upside would be limited to 1.1840-45 and price should falter below last week’s high at 1.1863, bring further choppy trading later. Only a break above this level would signal the rebound from 1.1717 is still in progress for further subsequent gain to 1.1880, then 1.1900 but price should falter well below resistance at 1.1940
On the downside, expect pullback to be limited to 1.1760 and said intra-day low at 1.1737 should hold, bring another rebound. A break of 1.1737 would bring retest of last week’s low at 1.1717 but break there is needed to confirm recent decline from 1.1961 top has resumed for weakness to 1.1695-00, then 1.1670-75. As near term outlook is mixed, would be prudent to stand aside for now.
Trade Idea : USD/JPY – Stand aside
USD/JPY - 112.66
Most recent candlesticks pattern : N/A
Trend : Near term up
Tenkan-Sen level : 112.71
Kijun-Sen level : 112.43
Ichimoku cloud top : 112.76
Ichimoku cloud bottom : 112.36
New strategy :
Stand aside
Position : -
Target : -
Stop : -
As the greenback has staged a strong rebound after holding above indicated previous support at 111.99, suggesting consolidation above last week’s low at 112.03 would be seen and gain to resistance at 112.88 cannot be ruled out, however, reckon upside would be limited to 113.12 (previous support) and bring another decline later.
On the downside, expect pullback to be limited to the Kijun-Sen (now at 112.43) and 112.20-25 should hold, bring another rebound later. A drop below 112.20-25 would bring another test of said support at 111.99-03 but break there is needed to retain bearishness and signal the rebound from 110.84 low has ended at 113.75, then the fall from there may extend weakness to 111.65-70 but reckon previous support at 111.41 would hold from here. As near term outlook is still mixed, would be prudent to stand aside for now.