Sample Category Title
Forex Technical Analysis: EUR/USD, USD/JPY, GBP/USD
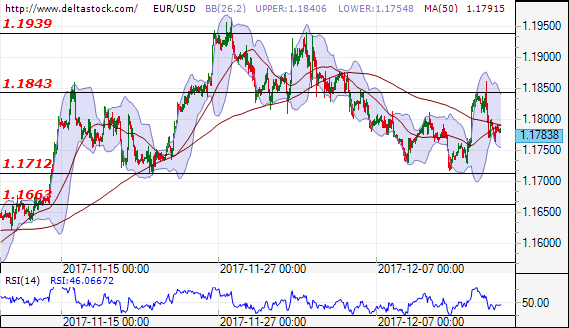
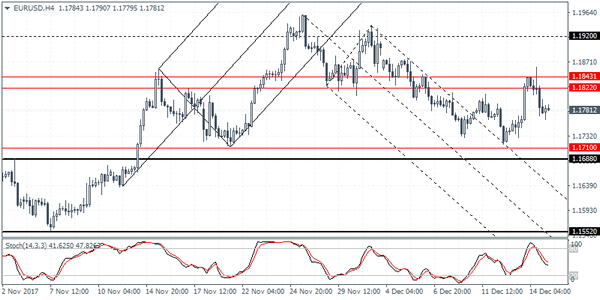
EUR/USD
Current level - 1.1783
The outlook is negative for test of the support level at 1.1712. Successful breakthrough of that level may lead to the next support level at 1.1663. In positive direction after a breakthrough of the resistance level at 1.1843, we may expect test of the next resistance at 1.1939.
| Resistance | Support | ||
| intraday | intraweek | intraday | intraweek |
| 1.1843 | 1.1939 | 1.1712 | 1.1690 |
| 1.1939 | 1.2090 | 1.1712 | 1.1550 |
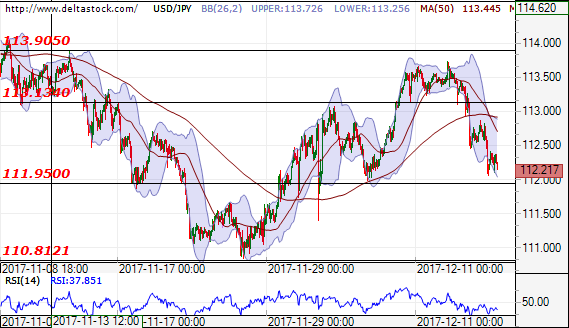
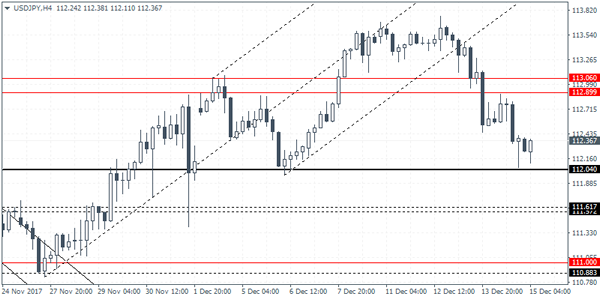
USD/JPY
Current level - 112.21
The outlook is negative again for test of the support level at 111.95 and after that at 110.80.
| Resistance | Support | ||
| intraday | intraweek | intraday | intraweek |
| 113.13 | 113.90 | 111.90 | 109.50 |
| 113.90 | 114.50 | 110.80 | 107.30 |
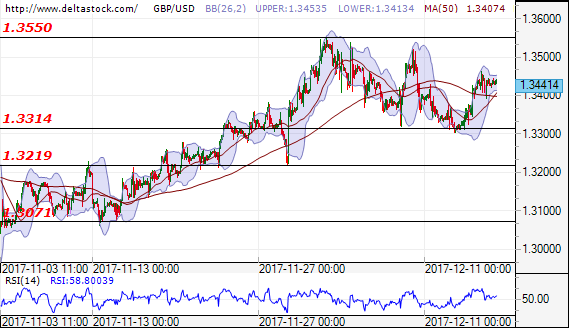
GBP/USD
Current level - 1.3441
The forecast is positive for test of the resistance level at 1.3550. In negative direction only a breakthrough of the support at 1.3314, may lead to test of the next support at 1.3219.
| Resistance | Support | ||
| intraday | intraweek | intraday | intraweek |
| 1.3550 | 1.3660 | 1.3310 | 1.3220 |
| 1.3550 | 1.3660 | 1.3220 | 1.3070 |
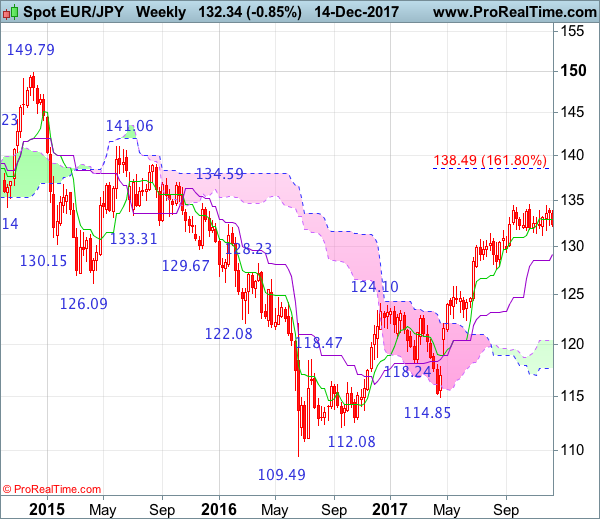
EUR/JPY Elliott Wave Analysis
EUR/JPY - 133.28
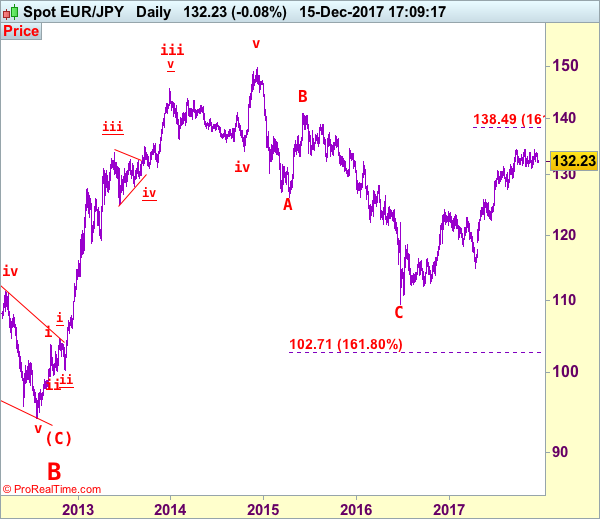
Despite this week’s initial marginal gain to 133.89, renewed selling interest emerged there and the pair has dropped sharply from there, price broke below previous support at 132.26, dampening our bullishness and signaling the retreat from 134.38 is still in progress, hence weakness to 131.72 support cannot be ruled out, however, as broad outlook remains consolidative, reckon downside would be limited and support at 131.17 should remain intact, bring another rebound later. Only below said support at 132.26 would abort and signal the rebound from 131.17 has ended, bring weakness to support at 131.72, then towards 131.17. Once this support is penetrated, this would suggest a temporary top is formed, bring retracement of recent rise to previous support at 130.62, then towards 130.00 later.
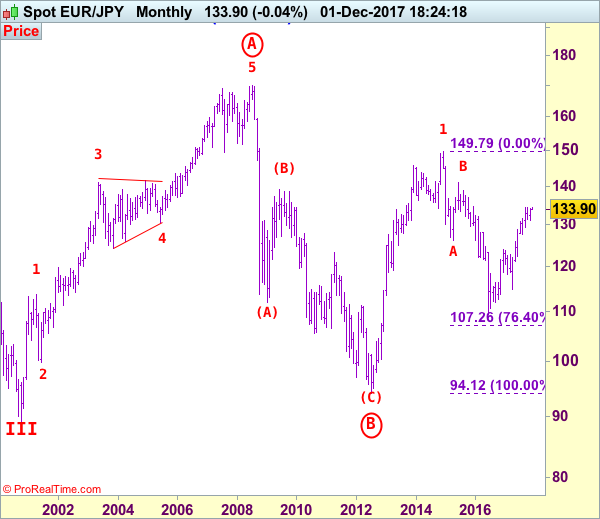
The daily chart is labeled as attached, early selloff from 169.97 (July 2008) to 112.08 is wave (A) of B instead of end of entire wave B and then the rebound from there to 139.26 is wave (B), hence, wave (C) has possibly ended at 94.12 with a diagonal triangle as labeled in the daily chart, hence upside bias is seen for further gain. Recent rally above indicated retracement level at 116.69 (50% Fibonacci retracement of the intermediate fall from 139.26-94.12) adds credence to this view and signal major reversal has commenced but first leg of this wave C has possibly ended at 149.79, hence wave 2 has commenced with wave A ended at 126.09, followed by wave B at 141.06, wave C commenced and could have ended at 109.49, indicated upside targets at 126.00 and 130.00 had been met and further gain to 135.00 would follow.
On the upside, whilst recovery to 132.50-60 cannot be ruled out, previous support at 132.85 should turn into resistance and limit euro’s upside, bring another decline later. A daily close above this level would prolong consolidation and bring another rebound to 133.40-50 but said resistance at 133.89 (this week’s high) should remain intact. Only a break above this level would revive bullishness and bring test of 134.38-50 resistance area, once this barrier is penetrated, this would confirm medium term upmove has resumed and extend gain to 135.00, and then 135.50-60.
Recommendation: Stand aside for this week.
To re-cap the corrective upmove from the record low of 88.93 (18 Oct 2000), the wave A from there is subdivided as: 1:88.93-113.72, 2:99.88 (1 Jun 2001), 3:140.91 (30 May 2003), 4:124.17 (10 Nov 2003) and 5 ended at record high of 169.97 (21 Jul 2008). The brief but sharp selloff to 112.08 is viewed as a-b-c x a-b-c wave (A) of B. The subsequent rebound to 139.26 is (B) of B and (C) of (B) has possibly ended at 94.12 and in any case price should stay well above previous chart support at 88.93, bring rally in larger degree wave C towards 150.00.
Trade Idea: AUD/USD – Buy at 0.7605
AUD/USD – 0.7688
Original strategy:
Exit short entered at 0.7620
Position: - Short at 0.7620
Target: -
Stop:-
New strategy :
Buy at 0.7605, Target: 0.7805, Stop: 0.7545
Position: -
Target: -
Stop:-
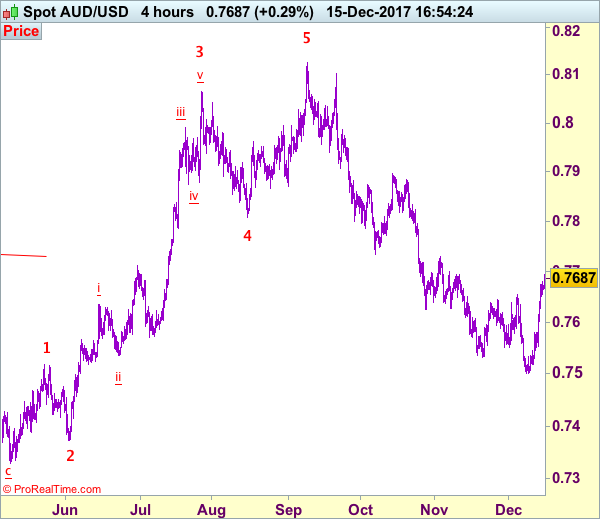
As aussie has rallied after staged a strong rebound from 0.7501, adding credence to our view that a temporary low has been formed there and the breach of resistance at 0.7654 signals recent selloff has ended, hence consolidation with upside bias is seen for at least a retracement of recent decline to 0.7700, then towards resistance at 0.7730, above there would encourage for subsequent headway to 0.7800-05 which is likely to hold from here due to near term overbought condition.
In view of this, would not chase this rise here and we are looking to buy aussie on pullback as 0.7600-05 should limit downside and bring another rally. Below previous resistance at 0.7580 would defer and risk weakness to 0.7550-55 but price should stay well above said support at 0.7501, bring another strong rebound later this month.
On the 4-hour chart, recent upmove from 0.7329 is unfolding as an impulsive rise with wave 3 as well as smaller degree wave (iii) extending, only minor wave v of (iii) has ended at 0.8125, hence bullishness remains for this move to extend headway to 0.8200, then towards 0.8300, however, reckon upside would be limited to 0.8400 and the final wave 5 should falter below 0.8500, bring correction later.
NZDUSD Intraday Analysis
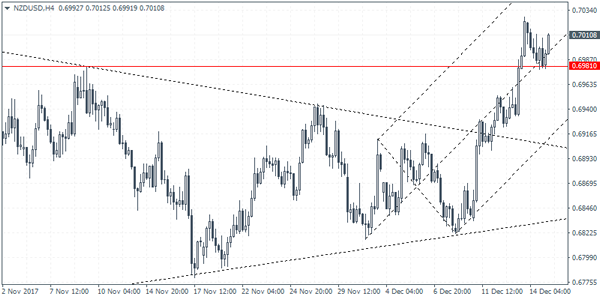
NZDUSD (0.7010): The New Zealand dollar was seen trading weaker yesterday. However, the declines were limited to the initial support level at 0.6891. Following the decline to this support, price action has posted a reversal. A close above the previous high is required in order for NZDUSD to extend the gains towards 0.7062 level of resistance. However, in the event of a failure to post fresh highs, NZDUSD could be at risk of breaking the support level. This could see price declining towards the next lower support at 0.6912.
USDJPY Intraday Analysis
USDJPY (112.36): The USDJPY extended declines for the second day as price action is seen now trading close to the support level at 112.04 region. In the short term, establishing support at this level could signal a bounce to the upside. USDJPY is expected to maintain the range within 113.00 and 112.04 levels of resistance and support. A breakout from either of these levels is expected to show further gains or declines. To the downside, the next support below 112.04 comes in at 111.61 - 111.57 region.
EURUSD Intraday Analysis
EURUSD (1.1781): The EURUSD posted declines yesterday as the ECB left the monetary policy unchanged. The long term inflation forecasts showed that consumer prices in the Eurozone could remain below the ECB's inflation target rate. This hit the sentiment in the euro which extended losses. However, as price action remains supported above the 1.1710 level of support, the bias remains to the upside. On the intraday basis, the reversal near the resistance level of 1.1822 signals a continuation to the downside. The intraday support at 1.1710 could be tested in the near term as the currency pair can be seen maintaining a sideways range within the levels mentioned.
ECB, BoE And SNB Hold The Line
The markets were busy yesterday as central bank monetary policy meetings continued. After the Fed's rate hike decision on Wednesday, Thursday was all about the central banks in Europe.
The ECB's monetary policy meeting saw the central bank leaving monetary policy unchanged. The ECB gave its economic projections which saw an upbeat forecast. However inflation was expected to still remain below the ECB's 2% inflation target rate by 2020.
The SNB's meeting was largely a non-event. Focus was mostly on the BoE's meeting. The central bank sounded optimistic that inflation was nearing its peak at 3.1%. It however said that GDP growth could slow in the coming quarters. The BoE expects a weaker Q4 GDP growth.
Looking ahead, the economic calendar today is quiet for the most part. The trade balance figures from the Eurozone are expected to be released earlier in the day while BoE Chief Economist Andy Haldane is expected to speak.
In the NY Trading session, the Canadian manufacturing sales report will be coming out and the NY Fed will be releasing the Empire State Manufacturing index report. Economists forecast the index will slightly dip to 18.8 for December.
EURO Intraday Bearish Below 1.1790 Level
The euro has moved lower against the U.S dollar, following strong U.S macroeconomic data and a cautious monetary policy speech from ECB President Mario Draghi. The EURUSD pair currently trades below the key 1.1790 technical level, following the euro making a complete reversal from the 1.1860 level on Thursday. ECB President Mario Draghi talked down medium-term inflation expectations in the eurozone during 2018, which helped push the euro lower. Traders now look to Trade Balance data from the eurozone and Manufacturing data coming out from the United States economy.
The EURUSD pair remains intraday bearish while price-action trades below the 1.1790 level, price-action may find support from the 1.1770 and the 1.1750 technical levels.
Should the EURUSD pair start to move above the 1.1790 level, buyers may again start to target the 1.1813 and 1.1840 resistance levels.
EUR/JPY Candlesticks and Ichimoku Analysis
Weekly
• Last Candlesticks pattern: Window
• Time of formation: 24 April 2017
• Trend bias: Up
Daily
• Last Candlesticks pattern: Hammer
• Time of formation: 18 May 2017
• Trend bias: Up
EUR/JPY – 132.22
Despite rebounding to 133.89 earlier this week, euro met renewed selling interest there and has dropped quite sharply yesterday, dampening our bullishness and downside risk remains for weakness to 131.99 support, break there would signal top has been formed at 134.38 earlier this month, bring test of support 131.72. Looking ahead, a drop below 131.72 would signal the rebound from 131.17 has ended, bring weakness to 131.40, then retest of this level but still reckon downside would be limited to 130.40-50 and psychological level at 130.00 should hold from here.
On the upside, whilst recovery to the Kijun-Sen (now at 132.78) cannot be ruled out, reckon the Tenkan-Sen (now at 133.03) would limit upside and yesterday’s high at 133.76 should remain intact, bring another decline. Only break of this week’s high at 133.89 would revive bullishness, bring test of 134.38 first. Having said that, a break of indicated resistance at 134.50 is needed to confirm recent upmove has resumed and extend gain to 135.00.
Recommendation: Stand aside for this week
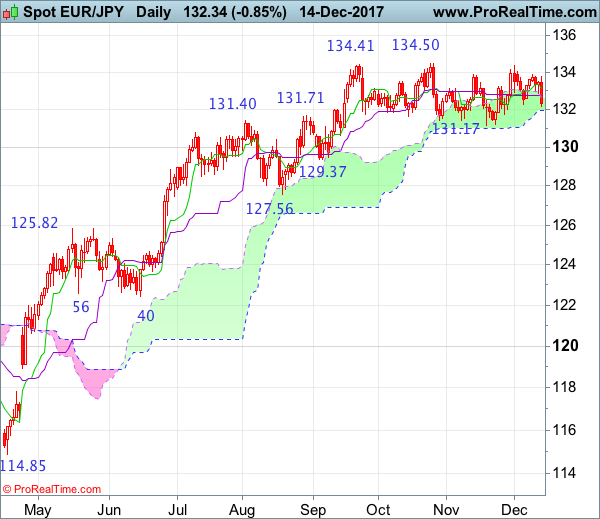
On the weekly chart, as the single currency faltered below last week’s high at 134.05 and has slipped this week, a black candlestick looks set to be formed, suggesting further consolidation below resistance at 134.38 would be seen and test of previous support at 131.72 is likely, however, only break of indicated strong support at 131.17 would shift risk to downside and suggest a temporary top has been formed earlier at 134.50, bring retracement of recent rise to support at 130.90-00, then 130.20-25 but reckon downside would be limited to 129.37 support and previous support at 127.56 should remain intact.
On the upside, expect recovery to be limited to 133.00-05 and bring another decline. above 133.89 would bring another test of 134.38 but only break of indicated recent high at 134.50 would confirm recent upmove from 109.49 (2016 low) has resumed and extend gain to 135.00, then 136.00-10 but reckon upside would be limited and 136.95-00 should hold, price should fatter below 138.45-50 (1.618 times extension of 109.49-124.10 measuring from 114.85), bring retreat later.
USDJPY Intraday Bearish Below 112.30 Level
The U.S dollar continues to drift lower against the Japanese yen, hitting 112.09 during the early Asian trading. Renewed selling occurred in the pair, after two Republican senators were reported to have sought changes to the proposed legislation to overhaul the US tax code. The USDJPY pair currently trades around the 112.20 levels, as stocks and perceived riskier assets classes remain pressured. Traders now look to manufacturing and industrial production figures from the U.S economy, and any updates coming from U.S Congress on the tax reform bill.
The USDJPY pair remains strongly bearish while trading below the 112.20 technical level, sellers may now push price-action towards the 111.87 and 111.38 support levels.
Should price-action on the USDJPY pair hold above the 112.20 technical level, buyers may push price-action towards the 112.70 and 113.10 resistance levels.