Sample Category Title
Trade Idea: EUR/GBP – Buy at 0.8755
EUR/GBP - 0.8806
Original strategy :
Buy at 0.8755, Target: 0.8855, Stop: 0.8720
Position : -
Target : -
Stop : -
New strategy :
Buy at 0.8755, Target: 0.8855, Stop: 0.8720
Position : -
Target : -
Stop : -
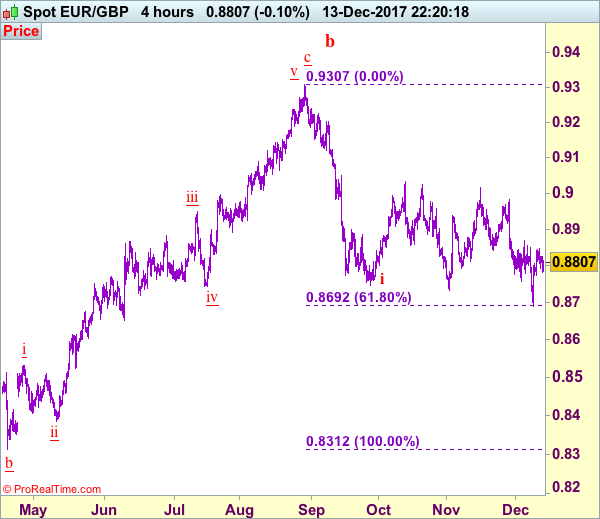
Although the single currency retreated from 0.8847, early strong rebound from last week’s low of 0.8690 suggests low has possibly been formed there and consolidation with mild upside bias is seen for a test of resistance at 0.8868, however, break above there is needed to add credence to our view that low has been made and suggest the decline from 0.9015 has ended, bring further gain to 0.8890-00 later.
In view of this, we are looking to turn long on dips as 0.8755-60 should limit downside and bring another rebound. Below 0.8720-25 would risk retest of 0.8690 but only break there would revive bearishness and signal the fall from 0.9015 is still in progress and may extend weakness to 0.8660-65 and then 0.8640-45.
Our preferred count is that, after forming a major top at 0.9805 (wave V), (A)-(B)-(C) correction is unfolding with (A) leg ended at 0.8400 (A: 0.8637, B: 0.9491 and 5-waver C ended at 0.8400. Wave (B) has ended at 0.9413 and impulsive wave (C) has either ended at 0.8067 or may extend one more fall to 0.8000 before prospect of another rally. Current breach of indicated resistance at 0.9043 confirms our view that the (C) leg has ended and bring stronger rebound towards 0.9150/54, then towards 0.9240/50.
U.S. November CPI Rises though Core Inflation Moderates
Highlights:
- Headline CPI rose an expected 0.4% sending the annual rate up to 2.2% from 2.0% in October.
- A 7.3% monthly jump in gasoline prices provided a lion's share of the increase.
- Excluding food & energy prices, 'core' CPI rose 0.1% in the month and 1.7% over the year.
Our Take:
The year-over-year increase in core inflation dropped back down to 1.7% in October. After holding steady at 1.7% four five consecutive months, the rate moved up to 1.8% in October. The increase continues to be constrained by a large drop in telecommunications prices earlier this year and in apparel prices in November. The absence of inflation pressures has been a puzzle with respect to the U.S. economy. Indications, such as a low unemployment rate, are indicative of the economy operating close to capacity. Operating at capacity is usually associated with inflation pressures starting to build with businesses having increased difficulty responding to rising demand because of resource constraints and thus temper demand by raising prices. Today's report provides some confirmation of retailers responding in this expected manner with services prices up 2.6% over the past year. However, it is being offset by lower goods prices. Our expectation is that the growing capacity constraints will increasingly see the price performance of the former dominate with core inflation resuming an upward trend.
ETHUSD is Strengthening its Bullish Momentum
ETHUSD is has been edging sharply higher since October and added 98% to its performance. Ether launched in 2015 and surged more than 8,000% since the start of 2017. During this month, the price recorded another all-time high at $687.41 but lost some momentum and is currently developing near the $646.10 price level, and especially over the last three trading days the price is accelerating aggressively.
Using Fibonacci extension level, the next handle to have in mind is the 261.8% level, $725.72 resistance, of the last big retracement move to the downside with high at $514.07 and low at $383.70. On Tuesday, the pair penetrated to the upside the critical 161.8% Fibonacci level and continues the bullish movement.
From the technical point of view, on the short-term timeframe, the three simple moving averages (50, 100 and 200) are sloping to the upside and they are following the price action. The MACD oscillator is rising above the trigger and zero lines, as well as the Relative Strength Index (RSI) lies in the extremely overbought area. Technical indicators are signaling for further bullish tendency.
Having a look at the medium-term chart, the oscillators are endorsing the view for an upwards move as the MACD and the RSI are strengthening their momentum in the positive areas.
BTCUSD Has More Room to Rise; Hit Another All-Time High in December
BTCUSD is extending its gains with an aggressive bullish move and is creating the third straight green month. The price has soared more than 173% since October and every single month is printing a new all-time high.
On the medium-term timeframe, the bitcoin is currently trading lower and the technical indicators seem to be in confusion. The MACD oscillator is accelerating, confirming the recent sharp buying interest on price. However, the RSI indicator is slightly dropping in the overbought area, approaching the 70 level.
Going to the 4-hour chart, the price is moving slightly to the upside heading towards the aforementioned all-time high at $17,496, snapping the four losing sessions. The technical indicators are still moving in positive areas. The MACD oscillator plunged below the trigger line with strong momentum, whilst the RSI indicator holds under the 70 level and is pointing to the upside. In addition, the pair successfully surpassed the 50-SMA on the 1-hour chart, indicating a short-term upward tendency.
Moreover, on a long-term basis, regarding the price outlook, the figure suggests that investors will continue to push bitcoin to the upside, which shows that the $20,000 will be the next stop.
Dollar Steadies ahead of Fed Rate Decision; European Stocks Mostly Down
Here are the latest developments in global markets:
FOREX: The dollar remained flat near intraday lows, last trading around 113.30 versus the yen (-0.21%), as the Democrats Senate win in Alabama weakened Republicans' majority, threatening the Trump administration's future economic agenda. The pound climbed higher towards 1.3350 (+0.23%) after the UK employment data showed that in the three months to October, earnings excluding bonuses surprisingly inched up on a yearly basis, while the unemployment rate stood flat at a four-decade low. The euro was flat at 1.1733 against the dollar but weakened to 0.8788 versus the pound (-0.32%).
STOCKS: European indices were mostly on the back foot due to losses in the utilities and healthcare sectors, while investors were also cautious on the Fed policy meeting. The benchmark STOXX 600 inched down by 0.12% at 1200GMT, the German DAX 30 retreated by 0.18% and the French CAC 40 declined by 0.20%. The British FTSE 100 was steady.
COMMODITIES: Oil prices continued to gain after Tuesday's API weekly report showed a bigger drop than anticipated in US crude inventories, while the shutdown of a major British crude pipeline provided further support. WTI crude jumped by 0.70% to $57.54 per barrel and Brent surged by 0.81% to $63.85. Gold fell by 0.25% to $1,240.30 per ounce.
Day ahead: Fed to deliver long-awaited rate hike; US CPI gathers attention
The dollar will be in the spotlight during the day as FOMC members conclude their last two-day policy meeting for 2017, while markets anticipate the US CPI figures to be released later in the European session.
The rate decision will be announced at 1900GMT, with forecasts indicating that interest rates will rise by 0.25 percentage points to 1.25-1.50%. As this is already priced in by the markets, the monetary policy statement (1900GMT) and Fed chair Janet Yellen's last press conference (1930GMT) following the rate announcement will be of greater importance to investors. Particularly, investors will seek any clues on the path of the future stance on monetary policy and will be paying close attention to the central bank's economic projections.
At 1330GMT, the US Bureau of Labour Statistics will release CPI figures for the month of November. According to forecasts, the index will likely gain 0.2 percentage points, growing by 2.2% y/y, while the core equivalent is anticipated to remain flat at 1.8% y/y. Even if the core measure is closer to the Fed's inflation target of 2.0%, policymakers prefer to monitor the core PCE index which is still well below the Fed's target for inflation.
In other upcoming events today, the US President will be talking about tax reforms at 2000GMT.
In oil markets, the EIA weekly report due at 1530 GMT is expected to indicate a smaller decrease in US crude oil stocks for the week ending December 8 relative to the preceding week – the decrease is estimated at 3.759 million barrels versus the previous week's decline by 5.610m barrels (the biggest fall in two months). Gasoline and distillate inventories are expected to rise at a softer pace by 2.457 million and 0.902 million barrels respectively.
Markets will be also watching developments in the British Parliament today, where May's government will try to repeal a legislation regarding Britain's ties with the EU and make efforts to incorporate EU laws into domestic ones so as to ensure legal continuity after the official divorce day on March 29, 2019.
GBPUSD Intraday Bullish Above 1.3340 Level
The British pound has moved higher against the U.S dollar after UK employment data continued to show steadily rising wage inflation in the United Kingdom economy. The GBPUSD pair has moved above the key 1.3340 level, and found resistance at the 1.3370 level thus far. Price-action currently trades around the 1.3360 level, with the 1.3380-1.3400 region likely to be the next major upside hurdle for buyers. The pair will also likely find its next directional move from the release of monthly U.S Consumer Price Index inflation figures.
The GBPUSD pair has now turned intraday bullish after clearing the 1.3340 level, further upside towards the 1.3400 and 1.3470 levels now appears possible.
Should GBPUSD sellers push price-action below the 1.3340 technical level, further selling back towards the 1.3303 and 1.3268 support levels remains possible.
USDJPY Still Holding Firm Above 113.10 Level
The U.S dollar continues to hold firm against the Japanese yen, despite a brief pullback towards the key 113.10 support level on Wednesday. Price-action currently trades around the 113.34 level on the USDJPY pair, as the U.S dollar recovers overnight losses. The two key risk events for the pair headed into the U.S trading session are CPI inflation figures from the U.S economy, and the FOMC policy decision. The U.S November CPI inflation release has the ability to generate high volatility in the USDJPY this afternoon, a lower number than expected would certainly pressure the U.S dollar index.
The USDJPY pair remains strongly bullish while trading above the 113.10 technical level, buyers will look to test towards the 113.75 and 114.06 levels. Extended daily resistance is found at 114.72 level.
Should the USDJPY pair move below the 113.09 technical level, intraday sellers will target towards 112.71 support level. Extended daily support is found at the 112.35 level.
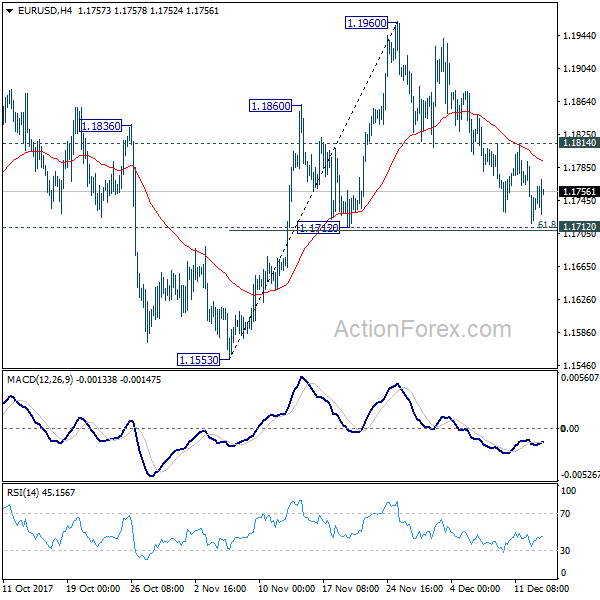
EUR/USD Mid-Day Outlook
Daily Pivots: (S1) 1.1708; (P) 1.1750 (R1) 1.1783; More....
Intraday bias in EUR/USD remains neutral with focus on 1.1712 cluster support (61.8% retracement of 1.1553 to 1.1960 at 1.1708). On the downside, decisive break of 1.1708/12 will indicate that rebound from 1.1553 has completed at 1.1960. In that case, deeper fall would be seen to 1.1553 and possibly below to extend the decline from 1.2091. On the upside, break of 1.1814 minor resistance will retain near term bullishness. And in that case, intraday bias will be turned back to the upside for 1.1960. Break will target 1.2091 high.
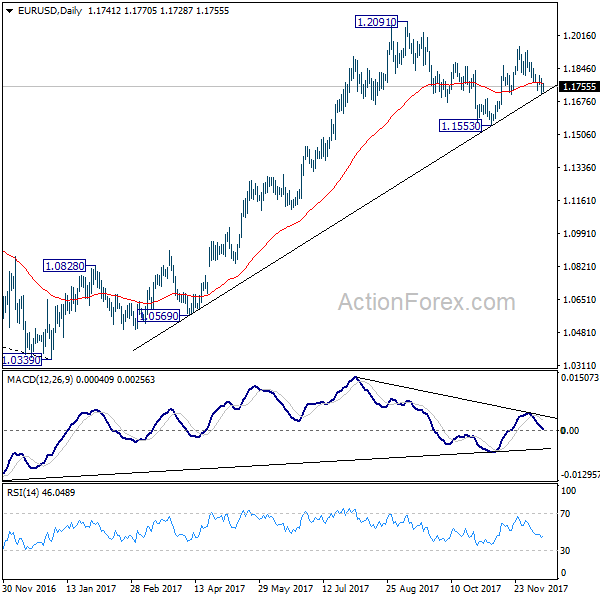
In the bigger picture, rise from 1.0339 medium term bottom is seen as a corrective move for the moment. Therefore, in case of another rally, we'd be expect 38.2% retracement of 1.6039 (2008 high) to 1.0339 (2017 low) at 1.2516 to limit upside and bring reversal. Meanwhile, sustained trading below 55 week EMA (now at 1.1423) will suggest that such medium term rebound is completed and could then bring retest of 1.0339 low.
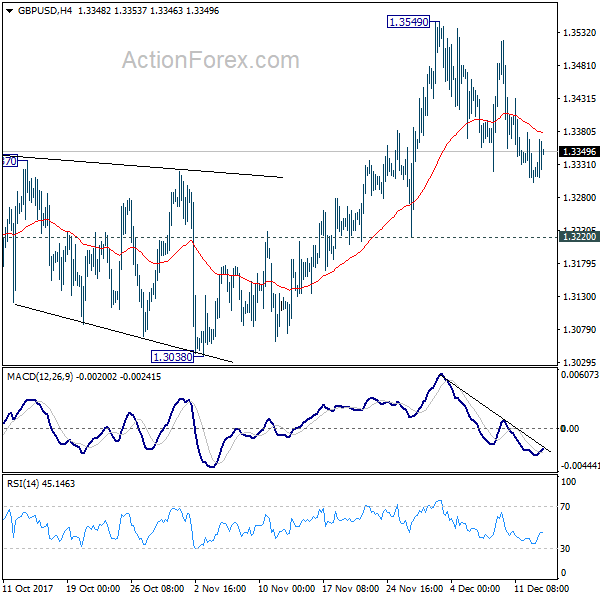
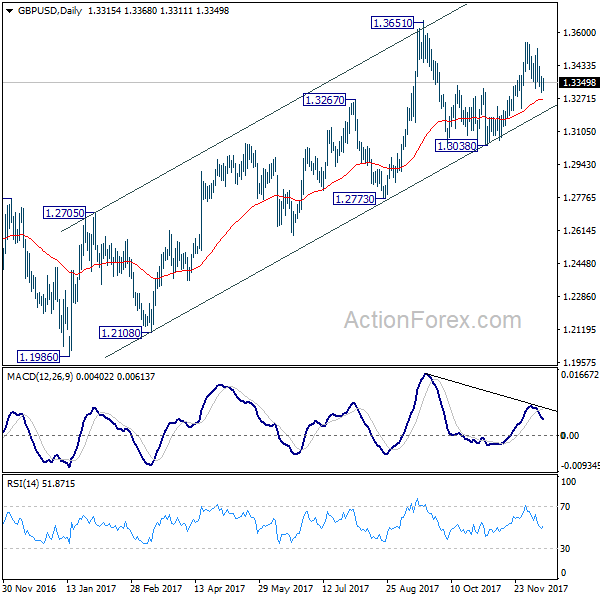
GBP/USD Mid-Day Outlook
Daily Pivots: (S1) 1.3286; (P) 1.3332; (R1) 1.3364; More....
No change in GBP/USD's outlook has pull back from 1.3549 is extending. intraday bias remains neutral at this point. As long as 1.3220 support holds, we'd continue to favor another rise. On the upside, break of 1.3549 will target 1.3651 high next. However, firm break of 1.3220 will turn near term outlook bearish for 1.3038 key support level.
In the bigger picture, while the medium term rebound from 1.1946 low was strong, it's limited below 1.3835 key support turned resistance. As long as 1.3835 holds, we'd view such rebound as a correction. That is, we'd expect another leg in the long term down trend through 1.1946 low. However, sustained break of 1.3835 should at least send GBP/USD to 38.2% retracement of 2.1161 (2007 high) to 1.1946 (2016 low) at 1.5466.
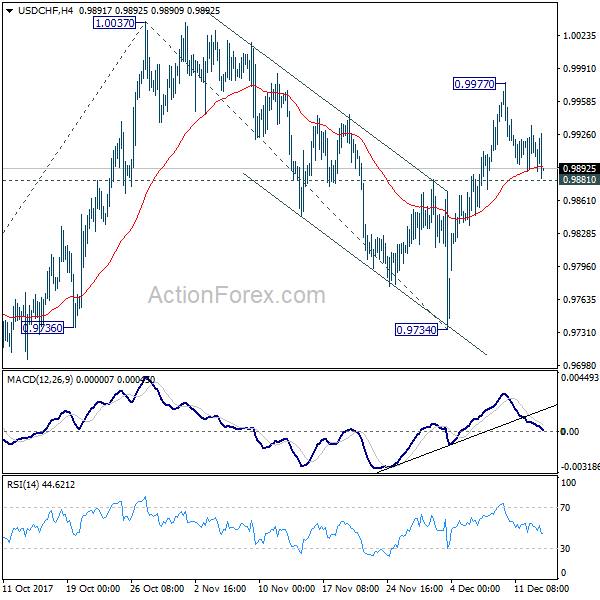
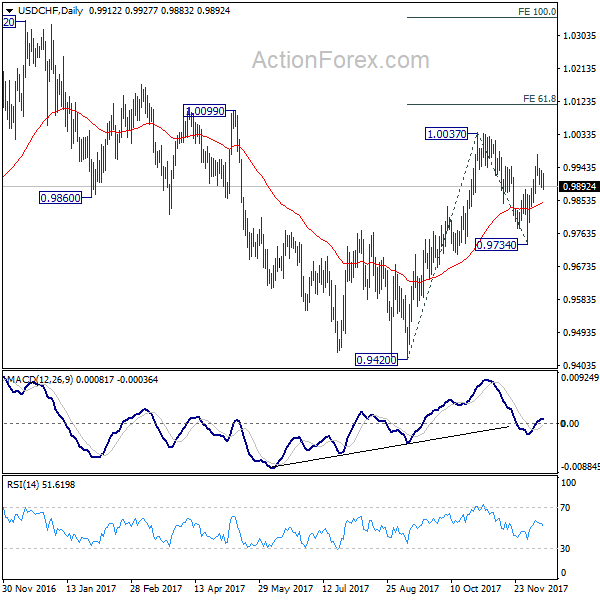
USD/CHF Mid-Day Outlook
Daily Pivots: (S1) 0.9891; (P) 0.9913; (R1) 0.9936; More....
At this point, USD/CHF is held in range of 0.9881/9977 and intraday bias stays neutral first. As long as 0.9881 support holds, we're favoring the bullish case. That is correction from 1.0037 has completed at 0.9734 already. Break of 0.9977 will target 1.0037 high first. Break there will resume rise from 0.9420 to 61.8% projection of 0.9420 to 0.9734 from 1.0047 at 1.0115 next. Nevertheless, firm break of 0.9881 support will dampen this immediate bullish case and turn bias to the downside for 0.9734 instead.
In the bigger picture, range trading continues between 0.9420/1.0342. At this point, 0.9420 appears to be a strong support level. Therefore, in case of decline attempt, we don't expect a firm break of this level. Nonetheless, strong break of 1.0342 is also needed to confirm upside momentum. Otherwise, medium term outlook will stay neutral.