Sample Category Title
EURUSD – Close in the Cloud to Generate Bearish Signal
The Euro probed into daily cloud in extension of easing from Asian high at 1.1876. Violation of significant support at 1.1833, provided by cloud top, requires close within the cloud for bearish signal. Bearish extension would expose strong support zone at 1.1805 (Fibo 38.2% of 1.1553/1.1961 ascend) and 1.1794 (converged 20/100SMA, creating bull-cross). Hesitation to clearly break into cloud could result in extended consolidation between cloud top and broken 10SMA (1.1868). Only lift and close above 10SMa would sideline immediate downside risk and signal formation of higher base at 1.1810 zone (30 Nov/5 Dec lows).
Res: 1.1868; 1.1900; 1.1928; 1.1940
Sup: 1.1812; 1.1805; 1.1794; 1.1757
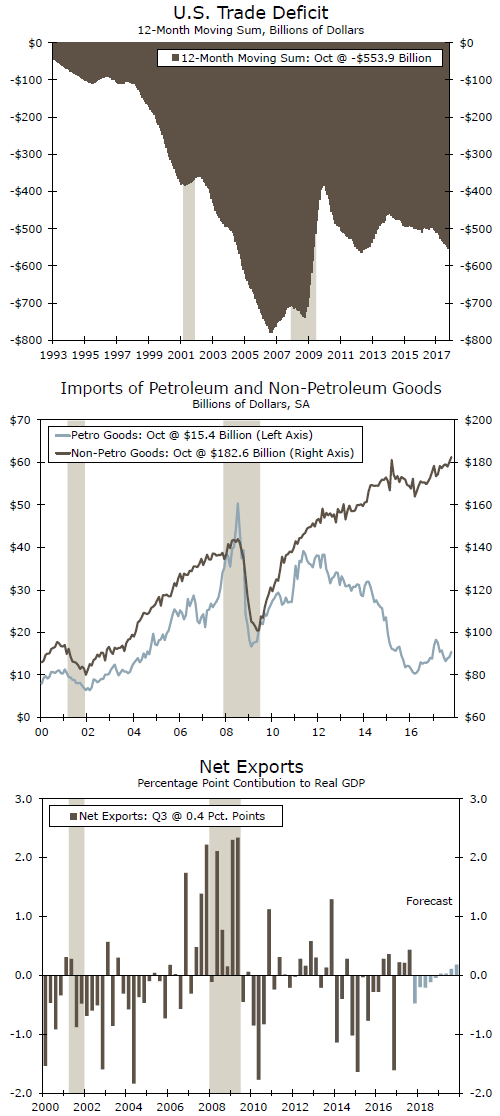
The Hunt for Red October: Widening in the Trade Deficit
The trade deficit moved deeper into the red in October as imports surged 1.6 percent and exports were essentially flat. Though storm effects linger, we anticipate trade going from a help to a hindrance for GDP.
Riders on the Storm
The data in today's trade report for the month of October are still being influenced by Hurricanes Harvey, Irma and Maria and on that basis need to be taken with a grain of salt. A supplementary note explained that the Bureau of Economic Analysis and the Census Bureau (which together publish the trade figures) cannot isolate the effects of the storms and that in coming months the revised data will play an important role in providing additional inputs for a more complete read on the storms' impacts.
That may take the sting out of the fact that exports stalled in the month. In fact, goods exports actually fell just over $300 million and services exports increased $301 million for an overall increase of just $21 million - a drop in the bucket for the overall export figure of nearly $200 billion.
In terms of the underlying details on the export side, a $2.6 billion increase in exports of industrial supplies and materials nearly offset declines in exports of civilian aircraft ($1.1 billion) as well as a slip in exports of soybeans ($1.4 billion).
Imports posted the largest monthly gain since January increasing $3.5 billion on the goods side and a scant $300 million on the service side. Goods imports in the United States typically outweigh service imports by a ratio of more than four to one. Almost half of the increase on the goods side came from a $1.5 billion increase in crude oil imports. Other import categories that were up in the month included industrial supplies, automobiles and consumer goods.
The surging imports, particularly in categories like consumer goods and autos, are consistent with our expectation that holiday sales will be strong this year and may reflect storekeepers and online vendors taking on stock in expectation of increased spending amid the highest levels of consumer confidence in more than 15 years.
Down Where the Trade Winds Play, Down Where You Lose a Day
Trade has added to growth in each of the first three quarters of 2017, but today's report for October is consistent with our forecast that the fourth quarter will mark a turning point and that trade will weigh on GDP during the period.
Our baseline expectation is that the year ahead will be characterized by steady growth in domestic demand which, if realized, would be consistent with steady import growth. The global economic backdrop has improved throughout this year but is not expected to accelerate meaningfully in the year ahead. On that basis, we would expect to see import growth out-pacing gains on the export side of the ledger which is why we are forecasting that trade will be a modest headwind to growth throughout next year.
Canada’s Trade Deficit Shrank to $1.5 Billion in October
Highlights:
- Canada's nominal merchandise trade deficit narrowed to $1.5 billion in October from $3.4 billion in September.
- Export volumes rose 1.1%, entirely reflecting an increase in non-energy exports. Energy export volumes declined 0.5%.
- Import volumes declined by a pronounced 3.2% but are still up 3% from a year ago.
Our Take:
The October deficit was down sharply from $3.4 billion in September - and the average $3.0 billion monthly shortfall in Q3. Export volumes rose 1.1% after falling for four straight months. Shipments of industrial chemicals surged 13.2% higher, as US petroleum refineries boosted demand. Gains were also relatively broadly-based outside of that component, though. Non-energy exports increased about 1 1/2% in October in volume terms but were still down by about half a percent from a year ago.
Imports were less encouraging, falling 1.6% in nominal terms and 3.2% in volumes. The decline is, of course, a positive for the net trade balance but could, if sustained, also be a sign of slower domestic demand growth. A pullback in machinery and equipment imports - a key indicator of business investment - in particular took some of the shine off the improvement in the trade deficit in October. Nonetheless, the data is notoriously volatile so one monthly decline doesn't make a trend. Imports are still up 3.0% from a year ago and industrial machinery imports are up a stronger 13.5% year-over-year. On balance, there is more to like than dislike in today's report. We don't expect that the Canadian economy will return to the outsized 3 1/2% pace of growth from mid-2016 to mid-2017 any time soon but data to-date is still consistent with underlying growth at a modestly above-potential 2% rate - similar to the 1.7% increase in Q3/17 GDP.
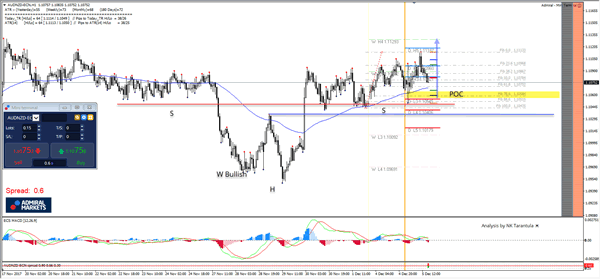
AUDNZD Double Bullish Confluence
The AUD/NZD shows Double Bullish Confluence on intraday time frame. We can see the W pattern that pushed the price up while at the same time it has formed the bullish SHS pattern (inverted head and shoulders). If the price drops to the POC zone 1.1050-60 (78.6, EMA89, D L3, Soulder bottom) we could see a spike towards 1.1130 W H4 target. The ATR (14) has already been filled so we might see another spike up during late NY or Tokyo session.
- H3 - Weekly Camarilla Pivot (Weekly Interim Resistance)
- W H4 - Weekly Camarilla Pivot (Strong Weekly Resistance)
- D H4 - Daily Camarilla Pivot (Very Strong Daily Resistance)
- D L3 - Daily Camarilla Pivot (Daily Support)
- D L4 - Daily H4 Camarilla (Very Strong Daily Support)
- PPR - Progressive Polynomial Channel
- POC - Point Of Confluence (The zone where we expect price to react aka entry zone)
Canada’s Trade Deficit Narrowed Significantly in October
Canada's trade deficit narrowed to $1.5B in October, from $3.4B in September. Exports rose 2.7% while imports slid 1.6%. In real terms, exports were up 1.2%, while imports fell by a hefty 3.9%.
The strength in exports was widespread, with all but two industries - aircraft and other transportation equipment (-7.7%) and metal ores and non-metallic minerals (-5%) - recording gains. Leading the way was chemical, plastic and rubber products (+12%), followed by farm, fishing and intermediate food products (+7.7%).
The decline in imports was also fairly broad based, with metal ores and non-metallic minerals (-20%) and motor vehicles and parts (-8%) recording the largest declines. The latter was driven by reduced parts imports in light of the strike at an auto assembly plant. Aircraft and other transportation equipment (+16%) provided some offset.
Canada's trade surplus with the U.S. widened to $3.5B during the month (previously $2.0B), as exports rose 4% while imports were down 0.6%. Canada's trade deficit with the rest of the world narrowed to $5.0B in October (previously $5.4B), as the decline in imports (-3.3%) outpaced the decline in exports (-1.4%).
Key Implications
Following four consecutive months of declines, export volumes bounced back, fully erasing the drop recorded in August and September. This provides a stronger handoff for the fourth quarter, which should see a notable step up in fourth quarter growth relative to Q3's 1.7% pace.
Looking ahead, exports should manage to gain some traction, supported by a healthy U.S. economy and a Canadian dollar hovering around the 80 US cent mark. Moreover, the strike at an auto assembly plant that weighed on exports through the first half of the month should lead to higher motor vehicle exports going forward. Of course the NAFTA renegotiations remain a wildcard, but given the slow progress to date, any changes are unlikely to take effect within the next year.
This report, combined with last week's stellar employment report, will be looked favorably upon by the data dependent Bank of Canada. With most other areas of the economy evolving as expected by the Bank, higher interest rates are not far off.
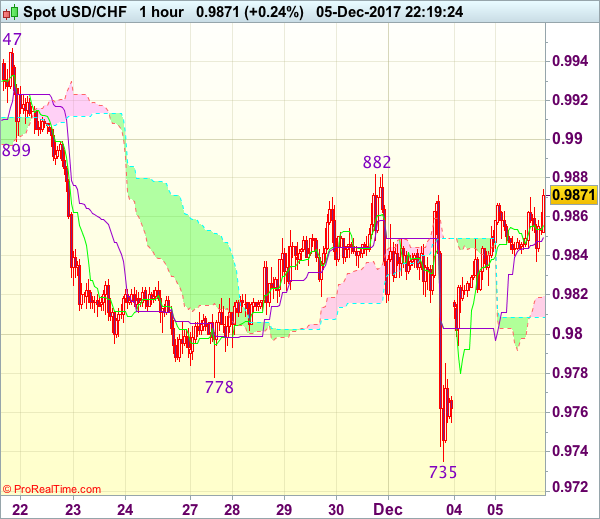
Trade Idea Wrap-up: USD/CHF – Buy at 0.9795
USD/CHF - 0.9861
Most recent candlesticks pattern : N/A
Trend : Near term down
Tenkan-Sen level : 0.9856
Kijun-Sen level : 0.9850
Ichimoku cloud top : 0.9819
Ichimoku cloud bottom : 0.9809
Original strategy :
Buy at 0.9795, Target: 0.9895, Stop: 0.9760
Position : -
Target : -
Stop : -
New strategy :
Buy at 0.9795, Target: 0.9895, Stop: 0.9760
Position : -
Target : -
Stop : -
As the greenback has maintained a firm undertone after staging a strong rebound from 0.9735 (last Friday’s low), adding credence to our view that a temporary low has been formed there and consolidation with upside bias remains for gain to last week’s high at 0.9882, however, a sustained breach above this level is needed to confirm this view and bring at least a retracement of recent decline to 0.9900 and later towards resistance at 0.9947.
In view of this, we are looking to buy dollar on dips as 0.9775-85 should limit downside and bring another rebound. Below 0.9750 would risk a retest of said last week’s low at 0.9735 but only break there would signal the decline from 1.1038 top has resumed for weakness to 0.9705 support.
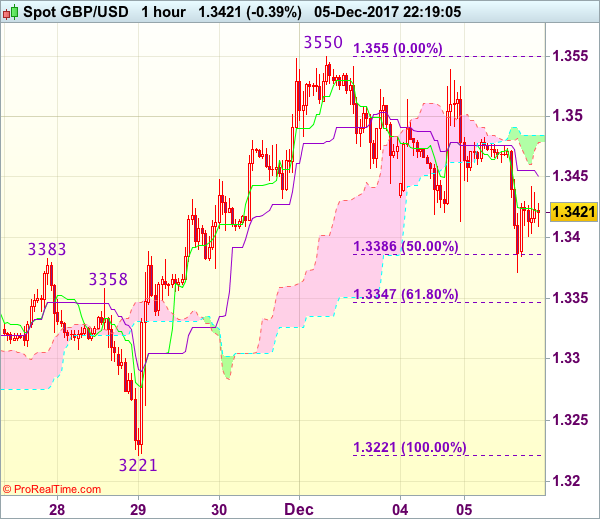
Trade Idea Wrap-up: GBP/USD – Hold short entered at 1.3440
GBP/USD - 1.3421
Most recent candlesticks pattern : N/A
Trend : Near term up
Tenkan-Sen level : 1.3422
Kijun-Sen level : 1.3451
Ichimoku cloud top : 1.3485
Ichimoku cloud bottom : 1.3479
Original strategy :
Sold at 1.3440, Target: 1.3340, Stop: 1.3475
Position : - Short at 1.3440
Target : - 1.3340
Stop : - 1.3475
New strategy :
Hold short entered at 1.3440, Target: 1.3340, Stop: 1.3475
Position : - Short at 1.3440
Target : - 1.3340
Stop : - 1.3475
Cable’s anticipated selloff has reinforced our view that top has been formed at 1.3550 and consolidation with downside bias remains for the fall from 1.3550 to bring retracement of recent rise, hence further weakness to 1.3340-50 (61.8% Fibonacci retracement of 1.3221-1.3550) would be seen, however, near term oversold condition should prevent sharp fall below 1.3300 and reckon 1.3260-65 would hold, bring rebound later.
In view of this, we are holding on to our short position entered at 1.3440. Above the Kijun-Sen (now at 1.3451) would defer and risk test of resistance at 1.3483 but only break there would signal an intra-day low is formed instead, bring another bounce to 1.3530-35 first.
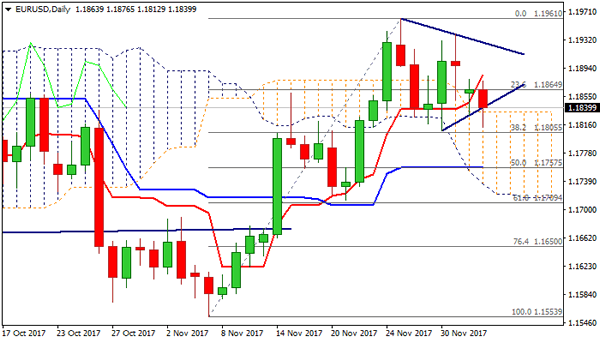
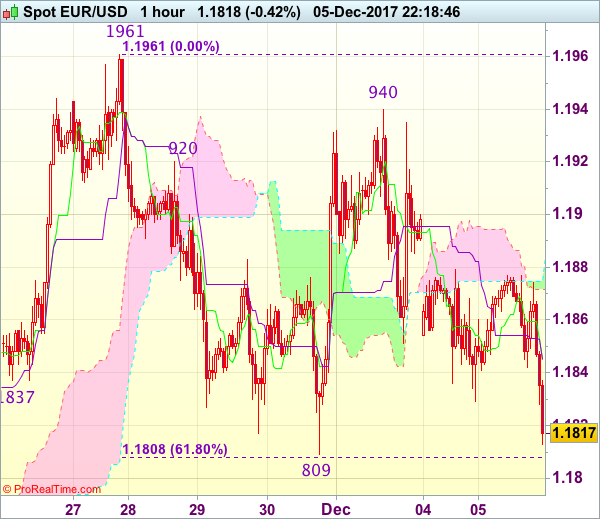
Trade Idea Wrap-up: EUR/USD – Sell at 1.1915
EUR/USD - 1.1825
Most recent candlesticks pattern : N/A
Trend : Near term down
Tenkan-Sen level : 1.1845
Kijun-Sen level : 1.1845
Ichimoku cloud top : 1.1875
Ichimoku cloud bottom : 1.1872
Original strategy :
Sell at 1.1915, Target: 1.1815, Stop: 1.1950
Position : -
Target : -
Stop : -
New strategy :
Sell at 1.1915, Target: 1.1815, Stop: 1.1950
Position : -
Target : -
Stop : -
As the single currency recovered after holding above support at 1.1809, retaining our view that further consolidation below resistance at 1.1961 (last week’s high) would be seen and mild downside bias remains for weakness towards support at 1.1808-09 (61.8% Fibonacci retracement of 1.1713-1.1961 and previous support), however, break there is needed to retain bearishness and extend weakness to 1.1770 and possibly to support at 1.1736 but price should stay above previous key support at 1.1713.
In view of this, we are looking to sell euro on recovery as 1.1910-20 should limit upside and bring another decline. Above said Friday’s high at 1.1940 would revive bullishness, bring retest of 1.1961, break there would confirm early upmove has resumed for headway to 1.1990-00 which is likely to hold from here.
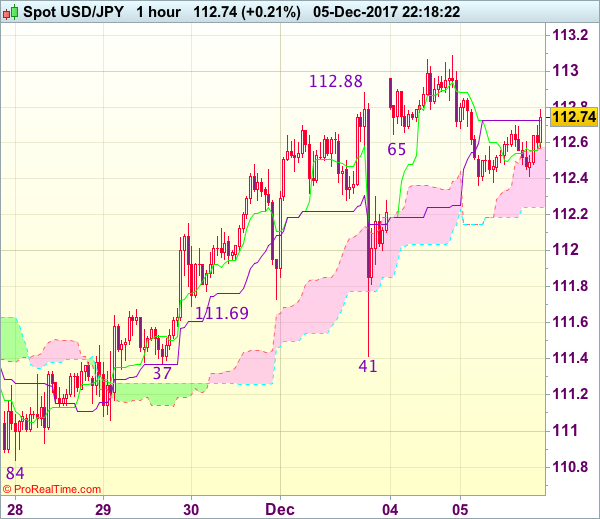
Trade Idea Wrap-up: USD/JPY – Buy at 112.10
USD/JPY - 112.75
Most recent candlesticks pattern : N/A
Trend : Near term up
Tenkan-Sen level : 112.60
Kijun-Sen level : 112.73
Ichimoku cloud top : 112.57
Ichimoku cloud bottom : 112.24
Original strategy :
Buy at 112.10, Target: 113.30, Stop: 111.75
Position : -
Target : -
Stop : -
New strategy :
Buy at 112.10, Target: 113.30, Stop: 111.75
Position : -
Target : -
Stop : -
As the greenback retreated after rising to 113.09 yesterday, suggesting consolidation below this level would be seen and pullback to 112.10-20 cannot be ruled out, however, reckon downside would be limited to 111.80-85 and bring another rise later, above said resistance at 113.09 would extend recent rise to resistance at 113.33 but loss of upward momentum should prevent sharp move beyond 113.60-70.
In view of this, we are still looking to buy dollar on pullback as 112.00-10 should limit downside and bring another rise. Below 111.80 would defer and risk weakness to 111.60 but only break of said support at 111.37-41 would abort and signal top is formed instead.
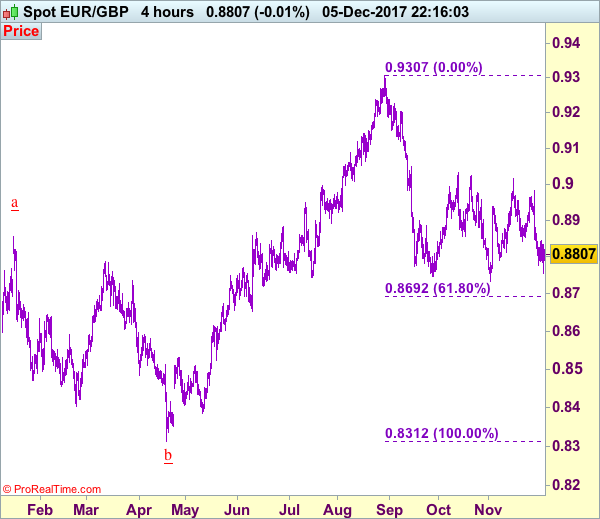
Trade Idea: EUR/GBP – Sell at 0.8885
EUR/GBP - 0.8810
Original strategy :
Sell at 0.8885, Target: 0.8750, Stop: 0.8920
Position : -
Target : -
Stop : -
New strategy :
Sell at 0.8885, Target: 0.8750, Stop: 0.8920
Position : -
Target : -
Stop : -
Although the single currency recovered after anticipated fall to 0.8756 and consolidation above this level would be seen, reckon upside would be limited to 0.8880-85 and bring another decline, below said support at 0.8756 would extend the fall from 0.9015 towards previous support at 0.9733 which is likely to hold on first testing.
In view of this, we are looking to reinstate short on recovery as 0.8880-85 should limit upside. Above previous support at 0.8915 (now resistance) would defer and prolong choppy trading, risk rebound to 0.8935-40, however, still reckon said resistance at 0.8982 would cap upside and bring another retreat later. Only above indicated resistance at 0.9015 would risk test of previous resistance at 0.9033 but only a breach of this level would signal an upside break of recent established broad range has occurred, then subsequent rise to 0.9070-75 would follow.
Our preferred count is that, after forming a major top at 0.9805 (wave V), (A)-(B)-(C) correction is unfolding with (A) leg ended at 0.8400 (A: 0.8637, B: 0.9491 and 5-waver C ended at 0.8400. Wave (B) has ended at 0.9413 and impulsive wave (C) has either ended at 0.8067 or may extend one more fall to 0.8000 before prospect of another rally. Current breach of indicated resistance at 0.9043 confirms our view that the (C) leg has ended and bring stronger rebound towards 0.9150/54, then towards 0.9240/50.