Sample Category Title
GBPUSD – Penetration of Daily Cloud Signals Extended Correction
Cable remains under pressure in the American session and cracked daily cloud top which marks solid support at 1.3276.
Weakening near-term studies favor firm break through cloud top (cloud is spanned between 1.3276 and 1.3214) and test of next significant support at 1.3260 (converged 10/55SMA's). Daily techs show further room for extended pullback with break below 1.3260 to risk test of cloud base (1.3214) reinforced by daily Kijun-sen).
The latter is required to contain extended correction and keep in play fresh upside attempts as 1.3415 Fibo barrier still acts as valid target.
Res: 1.3276; 1.3300; 1.3357; 1.3382
Sup: 1.3260; 1.3214; 1.3203; 1.3185
USD Decline Halts, For Now
- European equities had a constructive session today, but still stick to a narrow sideways range following a substantial sell-off in the first half of November. US equities open with small gains.
- Loans to businesses across the eurozone increased at their fastest rate since the financial crisis in October, underscoring the recovery in demand across the bloc as the ECB prepares to scale back its stimulus programme. French consumers brightened their outlook in November after four months of declining confidence.
- Raising interest rates before the end of the decade could threaten the long-sought after economic recovery in the eurozone, the OECD has warned. It does not expect the European Central Bank to begin raising rates until 2020 given below-target inflation and continuing slack in local labour markets.
- Ireland averted an election that could have derailed crucial Brexit talks with the U.K., as Deputy Prime Minister Fitzgerald agreed to resign and end a five-day political stand-off
- All OPEC members support extending their oil production cuts until the end of 2018, although Russia hasn't yet committed to the proposal before Thursday's meeting in Vienna, said people familiar with the matter. Brent oil trades at $63.45/barrel, a daily loss of 40 cents.
- The prospect of Brexit will continue to weigh on Britain's economic performance over the next two years, while creating risks and opportunities for other European countries, the OECD said on Tuesday.
Rates
Another sideways trading session
The Bund traded in a tight 20 ticks range between 163.10 and 163.30, now quoted in the middle of that range. The short end slightly underperformed, but the differences are marginal. US Treasuries traded virtual unchanged until a small move higher after a much higher than expected trade deficit was reported. It may weigh somewhat on Q4 GDP growth. However, even this move was negligible even in an intra-day perspective. Other markets gave little impetus. The dollar was fractionally higher, oil lower and European equities moderately higher. None had noticeable impact on core bonds. European data remained encouraging, but were also unable to affect trading. At the time of closing our report, Fed chairman nominee Powell will appear for a hearing before the Senate banking Committee and the consumer confidence (Conference board) will be released. A 7-yr T-Note auction takes place later this evening. Surprises are possible but unlikely.
At the time of writing, the German yield curve shows little moves with yield changes ranging between +0.5 bp (2-yr) and -0.2 bp (10-yr). The US yield curve trades within 1 bp lower across the curve. On intra-EMU bond markets, yield spreads are again virtually unchanged. Irish bonds didn't react to the resolution of the political crisis (which didn't weigh on Irish bonds in the first place).
Currencies
USD decline halts, for now.
EUR/USD and USD/JPY trading was confined to very tight ranges today. Eco data were few and unable to give trading firm direction. The dollar stayed away from yesterday's ST correction low against the euro and the yen, but it's too early to assume that a bottoming out process is in place.
Overnight, the correction on Asian equity markets that started last week slowed. Chinese equities even succeeded a late session rebound and finished the session in positive territory. USD/JPY traded stable in the low 111 area. EUR/USD hovered in the 1.19 area.
European equities initially didn't know which way to go, but finally joined the positive trend from China. However, the developments on the equity markets again failed to give any clear guidance for trading in bonds and FX markets. EMU money supply and lending data were constructive, but broadly as expected. USD/JPY and EUR/USD held extremely tight ranges close to the starting levels in Europe.
The US trade deficit was substantially bigger than expected ($ 68.3 b vs $64.9 b expected) both due to lower exports and higher imports. The higher trade deficit might reduce the Q4 US growth. Evens so, the report had no noticeable impact on the dollar. FX traders are apparently mainly focused on the US tax debate and on more important figures scheduled for release later this week. After the closure of our report, nominee Fed chair Powell will be questioned before the US Senate. US consumer confidence might also still affect the dollar. EUR/USD trades currently in the 1.1890 area. USD/JPY trades near 111.25.
Sterling losing ground in technical trade
There was again no dominant story to guide sterling trading today. The BoE in its financial stability review indicated that UK banks will be able to cope with the consequences of a disorderly Brexit. Still banks and the UK economy could suffer substantial costs in such a scenario. We didn't seen any high profile new insights in today's BoE assessment. In Ireland, the deputy Prime minister resigned, reducing chances for snap elections. This should also avoid additional problems as the EU and the UK seek for a solution for the UK/Irish boarder. However, it didn't help sterling. The UK currency traded with a negative intraday bias. Technical considerations might have been in play. Cable yesterday tested the top of a MT consolidation pattern. This test was rejected. Maybe this caused some profit taking on ST sterling longs. EUR/GBP gradually extended its rebound north of 0.89. The pair trades again in the mid 0.89 area.
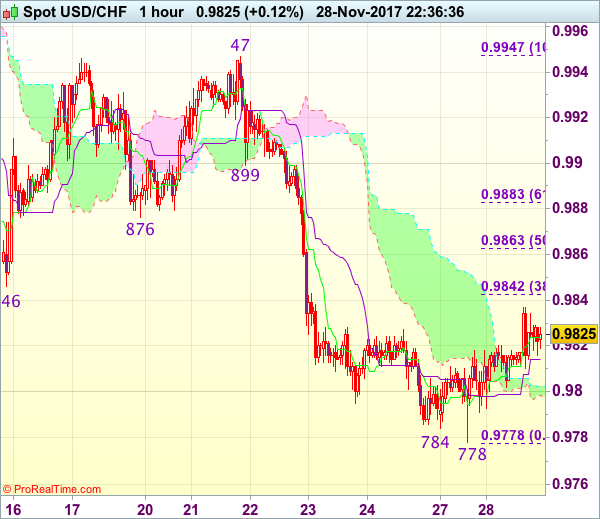
Trade Idea Wrap-up: USD/CHF – Sell at 0.9870
USD/CHF - 0.9833
Most recent candlesticks pattern : N/A
Trend : Near term down
Tenkan-Sen level : 0.9824
Kijun-Sen level : 0.9814
Ichimoku cloud top : 0.9803
Ichimoku cloud bottom : 0.9798
Original strategy :
Sell at 0.9855, Target: 0.9745, Stop: 0.9890
Position : -
Target : -
Stop : -
New strategy :
Sell at 0.9870, Target: 0.9770, Stop: 0.9905
Position : -
Target : -
Stop : -
As dollar has rebounded after falling to 0.9778 yesterday, suggesting consolidation above this level would be seen, however, reckon upside would be limited to 0.9846 (previous support) and 0.9860-70 should hold, bring another decline later, below said support at 0.9778 would extend recent decline from 1.1038 top towards 0.9730-37 support area but near term oversold condition should limit downside and reckon support at 0.9705 would hold from here, bring rebound later.
In view of this, we are looking to sell dollar again on recovery as previous support at 0.9876 should turn into resistance and limit upside. Only break of 0.9895-00 would defer and signal a temporary low is formed instead, bring a stronger rebound to 0.9920 but price should falter well below resistance at 0.9947.
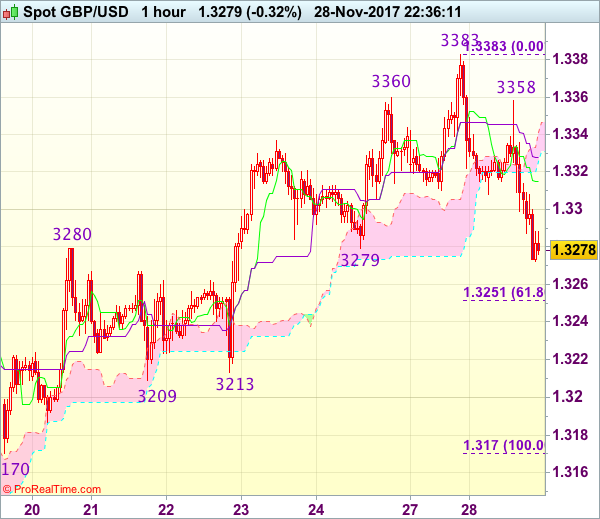
Trade Idea Wrap-up: GBP/USD – Exit long entered at 1.3280
GBP/USD - 1.3275
Most recent candlesticks pattern : N/A
Trend : Near term up
Tenkan-Sen level : 1.3312
Kijun-Sen level : 1.3325
Ichimoku cloud top : 1.3341
Ichimoku cloud bottom : 1.3326
Original strategy :
Bought at 1.3280, Target: 1.3380, Stop: 1.3245
Position : - Long at 1.3280
Target : - 1.3380
Stop : - 1.3245
New strategy :
Exit long entered at 1.3280
Position : - Long at 1.3280
Target : -
Stop : -
As cable ran into renewed selling interest at 1.3358 and has slipped again, dampening our bullishness and suggesting a temporary top has been formed at 1.3383, hence downside risk remains for weakness to 1.3250-55 (61.8% Fibonacci retracement of 1.3170-1.3383), however, still reckon downside would be limited to 1.3230 and support at 1.3209-13 would hold from here, bring rebound later.
In view of this, would be prudent to exit long entered at 1.3280 and stand aside for now. Above the Tenkan-Sen (now at 1.3312) would bring test of the Kijun-Sen (now at 1.3325) but only break of said resistance at 1.3358 would revive bullishness and signal the retreat from 1.3383 has ended, bring retest of this level first.
SPOT GOLD – Eventual Break into Daily Cloud Signals Further Upside
Spot Gold price maintains firm tone on Tuesday and holding near fresh high at $1299 (the highest since mid-October).
The yellow metal's price eventually broke into thickening daily cloud (spanned between $1289 and $1309) after cloud base repeatedly capped upside attempts last week.
Sentiment remains positive for further advance as concerns over the pace of rate hikes and US tax overhaul continues to weigh on the greenback.
Bullish setup of daily techs also supports, with today's formation of 10/55SMA bull-cross, additionally supporting.
Bulls eye cracked pivot at $1297 (Fibo 38.2% of $1357/$1260 descend) and psychological $1300 barrier, break of which would open way towards next key point at $1309 (daily cloud top). Broken cloud base ($1289) marks key support and is expected to limit downside attempts.
Res: 1297; 1300; 1306; 1309
Sup: 1292; 1289; 1286; 1282

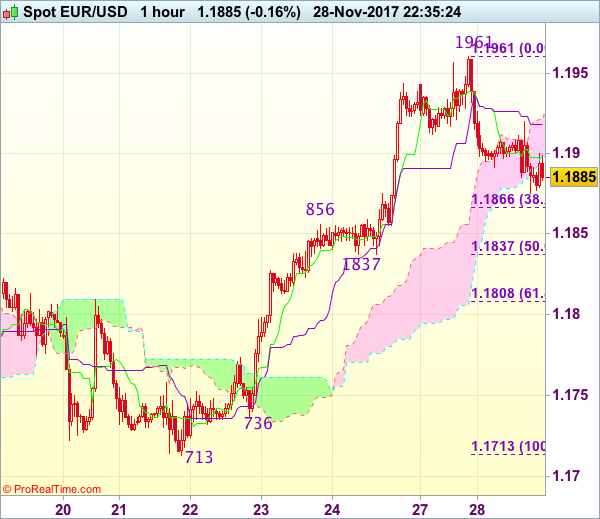
Trade Idea Wrap-up: EUR/USD – Buy at 1.1845
EUR/USD - 1.1884
Most recent candlesticks pattern : N/A
Trend : Near term up
Tenkan-Sen level : 1.1898
Kijun-Sen level : 1.1918
Ichimoku cloud top : 1.1922
Ichimoku cloud bottom : 1.1897
Original strategy :
Buy at 1.1845, Target: 1.1945, Stop: 1.1810
Position : -
Target : -
Stop : -
New strategy :
Buy at 1.1845, Target: 1.1945, Stop: 1.1810
Position : -
Target : -
Stop : -
As the single currency has retreated after rising to 1.1961, suggesting consolidation below this level would be seen and pullback to 1.1865-70 (38.2% Fibonacci retracement of 1.1713-1.1961) cannot be ruled out, however reckon support at 1.1837 (also 50% Fibonacci retracement of 1.1713-1.1961) would limit downside and bring rebound later. Only break of said resistance at 1.1961 would confirm recent upmove has resumed and extend gain towards psychological level at 1.2000.
In view of this, we are looking to buy euro on pullback as said support at 1.1837 should contain downside, bring another rise later. Below this support would defer and suggest a temporary top is possibly formed, bring correction of recent rise to 1.1800-05 first.
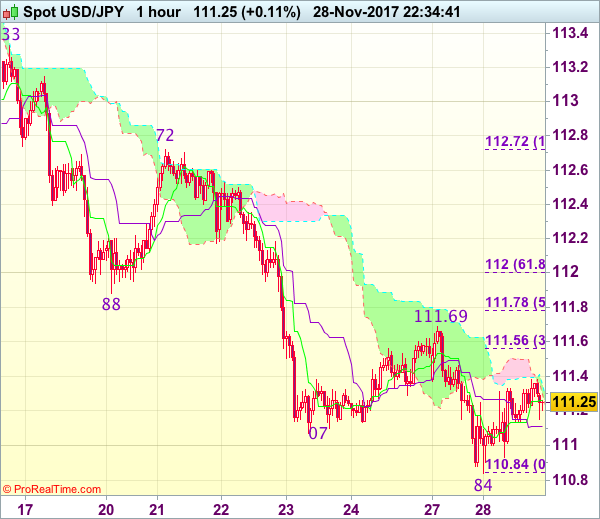
Trade Idea Wrap-up: USD/JPY – Buy at 111.00
USD/JPY - 111.26
Most recent candlesticks pattern : N/A
Trend : Near term down
Tenkan-Sen level : 111.26
Kijun-Sen level : 111.11
Ichimoku cloud top : 111.35
Ichimoku cloud bottom : 111.29
Original strategy :
Buy at 111.00, Target: 112.00, Stop: 110.65
Position : -
Target : -
Stop : -
New strategy :
Buy at 111.00, Target: 112.00, Stop: 110.65
Position : -
Target : -
Stop : -
As the greenback recovered after falling to 110.84, suggesting consolidation above this level would be seen and corrective bounce to 111.60, then test of previous support at 111.88, however, reckon upside would be limited to 112.00 and price should falter below 112.35-40 and bring another decline later this week.
In view of this, we are looking to turn long on dips. Below said support at 110.84 would signal recent decline is still in progress and may extend weakness to 110.70 and possibly towards 110.50 but loss of momentum should limit downside to 110.20-25 and reckon 110.00 would hold from here.
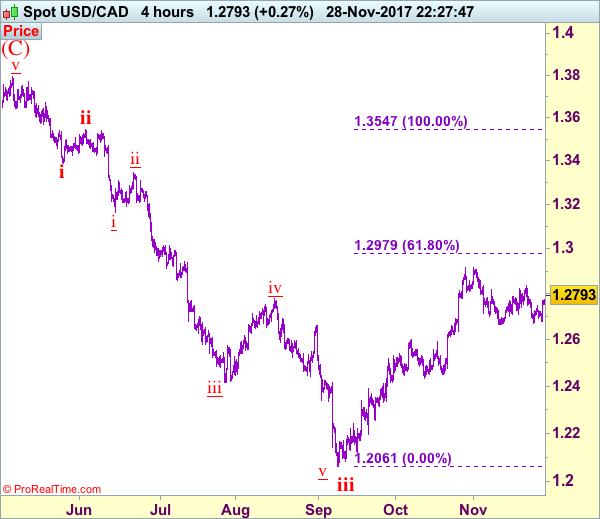
Trade Idea: USD/CAD – Sell at 1.2720
USD/CAD - 1.2682
Trend: Near term up
Original strategy :
Sold at 1.2720, stopped at 1.2780
Position: - Short at 1.2720
Target: -
Stop: - 1.2780
New strategy :
Stand aside
Position: -
Target: -
Stop:-
The greenback continued finding decent demand above previous support at 1.2665, suggesting further consolidation above this level would be seen and test of indicated resistance at 1.2937 cannot be ruled out, however, a sustained breach above there is needed to revive bullishness and signal the pullback from 1.2917 top has ended, bring further gain to 1.2880, then retest of this level later.
On the downside, below 1.750 would bring weakness to 1.2700-10 but said support at 1.2665 should remain intact, bring another rebound later. Only a break of 1.2665 would signal another leg of decline from 1.2917 top is underway for weakness to support at 1.2636, below there would bring stronger correction of recent rise to 1.2600 and later towards 1.2550-60
To recap, wave B from 1.3066 is unfolding as an a-b-c and is sub-divided as a: 1.2192, b: 1.2716 and wave c is a 5-waver with i: 1.1983, ii: 1.2506, extended wave iii with minor iii at 1.0206, wave iv ended at 1.0781 and wave v as well as wave iii has ended at 0.9931, hence the subsequent choppy trading is the wave iv which is unfolding as (a)-(b)-(c) with (a) leg of iv ended at 1.0854, followed by (b) leg at 1.0108 and (c) leg as well as the wave iv ended at 1.0674. The wave v is sub-divided by minor wave (i): 0.9980, (ii): 1.0374, (iii): 0.9446, (iv): 0.9913 and (v) as well as v has possibly ended at 0.9407, therefore, consolidation with upside bias is seen for major correction, indicated target at 1.3700 and 1.4000 had been met and further gain to 1.4700 would be seen later.
WTI Oil Extends Pullback from $59.02; Markets Focus Key Event – OPEC Policy Meeting
WTI oil price fell further on Tuesday, in extension of Monday's over 1% losses on pullback from recovery peak at $59.02. Pullback on oversold daily techs could extend further to test solid supports at $57.17 (rising 10SMA) and $56.65 (rising 20SMA). Extended corrective action should not exceed $56.41 support (Fibo 61.8% of $54.80/$59.02 upleg) to keep in play immediate hopes of testing psychological $60 barrier. Otherwise, deeper correction could be expected and supports at $55.80 (Fibo 76.4%) and $54.80 ( key n/t support / 14 Nov trough) would be exposed on break lower. Steep uptrend from $42.04 (2017 low) requires correction as overbought weekly studies are generating negative signal. OPEC meeting on Thursday is focused as key event for oil markets this week. It seems that the cartel is facing a tough policy talks, as OPEC's efforts to rebalance the oil market rise concerns about global oil deficit which could further boost oil prices. Currently, the cartel doesn't have a consensus about extension of current output cut program that raises concerns about the outcome of cartel's meeting on Nov 30.
Res: 57.90; 59.02; 59.82; 60.00
Sup: 57.41; 57.17; 56.65; 56.41
COPPER – Extended Bears Tested Critical Support Provided by Daily Cloud Base
Copper extends steep pullback from $3.1750 high (double upside rejection) and tested key support at $3.0642 (daily cloud base).
Bears were so far unable to break below cloud base after Tuesday's strong bearish acceleration surged into thick daily cloud (spanned between $3.0642 and $3.1151).
This is very significant support as the metal last traded below cloud in early June and since then the cloud was tracking ascend.
Firm break below cloud could spark stronger weakness and open way for test of initial target at $3.0305 (17 Nov trough), with 100SMA ($3.0049) and psychological $3.00 supports expected to come in focus.
Daily techs are coming into full bearish setup and support the notion.
However, bears may show stronger hesitation at cloud base and enter extended consolidation before bears resume.
Converged 10/20SMA's ($3.1049) should keep the upside protected, guarding the upper pivot at $3.1151 (daily cloud top).
Res: 3.0857; 3.1049; 3.1151; 3.1330
Sup: 3.0642; 3.0485; 3.0305; 3.0049