Sample Category Title
EURO Intraday Bearish Below 1.1800
The euro has declined against the U.S dollar, touching 1.1767, as global stocks and the U.S dollar index start to recover after better U.S data and political news. The EURUSD pair currently trades around the 1.1780 level, after previously trading as high as 1.1860 on Wednesday. Traders now look to key CPI inflation data from the eurozone economy, and the crucial U.S tax plan reform vote, which is being held in U.S Senate late on Thursday evening.
The EURUSD pair remains intraday bearish while trading below the 1.1800 technical level. Further declines towards the 1.1767 and 1.1710 appear likely while price-action trades below the 1.1800 level.
Should price-action move back above the 1.1800 level, further upside towards the 1.1860 and 1.1910 levels remains likely.
Trade Idea: GBP/USD – Stand aside
GBP/USD – 1.3150
Original strategy :
Sold at 1.3170, stopped at 1.3190
Position: - Short at 1.3170
Target: -
Stop: - 1.3190
New strategy :
Stand aside
Position: -
Target: -
Stop:-
Although cable rebounded again yesterday to 1.3214, as price has retreated again after faltering below indicated resistance at 1.3230, retaining our view that further consolidation would be seen and weakness to 1.3100 cannot be ruled out, however, support at 1.3062 would hold and price should stay above previous support at 1.3039, bring another rebound later. A break of previous support at 1.3027 is needed to confirm the aforesaid decline from 1.3658 top has resumed for weakness to psychological support at 1.3000, break there would encourage for subsequent decline towards 1.2950-60.
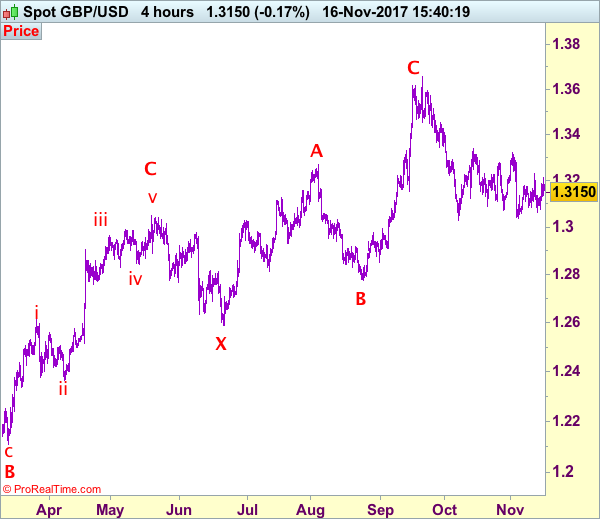
On the upside, only above said resistance at 1.3230 would defer and prolong choppy consolidation, risk rebound to 1.3250-60 but resistance at 1.3299 should limit upside and price should falter below last week’s high at 1.3321, bring another retreat later. Our preferred count is that (pls see the attached chart) the wave IV is unfolding as a complex double three (ABC-X-ABC) correction with 2nd wave B ended at 1.2774, hence 2nd wave C could have ended at 1.3658.
Our preferred count on the daily chart is that cable's rebound from 1.3500 (wave (A) trough) is unfolding as a wave (B) with A ended at 1.7043, followed by triangle wave B and wave C as well as wave (B) has ended at 1.7192, the subsequent selloff is the larger degree wave (C) which is still unfolding with minor wave (III) of larger degree wave 3 ended at 1.1986, hence wave (IV) correction is in progress which could either be a triangle wave (IV) of a complex formation but upside should be limited to 1.3500 and price should falter well below 1.4000, bring another decline in wave (V) of 3 for weakness to 1.1500, then 1.1200.
Gold Price Signaling Bullish Continuation Above $1280 Vs US Dollar
Key Highlights
- Gold price started an upside correction from the $1265 swing low against the US Dollar.
- There is a crucial ascending channel forming with support near $1274 on the 4-hours chart of XAU/USD.
- The US Consumer Price Index in Oct 2017 increased 2% (YoY), similar to the market forecast.
- Today, the US Industrial Production for Oct 2017 will be released, which is forecasted to increase by 0.5% (MoM).
Gold Price Technical Analysis
Gold price has started a decent uptrend from the $1270 low against the US Dollar. It has to move above $1290 and $1300 level to gain further momentum.
Looking at the 4-hours chart of XAU/USD, there is a crucial ascending channel forming with support near $1274. The price is currently above the 100 simple moving average (red, 4-hour) and $1276, which is a positive sign.
A successful close above the channel resistance at $1290 would open the doors for more gains toward $1300 and $1310 in the near term.
On the downside, important support can be seen at $1280 and $1274. The 4-hour RSI is just below the 50 level and signaling a neutral bias in the short term for gold price as long as it stays above $1274.
US Consumer Price Index
Recently in the US, the Consumer Price Index for Oct 2017 was released by the US Bureau of Labor Statistics. The forecast was lined up for the CPI to increase by 2% compared with the same month a year ago.
The actual result in line with the forecast since Oct’s CPI was +2%. Looking at the monthly change, there was a rise of 0.1% in the CPI, similar to the forecast. On the other hand, the Consumer Price Index Ex Food & Energy in Oct 2017 rose 1.8% (YoY), more than the forecast of +1.7%.
The report added:
The shelter index increased 0.3 percent and was the main factor in the seasonally adjusted all items increase. The energy index fell, as a decline in the gasoline index outweighed increases in other energy component indexes. The food index was unchanged over the month.
Overall, the result was neutral, which increases the risk of more gains in gold price above $1290 in the near term.
Economic Releases to Watch Today
UK Retail Sales for Oct 2017 (YoY) – Forecast -0.6%, versus +1.2% previous.
UK Retail Sales for Oct 2017 (MoM) – Forecast +0.1%, versus -0.8% previous.
Euro Zone CPI for Oct 2017 (YoY) – Forecast +1.4%, versus +1.4% previous.
Euro Zone CPI for Oct 2017 (MoM) – Forecast +0.1%, versus +0.4% previous.
US Industrial Production Oct 2017 (MoM) – Forecast +0.5%, versus +0.3% previous.
US Capacity Utilization Oct 2017 – Forecast 76.3%, versus 76.0% previous.
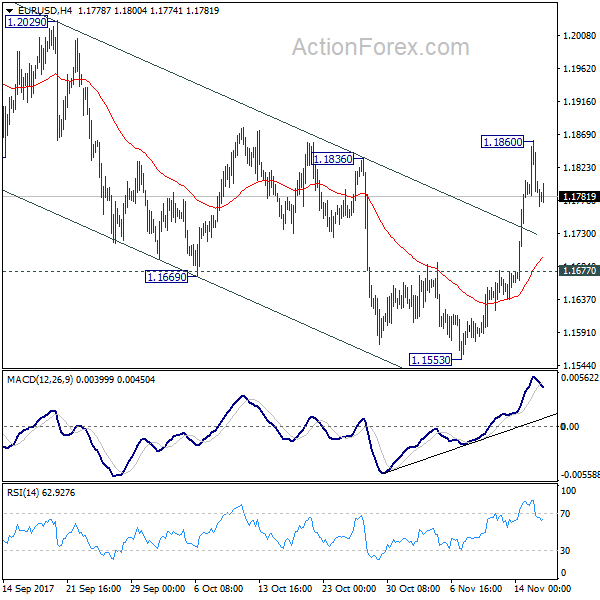
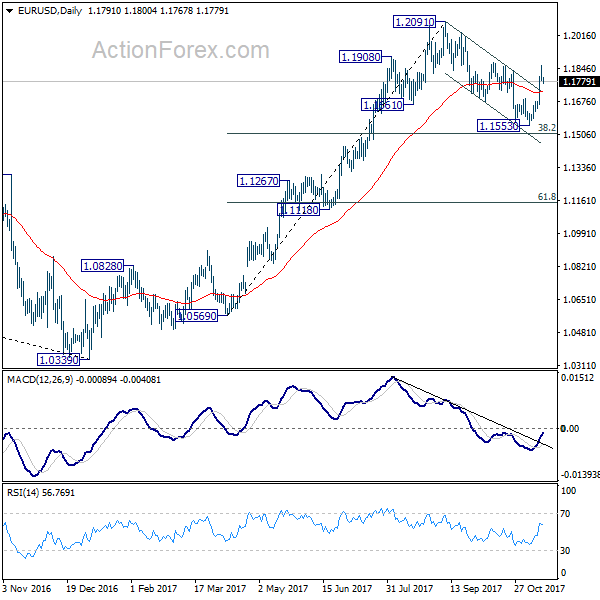
EUR/USD Daily Outlook
Daily Pivots: (S1) 1.1763; (P) 1.1811 (R1) 1.1839; More...
A temporary top is in place at 1.1860 in EUR/USD and intraday bias is turned neutral first. Outlook is unchanged that correction from 1.2091 has completed at 1.1553 already. Further rise is expected. Above 1.1860 will target 1.2091 high. However, break of 1.1677 support will turn focus back to 1.1553 low instead.
In the bigger picture, rise from 1.0339 medium term bottom is seen as a corrective move for the moment. Therefore, in case of another rally, we'd be cautious on 38.2% retracement of 1.6039 (2008 high) to 1.0339 (2017 low) at 1.2516 to limit upside and bring reversal. Meanwhile, sustained trading below 55 week EMA (now at 1.1346) will suggest that such medium term rebound is completed and could then bring retest of 1.0339 low.
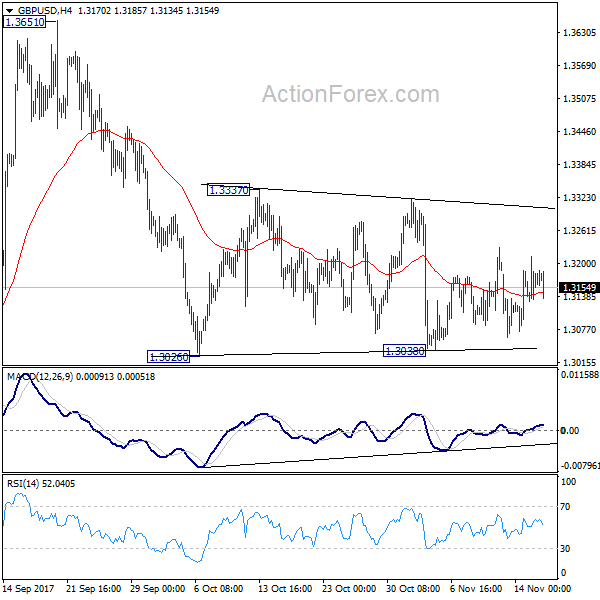
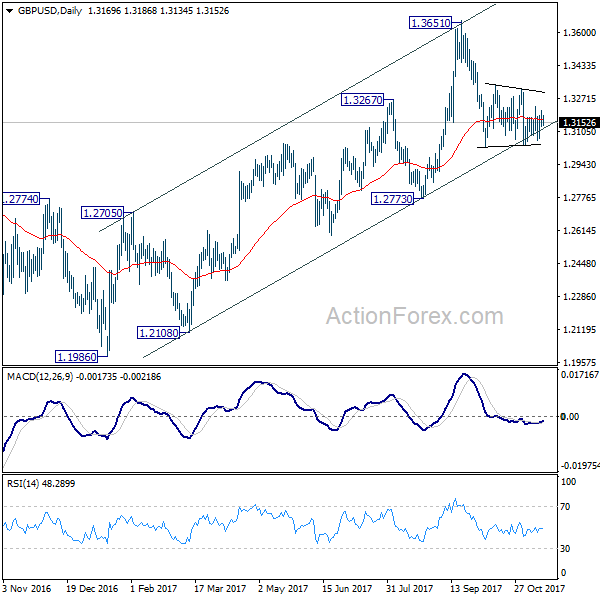
GBP/USD Daily Outlook
Daily Pivots: (S1) 1.3127; (P) 1.3171; (R1) 1.3212; More....
Intraday bias in GBP/USD remains neutral as it's still bounded in range of 1.3038/3337. In case of another recovery, upside should be limited below 1.3337 resistance to bring fall resumption. Break of 1.3038 will now resume decline from 1.3651 to 1.2773 key support level. However, decisive break of 1.3337 will indicate that pull back from 1.3651 is completed and medium term rise from 1.1946 is resuming.
In the bigger picture, as noted before, GBP/USD hit strong resistance from the long term falling trend line. Current development is starting to favor that corrective rebound from 1.1946 low has completed at 1.3651. Decisive break of 1.2773 will confirm this bearish case and target a test on 1.1946 low next, with prospect of resuming the low term down trend. Nonetheless, break of 1.3320 resistance will restore the rise from 1.1946 for 38.2% retracement of 2.1161 (2007 high) to 1.1946 (2016 low) at 1.5466.
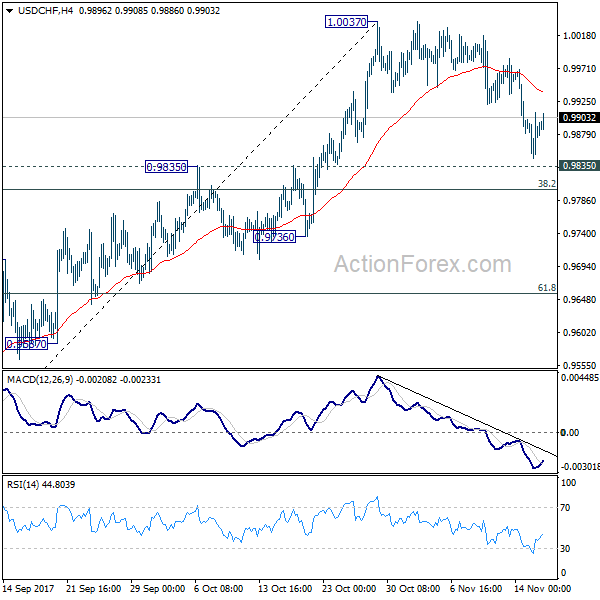
USD/CHF Daily Outlook
Daily Pivots: (S1) 0.9850; (P) 0.9881; (R1) 0.9915; More....
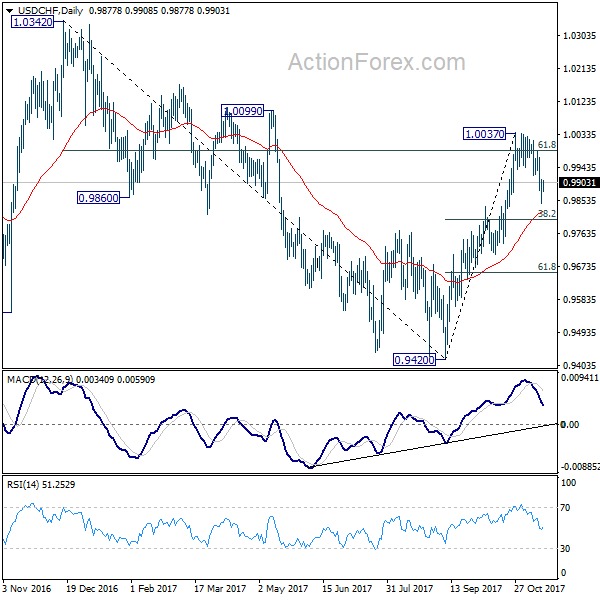
Focus remains on 0.9835 resistance turned support in USD/CHF. Decisive break there will argue that whole rebound form 0.9420 is completed and turn outlook bearish. In that case, USD/CHF should target 61.8% retracement of 0.9420 to 1.0037 at 0.9565 and possibly below. Nonetheless strong rebound from 0.9835 will retain near term bullishness. And, break of 1.0047 will extend the rise from 0.9420 and target 1.0342 high.
In the bigger picture, current development suggests that USD/CHF has defended 0.9443 (2016 low) key support level again. Rise from 0.9420 could is a medium term up move and should target a test on 1.0342 high. This represents the upper end of a long term range that started back in 2015. On the downside, break of 0.9736 support is now needed to indicate completion of the rise from 0.9420. Otherwise, further rally will remain in favor in medium term.
Trade Idea: GBP/JPY – Stand aside
GBP/JPY - 148.85
New strategy :
Stand aside
Position: -
Target: -
Stop:-
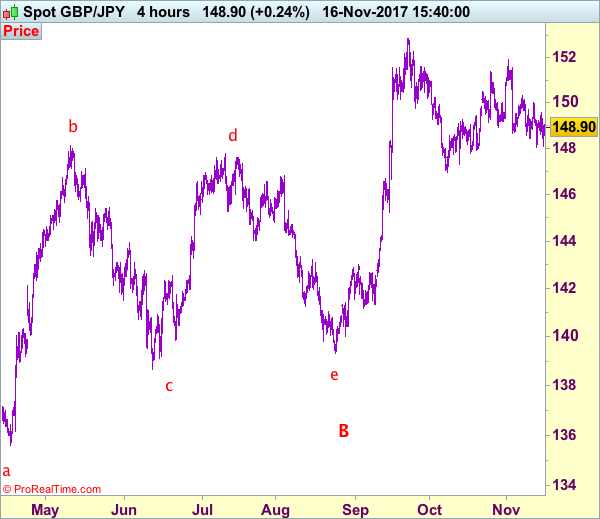
Although sterling slipped again yesterday to as low as 148.10, as the pound has rebounded again after holding above support at 148.05, retaining our view that further consolidation would take place and another bounce to 149.50-55 cannot be ruled out, however, reckon resistance at 150.00 would hold and bring another decline later.
On the downside, below said support at 148.05 would signal the erratic fall from 151.90 top is still in progress for weakness to previous support at 147.80 but oversold condition should limit downside and support at 147.30 should remain intact.
Our preferred count is that larger degree wave V with circle is unfolding from 251.12 with wave (I) 219.34, (II): 241.38 and wave (III) is subdivided into 1: 192.60, 2: 215.89 (23 Jul 2008) and wave 3 ended at 118.87 earlier in 2009. The correction from there to 162.60 is wave 4 which itself is a double three and is labeled as first a-b-c ended at 151.53, followed by wave x at 139.03, 2nd a ended at 162.60, 2nd b at 146.75 and 2nd c leg of wave 4 ended at 163.00. Therefore, the decline from 163.00 to 116.85 is now treated as wave 5 which also marked the end of larger degree wave (III), hence wave (IV) major correction has commenced for retracement of the wave (III) from 241.38 and upside target at 183.95-00 (50% Fibonacci retracement of the wave (II) from 241.38) had been met, a drop below 160.00 would suggest wave (IV) has ended at 195.85, bring decline in wave (V) for initial weakness to 130 (already met) and 120.
Forex: Positive US Data Negated By Tax Plan Opposition
The US Labor Department released data on Wednesday showing the consumer price index edged up by 0.1% in October after climbing by 0.5% in September. The modest increase in consumer prices was in line with market expectations. CPI excluding food and energy prices climbed by 0.2% in October after inching up by 0.1% in the previous month – as expected by the markets. The US Commerce Department released data showing that US retail sales rose by 0.2% in October after spiking by an upwardly revised 1.9% in September. This slight increase beat market expectations and gives more justification for the Fed to hike rates in December as the markets are >90% expecting. Such data should have boosted USD but that was countered on news that the Senate Republican tax plan received opposition from two Republican lawmakers, a possible warning sign for the plan. This is more damning as the Republican party can’t lose more than 2 votes from their ranks for the reform proposal to pass.
Data, on Wednesday, from the UK Office of National Statistics (ONS) showed UK unemployment holding at 4.3%, unchanged in the last 3 months and at its lowest rate for 42 years. The ONS also released average earnings data that, year-on-year, climbed to 2.2%. Whilst average earnings are rising, the gap to UK inflation is concerning for monetary policymakers. Currently, UK inflation is running at an annualized rate of 3% which means that real average earnings, adjusted for inflation, have dropped 0.4% from a year ago. The Bank of England Monetary Policy committee will need to digest the current, and future data, before making any change in monetary policy.
The Japanese Ministry of Economy, Trade and Industry released data showing Japan’s industrial production declined less than forecast in September. Industrial production dropped to a seasonally adjusted monthly 1% in September, beating the 1.1% decrease reported earlier. This was followed by a 2% rise in August.
EURUSD is 0.1% lower in early Thursday trading at around 1.1778.
USDJPY is 0.2% higher in early session trading at around 113.10.
GBPUSD is little changed in early trading at around 1.3172.
Gold in unchanged overnight, currently trading around $1,277.
WTI is 0.15% higher in early trading at around $55.56.
Major data releases for today:
At 09:30 GMT, UK National Statistics will release Retail Sales (MoM & YoY) for October. Month on Month data is forecast to come in at 0.1%, an improvement on the previous release of -0.8%. Year on Year data is forecast at -0.6% a significant drop from the previous release of 1.2%. The markets will likely see GBP volatility on the data release.
At 10:00 GMT, Eurostat will release CPI and CPI Core (YoY) data for October. CPI is expected unchanged at 1.4% with Core CPI forecast at 0.9%, lower than the previous release of 1.1%. Expect EUR volatility if the actual release is significantly different from the forecast.
At 13:30 GMT, the US Department of Labor will release Initial Jobless Claims for the week ending November 10th along with Continuing Claims for the week ending November 3rd. Continuing claims are expected lower at 1.895M compared to the previous release of 1.901M. Initial Jobless Claims are forecast to come in at 253K, a slight reduction from the previous release of 239K. If the data is significantly different from expectations the markets will experience USD volatility.
At 14:00 GMT, Bank of England Governor Mark Carney is scheduled to speak at the Future Forum at St. George’s Hall, Liverpool, England.
USD/JPY Daily Outlook
Daily Pivots: (S1) 112.40; (P) 112.94; (R1) 113.42; More...
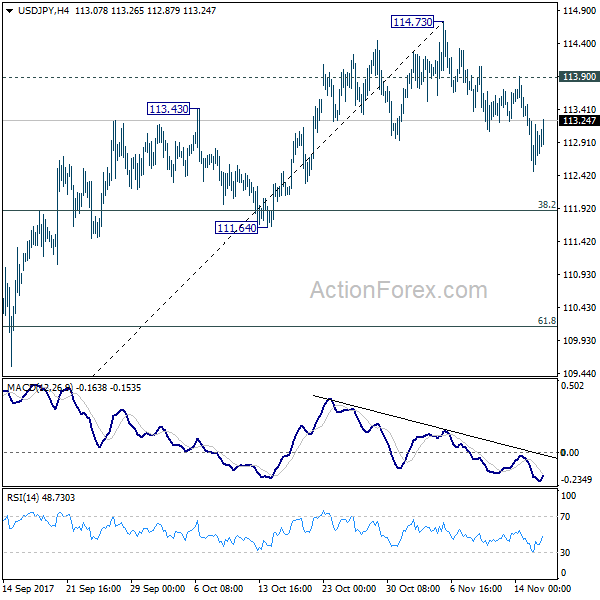
With 113.90 minor resistance intact, deeper fall could be seen to 38.2% retracement of 107.31 to 114.73 at 111.89 first. Sustained break of 111.64 support will now argue that rise from 107.31 has completed. In that case, USD/JPY should target 61.8% retracement at 101.14. On the upside, break of 113.90 resistance is needed to confirm completion of the fall. Otherwise, near term outlook will now stay cautiously bearish.
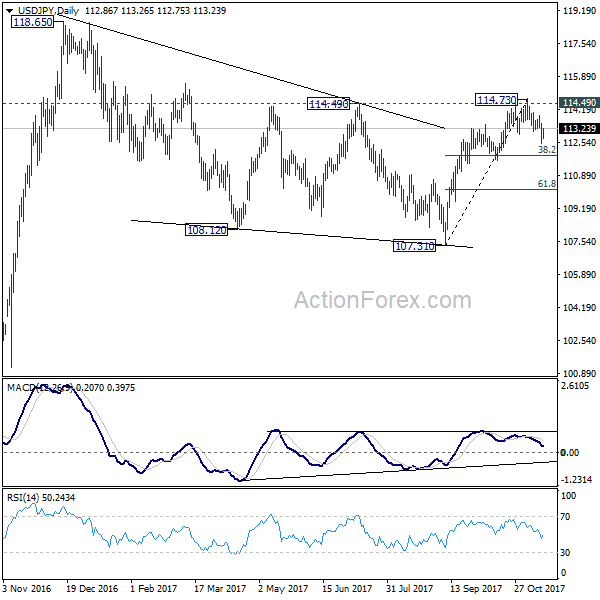
In the bigger picture, medium term rise from 98.97 (2016 low) is not completed yet. It should resume after corrective fall from 118.65 completes. Break of 114.49 resistance will likely resume the rise to 61.8% projection of 98.97 to 118.65 from 107.31 at 119.47 first. Firm break there will pave the way to 100% projection at 126.99. This will be the key level to decide whether long term up trend is resuming. However, firm break of 111.64 support will dampen this view and turn focus back to 107.31 instead.
Forex Technical Analysis: EUR/USD, USD/JPY, GBP/USD
EUR/USD
Current level - 1.1779
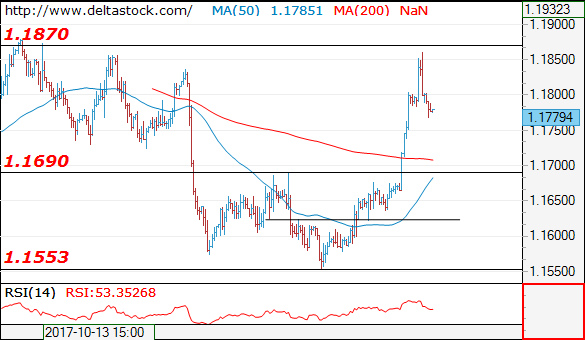
Yesterday's rise tested precisely the resistance at 1.1870 and the reversal below that zone will aim to correct the whole upmove since 1.1550 low. The intraday bias is bearish below 1.1820, for a slide to 1.1730.
| Resistance | Support | ||
| intraday | intraweek | intraday | intraweek |
|
1.1820 |
1.1870 |
1.1730 |
1.1690 |
|
1.1870 |
1.2090 |
1.1690 |
1.1550 |
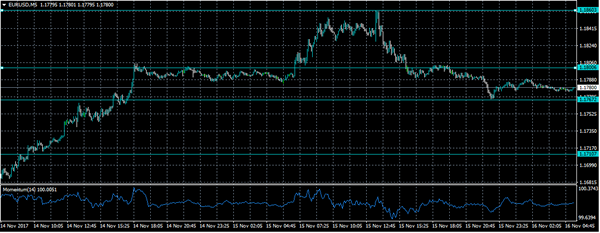
USD/JPY
Current level - 113.05
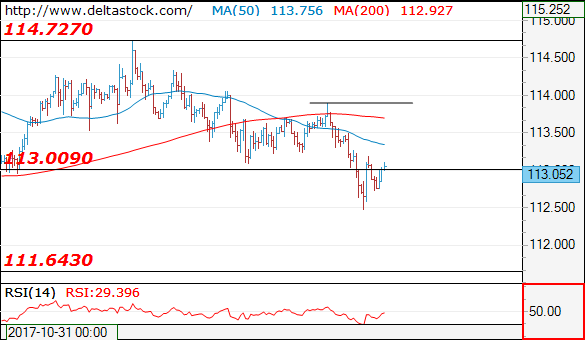
My outlook here is bearish, for a break through 112.50 low, towards 111.60. Initial resistance lies at 113.25 and crucial on the upside is 113.90.
| Resistance | Support | ||
| intraday | intraweek | intraday | intraweek |
|
113.25 |
115.50 |
112.50 |
111.60 |
|
113.90 |
116.80 |
111.60 |
107.30 |
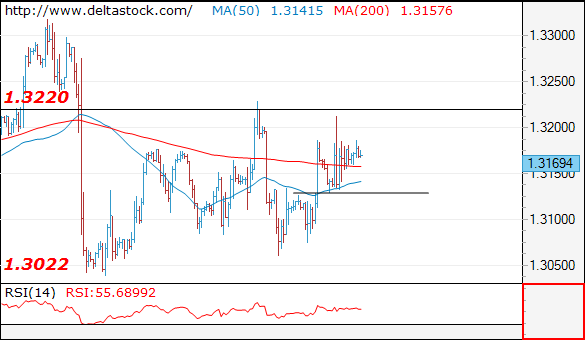
GBP/USD
Current level - 1.3169
The recent test of 1.3220 failed, but the outlook remains positive above 1.3130, for a climb towards 1.3340 resistance zone.
| Resistance | Support | ||
| intraday | intraweek | intraday | intraweek |
|
1.3180 |
1.3220 |
1.3130 |
1.3020 |
|
1.3220 |
1.3340 |
1.3060 |
1.2760 |