Sample Category Title
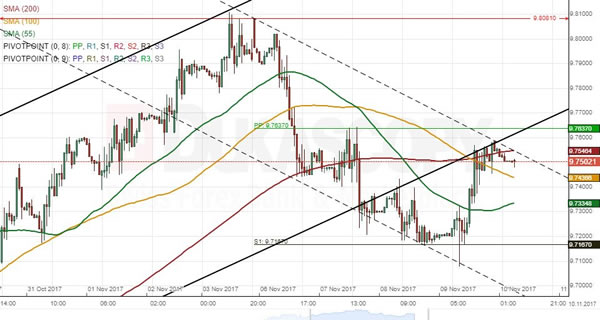
Technical Outlook: AUDUSD – Downside At Risk As 200SMA Caps
The Australian dollar holds in directionless mode after Thursday's action ended in long-legged Doji and upside attempts being repeatedly capped by 200SMA (0.7697) which limited action of this week. Overall picture remains negative and keeps risk on the downside as the pair is in consolidation phase (within 0.7625 and 0.7730) of larger downtrend from 0.8124 (08 Sep peak). Sustained break above 200SMA would ease persisting downside risk and allow for fresh upticks towards key barrier at 0.7730 (consolidation top/falling 20SMA), break of which would generate stronger bullish signal. Otherwise, near term focus is expected to remains at the downside, with firm break below 10SMA (0.7675) to re-expose temporary base at 0.7625 zone (reinforced by weekly 55SMA and Fibo 61.8% of 0.7328/0.8124 ascend).
Res: 0.7697, 0.7730, 0.7760, 0.7793
Sup: 0.7663, 0.7649, 0.7625, 0.7572
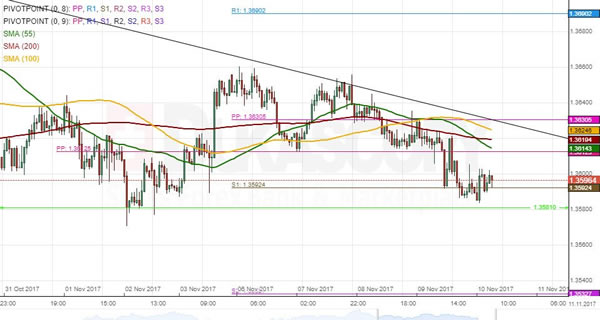
USD/SGD 1H Chart: US Dollar About To Breach Triangle
USD/SGD has been trading in a channel up since late August. This formation began when the rate reached a 2017 low at 1.3358 on September 8; the US Dollar has since moved up to the 1.36 mark. Another notable pattern that can be distinguished is a descending triangle. During its last wave down from the channel, the US Dollar was diminishing its trading range, but at the same time it failed to move below the 1.3580 mark, thus creating this aforementioned triangle. Technical indicators are in favour of a short-term recovery which is likely to hinder near a resistance cluster formed by the 55-, 100– and 200-hour SMAs circa 1.3625. In case this area is breached, the rate might push for the 1.3720 mark. Conversely, a failure to do so might strand the rate in a narrow trading range slightly above the 1.3580 mark. The Greenback should eventually break out to the downside and aim for the lower channel boundary near 1.3520.
EUR/SEK 1H Chart: Euro Tests 200-Hour SMA
Following a five-week appreciation against the Swedish Krona in an ascending channel, the common European currency has formed a channel in the opposite direction and is thus gradually moving lower. The pair reached a 2017 high last week when the rate reversed from the 9.8081 area. This suggests that a decline in both medium and long term is a likely option. The rate is currently testing the upper line of the junior channel—an area which is likewise reinforced by the 200-hour SMA. From this perspective, the rate should rebound from the this resistance and edge lower. However, given the steepness of the descending channel, this formation is unlikely to hold for long. Technical indicators flash mixed signals, but the overall tendency seems to point southwards. The rate might go as low as the monthly PP circa 9.68 during the following trading sessions prior to making a minor recovery.
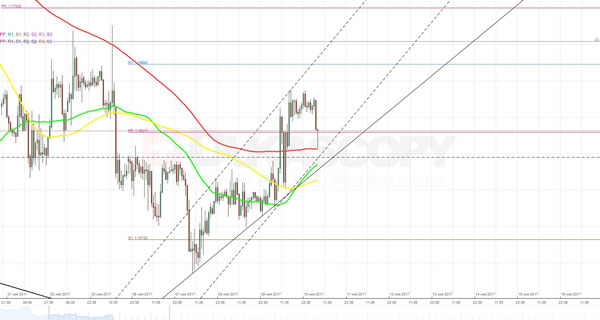
EUR/USD Analysis: Advances In Ascending Channel
The Dollar was quoted weaker against the Euro on Thursday amid concerns that the Senate would postpone corporate tax cuts until 2019. The situation did not improve even when the House relevant committee approved the current tax plan. On hourly chart these changes resulted only in minor adjustments of the current ascending channel boundaries. As an area near the 1.1630 level represents location of the weekly PP, the 55-, 100- and 200-hour SMAs, the exchange rate is not expected to make major advances in the southern direction. On the other hand, starting from the 1.1660 and up until the 1.1680 mark the pair will face different resistance barriers, including the 23.6% Fibonacci retracement level, which most probably are going to hamper the pair from active surging as well.
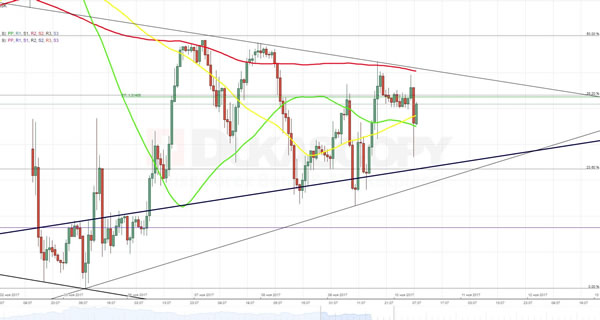
GBP/USD Analysis: Struggles To Bypass 200-Hour SMA
As it was expected, a combined resistance barrier formed by the weekly PP and the 38.2% Fibonacci retracement level managed to constrain the cable near the 1.3150 level.
Unless the Pound receives a proper impulse from some fundamental even, there is a little chance that it will manage to bypass the 200-hour SMA. But even in the best-case scenario the pair is unlikely to break above another resistance area this time protected by the 50% Fibonacci retracement level at 1.3180. If the Sterling starts to depreciate the initial fall is expected to be stopped by the 55- and 100-hour SMAs. However, once the pair manages to bypass them, the plunge might continue up until the 1.3100 mark located near the 23.6% retracement level.
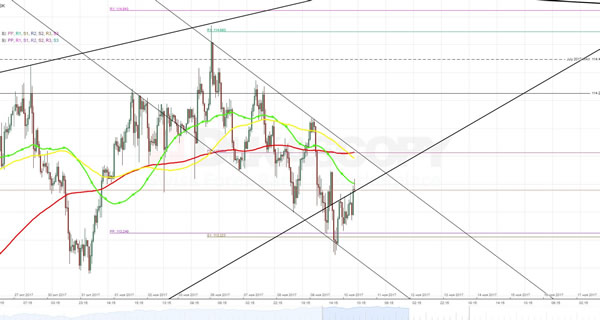
USD/JPY Analysis: Rebounds From 113.17
In line with expectations, the Yen continued to gain value against the Dollar under pressure from the slipping 55-, 100- and 200-hour SMAs. On the one hand, the currency rate continues to fluctuate within the descending channel formation, which implies further movement in the southern direction. On the other hand, the combined support level set up by the monthly PP at 113.25 and the weekly S1 at 113.22 indicates that this trading session the exchange rate is likely to spend wavering between the 113.60 and 113.30 marks.
The situation can be altered during the day amid the news coming from the APEC summit where Presidents Trump and Putin are expected to have a meeting.
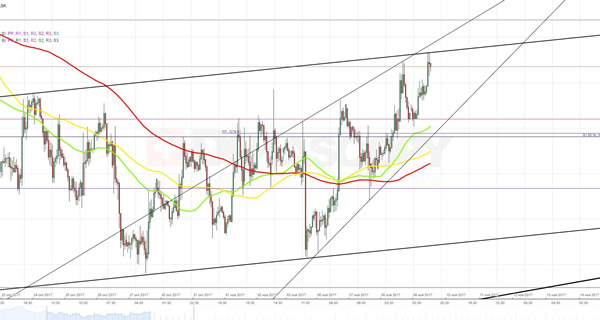
XAU/USD Analysis: Continues To Climb In Rising Wedge Formation
The yellow metal is continuing to trade against the buck at the intersection of large ascending channel and junior rising wedge formations.
Although the larger pattern managed to constrain the bullish sentiment for now, but the rising 55-, 100- and 200-hour SMAs as well as ongoing concerns over implementation of the US President Donald Trump’s tax plan suggest that such upward movement is going to continue and might actually reach the upper trend-line of another dominant descending channel near the 1,293.00 mark. However, from daily chart perspective the breakout from rising wedge formation is expected to happen earlier near the 1,288.00 level.
USD/CAD: Canadian New Housing Price Index
The Canadian Dollar appreciated against the Greenback, reflecting Canadian economic report. Ahead of the release, USD/CAD slid through the 1.2690 area, then returned to 1.2720, from where another data as well as investors’ worries about delaying the US corporate tax cuts sent the pair down to finish the session at 1.680. The bearish sentiment is likely to be sustained in the pair due to the lack of reports on Friday.
Statistics Canada reported on Thursday that the country’s House Price Index rose 0.2% in September, matching analysts’ expectations. The strongest increase was registered in British Columbia, while remaining areas showed mixed results. On an annual basis, September’s new housing prices increased 3.8% for the third month in succession.

Trade Idea: GBP/USD – Hold short entered at 1.3170
GBP/USD – 1.3151
Original strategy :
Sold at 1.3170, Target: 1.3000, stop: 1.3230
Position: - Short at 1.3170
Target: - 1.3000
Stop: - 1.3230
New strategy :
Hold short entered at 1.3170, Target: 1.3000, stop: 1.3230
Position: - Short at 1.3170
Target: - 1.3000
Stop:- 1.3230
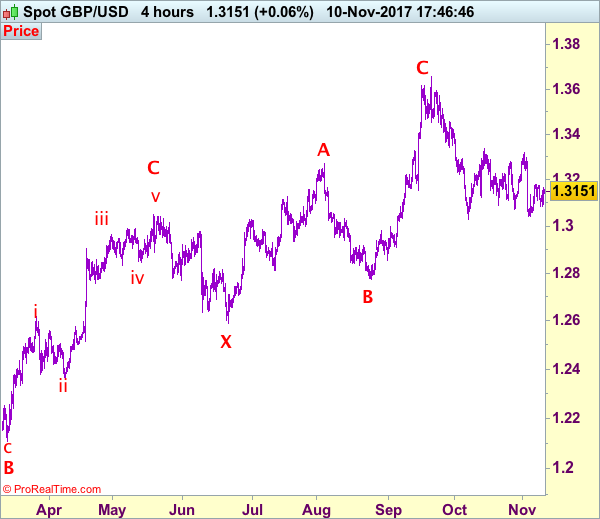
Although sterling has rebounded again after finding support at 1.3085 and further consolidation would be seen, reckon upside would be limited to 1.3200 and bring another decline later, below 1.3075-85 would suggest the rebound from 1.3039 has ended and bring retest of this level later. Looking ahead, a break below recent low at 1.3027 would confirm early decline from 1.3658 top has resumed for weakness to psychological support at 1.3000, break there would encourage for further decline towards 1.2950-60 later.
In view of this, we are holding on to our short position entered at 1.3170. Above 1.3220 would defer and prolong choppy consolidation, risk rebound to 1.3250-60 but resistance at 1.3299 should limit upside and price should falter below last week’s high at 1.3321, bring another retreat later. Our preferred count is that (pls see the attached chart) the wave IV is unfolding as a complex double three (ABC-X-ABC) correction with 2nd wave B ended at 1.2774, hence 2nd wave C could have ended at 1.3658.
Our preferred count on the daily chart is that cable's rebound from 1.3500 (wave (A) trough) is unfolding as a wave (B) with A ended at 1.7043, followed by triangle wave B and wave C as well as wave (B) has ended at 1.7192, the subsequent selloff is the larger degree wave (C) which is still unfolding with minor wave (III) of larger degree wave 3 ended at 1.1986, hence wave (IV) correction is in progress which could either be a triangle wave (IV) of a complex formation but upside should be limited to 1.3500 and price should falter well below 1.4000, bring another decline in wave (V) of 3 for weakness to 1.1500, then 1.1200.
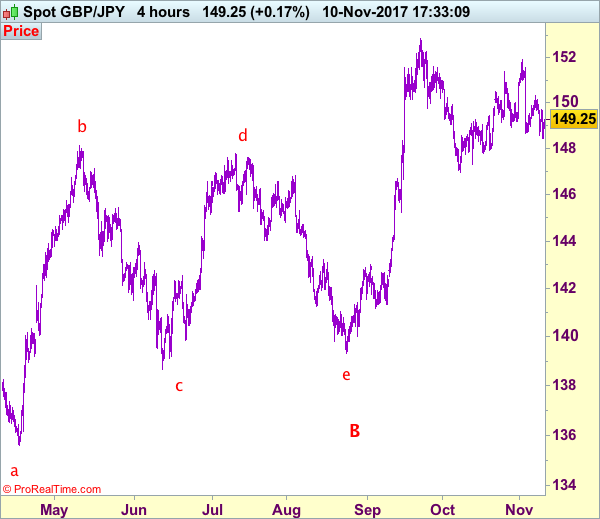
Trade Idea: GBP/JPY – Hold short entered at 150.20
GBP/JPY - 149.15
Original strategy:
Sold at 150.20, Target: 148.20, Stop: 150.20
Position: - Short at 150.20
Target: - 148.20
Stop: - 150.20
New strategy :
Hold short entered at 150.20, Target: 148.20, Stop: 149.80
Position: - Short at 150.20
Target: - 148.20
Stop:- 149.80
As sterling has rebounded after marginal fall to 148.45, consolidation above this level would be seen, however, reckon resistance at 149.70 would limit upside and bring another decline later, below said support at 148.45 would extend the fall from 151.90 top to 148.00, then test of previous support at 147.80 but oversold condition should limit downside and support at 147.30 should remain intact.
In view of this, we are holding on to our short position entered at 150.20. Only above resistance at 150.30 would defer and risk test of previous support at 150.60-65 but break there is needed to signal low is formed, bring a stronger rebound to 151.10-20, however, still reckon upside would be limited to 151.55-60 and price should falter well below said resistance at 151.90 (last week’s high), bring another retreat later.
Our preferred count is that larger degree wave V with circle is unfolding from 251.12 with wave (I) 219.34, (II): 241.38 and wave (III) is subdivided into 1: 192.60, 2: 215.89 (23 Jul 2008) and wave 3 ended at 118.87 earlier in 2009. The correction from there to 162.60 is wave 4 which itself is a double three and is labeled as first a-b-c ended at 151.53, followed by wave x at 139.03, 2nd a ended at 162.60, 2nd b at 146.75 and 2nd c leg of wave 4 ended at 163.00. Therefore, the decline from 163.00 to 116.85 is now treated as wave 5 which also marked the end of larger degree wave (III), hence wave (IV) major correction has commenced for retracement of the wave (III) from 241.38 and upside target at 183.95-00 (50% Fibonacci retracement of the wave (II) from 241.38) had been met, a drop below 160.00 would suggest wave (IV) has ended at 195.85, bring decline in wave (V) for initial weakness to 130 (already met) and 120.