Sample Category Title
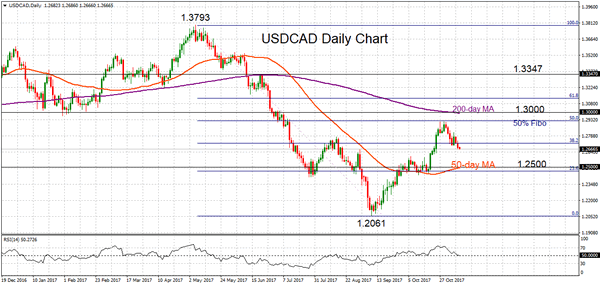
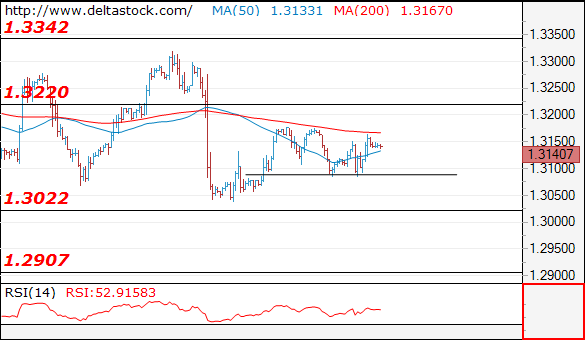
USDCAD Drops To 2-Week Low, Bearish Outlook Strengthened
USDCAD dropped to a fresh 2-week low as the pair comes under increasing pressure following a rejection at the 50% Fibonacci retracement level of the downtrend from 1.3793 to 1.2061. RSI is falling and suggesting further downside momentum is expected.
The pair is approaching a key level at 1.2500, this being near the 50-day moving average. A break below this support area would set USDCAD on the path to re-test the September 8 low of 1.2061. From this point, an extension lower would confirm the resumption of the downtrend from 1.3793.
To the upside, immediate resistance is at 1.2718 (38.2% Fibonacci) and then the 50% Fibonacci at 1.2922. This would likely be a challenge to break, but if successful, the market would meet further resistance at a very key psychological level at 1.3000, where the 200-day MA is converging as well. Rising above this area would see a reversal of the bearish phase and shift the market’s focus back to the 1.3793 peak.
In the short-term, downside risks are high. The medium-term outlook also remains bearish.
Forex Technical Analysis: EUR/USD, USD/JPY, GBP/USD
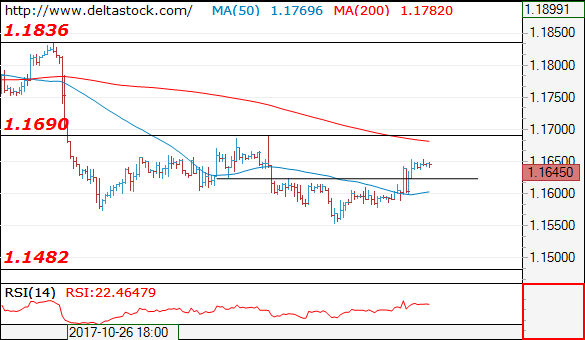
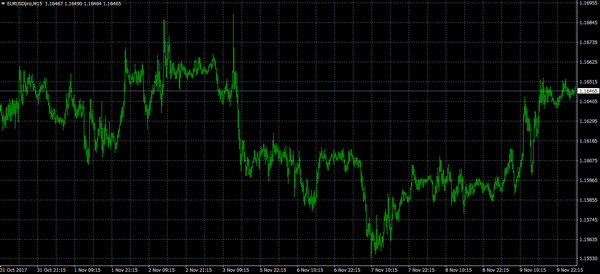
EUR/USD
Current level - 1.1645
The intraday bias is positive and the focus is still set at 1.1690 major resistance. Crucial on the downside is 1.1585 and a violation of that low will renew the slide towards 1.1480.
| Resistance | Support | ||
| intraday | intraweek | intraday | intraweek |
| 1.1625 | 1.1840 | 1.1625 | 1.1840 |
| 1.1690 | 1.1940 | 1.1690 | 1.1940 |
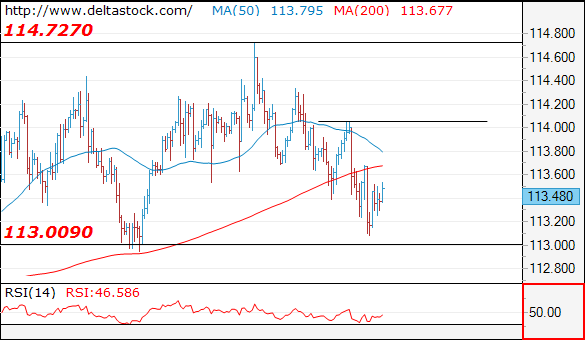
USD/JPY
Current level - 113.45
The downtrend is intact, in a process of a test of 113.00 support. My outlook is counter-trend and trigger on the upside is 114.04.
| Resistance | Support | ||
| intraday | intraweek | intraday | intraweek |
| 114.04 | 115.50 | 113.00 | 111.60 |
| 115.50 | 116.80 | 111.60 | 107.30 |
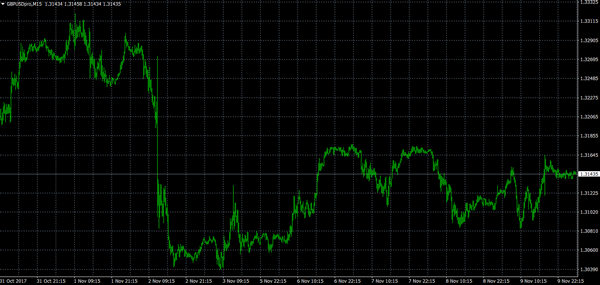
GBP/USD
Current level - 1.3140
The intraday bias remains positive, for a rise towards 1.3220 resistance area. Key support is projected at 1.3090.
| Resistance | Support | ||
| intraday | intraweek | intraday | intraweek |
| 1.3220 | 1.3220 | 1.3090 | 1.3020 |
| 1.3220 | 1.3340 | 1.3020 | 1.2760 |
Markets Prepare For UK Economic Figures
On the economic calendar, only a few nations will make headlines on Friday, including the United Kingdom. Europe’s second-largest economy will release a deluge of government data at 09:30 GMT.
The Office for National Statistics will report on manufacturing production and industrial production early in the day. Manufacturing production is forecast to rise 0.3% in September, which translates into a year-over-year gain of 2.4%.
Industrial production, which is a broader measure of factory output, is also forecast to rise 0.3%. In annual terms, this leads to a 1.9% increase.
London will also produce its latest trade figures in the early hours of trading on Friday. The total trade deficit is projected to fall to £4.6 billion in September from a previously reported £5.6 billion the month before.
Britain’s trade deficit with non-European Union (EU) countries is forecast to slip to £4.5 billion from £5.83 billion.
The goods trade deficit is also expected to narrow to £12.8 billion from £14.25 billion.
Shifting gears, the National Institute for Economic and Social Research (NIESR) will release its latest estimate for UK GDP. The latest report will cover the three-month period ended October.
Other notable European releases Friday include French industrial output and nonfarm payrolls, as well as Italian industrial output numbers.
The North American session will feature two noteworthy releases, the first of which being the University of Michigan Consumer Sentiment Index for November. The preliminary reading is expected to come in at 100.7.
Energy traders will keep a close eye on the weekly Baker Hughes oil rig numbers. The weekly report is widely considered to be a proxy for the US shale industry.
EUR/USD
The euro regained momentum on Thursday, notching its highest level of the week as the dollar nosedived against a basket of world currencies. The EUR/USD exchange rate was last seen trading at 1.1649, where it was up 0.1% on the previous close. At the time of writing, the pair faces immediate support at 1.1620. The common currency is expected to remain well supported above this level. On the opposite side of the spectrum, immediate resistance is likely found at 1.1660.
GBP/USD
Cable also benefited from a weaker dollar on Thursday, where it climbed back toward the 1.3150 region. The pair was last seen trading at 1.3145, where it was little changed. A strong support level is located in the 1.2830 region. Resistance is found near the 55-day moving average of 1.3180.
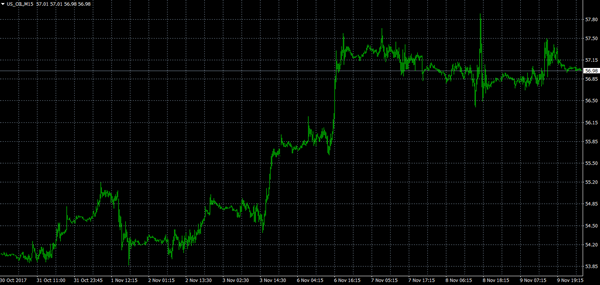
US OIL
After a massive bull rally, crude prices have moderated in recent sessions, with US barrels hovering just north of $57. The outlook on crude remains favourable, with the bulls looking to take out the 6 November settlement high of $57.35.
AUD/USD Candlesticks and Ichimoku Analysis
Weekly
• Last Candlesticks pattern: Long white candlestick
• Time of formation: 10 Jul 2017
• Trend bias: Up
Daily
• Last Candlesticks pattern: Long white candlestick
• Time of formation: 18 Jul 2017
• Trend bias: Up
Aussie has remained under pressure after recent anticipated selloff, adding credence to our bearish view that recent fall from 0.8125 top has resumed and downside bias remains for further weakness to 0.7600, then 0.7560-70, however, as this move is still viewed as retracement of early upmove, reckon downside would be limited to support at 0.7535-40 and 0.7500 would remain intact due to oversold condition, risk from there has increased for a rebound later.
On the upside, whilst initial recovery to 0.7730-35 cannot be ruled out, reckon the Kijun-Sen (now at 0.7761) would limit upside and bring another decline. A daily close above previous support at 0.7819 would defer and suggest low is possibly formed, bring a stronger rebound to indicated resistance at 0.7897, break there would abort and signal low is formed instead, bring further subsequent raise to 0.7915-20, then towards 0.7970-75, however, still reckon upside would be limited to 0.8000.
Recommendation: Sell again at 0.7760 for 0.7560 with stop above 0.7860
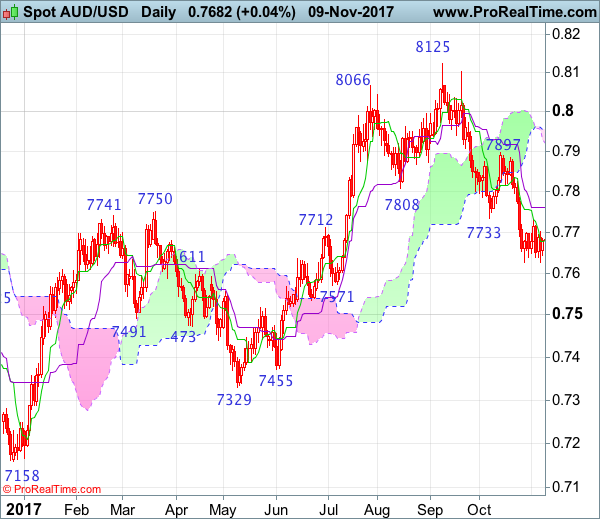
On the weekly chart, as assize’s anticipated fall from 0.8125 adds credence to our view that top has been formed there and price has remained weak, consolidation with downside bias remains for weakness to 0.7570-75, then towards support at 0.7535, however, near term oversold condition should limit downside to the lower Kumo (now at 0.7462) and reckon support at 0.7372 would hold from here.
On the upside, although initial recovery back to previous support at 0.7733 cannot be ruled out, reckon upside would be limited to 0.7830-35 and price should falter well below the Tenkan-Sen (now at 0.7864), bring another decline later. A weekly close above resistance at 0.7897 would abort and signal low is formed instead, bring a stronger rebound to 0.7950-60 and possibly towards 0.8000 but upside would still be limited and 0.8103 resistance should remain intact, bring another decline later.
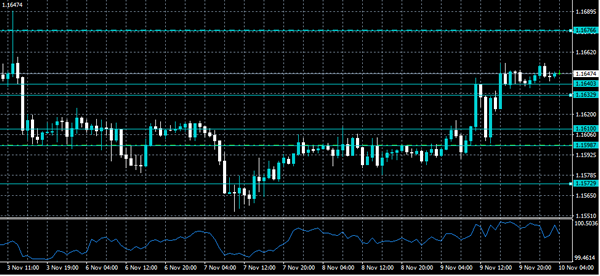
EURO Bullish Above 1.1640 Level
The euro has moved sharply higher against the U.S dollar, hitting 1.1654, following U.S Republican Senators decision to delay the U.S Corporate tax cut, until 2019. The EURUSD pair currently trades around the 1.1645 level, as the U.S dollar comes under severe selling pressure against a basket of major currencies. Going forward, the bearish intraday sentiment surrounding the U.S dollar index is likely to remain the dominate trading theme on Friday.
The EURUSD pair remains intraday bullish while trading above the key 1.1640 level. Further upside towards the 1.1676 and 1.1710 levels appears likely.
Should price action decline below the 1.1640 level, technical sellers should re-test the 1.1610 and 1.1598 levels.
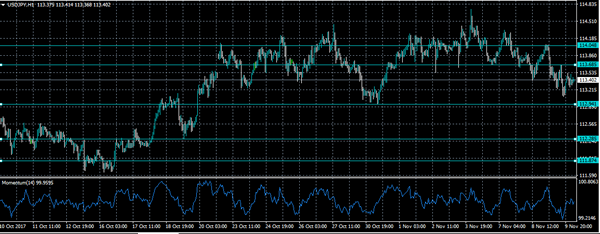
USDJPY Still Bearish Below 113.68
The U.S dollar remains under heavy selling pressure against the Japanese yen, hitting 113.06, following the delay of the proposed U.S corporate tax reforms, until 2019. The USDJPY pair has recovered back towards the 113.44 level, but remains weak, as risk-off trading sentiment send investors into the perceived safety of the Japanese yen. Foreign exchange traders now look to the European market open, and the key 94.00 technical support level on the U.S dollar index.
The USDJPY pair intraday bearish while trading below the 113.68 level. Further losses towards 112.94 and 112.28 remains likely.
Should sellers push-price above the 113.68 level for a sustained basis, the 114.04 technical level is likely to be re-tested.
US Dollar Turning Bearish Vs Japanese Yen
Key Highlights
- The US Dollar failed to settle above 114.50-115.00 levels against the Japanese Yen and moved down.
- It seems like the USD/JPY broke a major triangle support at 113.85 on the 4-hours chart.
- The US Wholesale Inventories in Sep 2017 increased 0.3%, just as the market expected.
- Today, the Michigan Consumer Sentiment Index (Prelim) for Nov 2017 will be released, which is forecasted to remain at 100.7.
USDJPY Technical Analysis
In the forex monthly November 2017, we discussed the importance of 115.00 for the US Dollar versus the Japanese Yen. The USD/JPY pair failed to move above 114.50-115.00 and started a downside move.
During the downside, the pair broke major triangle support at 113.85 on the 4-hours chart. The pair also broke the 61.8% Fib retracement level of the last wave from the 112.95 low to 114.73 high.
Therefore, there are chances of it extending declines in the near term towards the 113.00 level or 112.53. On the upside, the broken support near 113.80-114.00 would act as a resistance.
Above 114.00, the 114.50 and 115.00 levels are major barriers for buyers in the medium term.
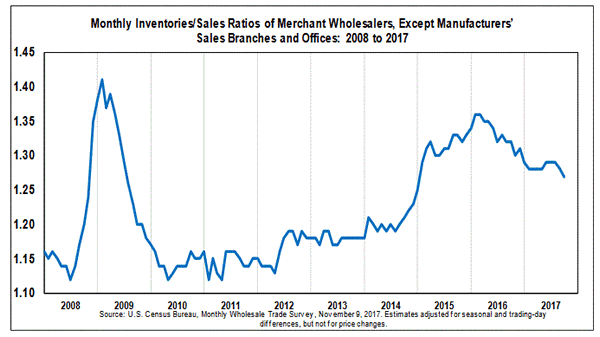
US Wholesale Inventories
Recently in the US, the Wholesale Inventories report for Sep 2017 was released by the US Census Bureau. The market was looking for the Wholesale Inventories to increase by 0.3% in Sep 2017 similar to the last +0.3%.
The actual result was in line with the forecast, as the Wholesale Inventories rose 0.3% to register $609.5 billion.
The report added:
September 2017 sales of merchant wholesalers, except manufacturers’ sales branches and offices, after adjustment for seasonal variations and trading-day differences but not for price changes, were $480.5 billion, up 1.3 percent (±0.4 percent) from the revised August level and were up 8.5 percent (±1.2 percent) from the September 2016 level.
To sum up, the short-term trend is now bearish for USD/JPY below 114.00 and the pair is poised for more losses.
Economic Releases to Watch Today
Italian Industrial Output for Sep 2017 (MoM) – Forecast -0.3%, versus+1.2% previous.
UK Industrial Production for Sep 2017 (MoM) – Forecast +0.3%, versus +0.2% previous.
UK Manufacturing Production for Sep 2017 (MoM) – Forecast +0.3%, versus +0.4% previous.
UK Trade Balance non-EU for Sep 2017 – Forecast £-4.500B, versus £-5.835B previous.
UK Goods Trade Balance for Sep 2017 – Forecast £-12.800B, versus £-14.245B previous.
Michigan Consumer Sentiment Index (Prelim) for Nov 2017 – Forecast 100.7, versus 100.7 previous.
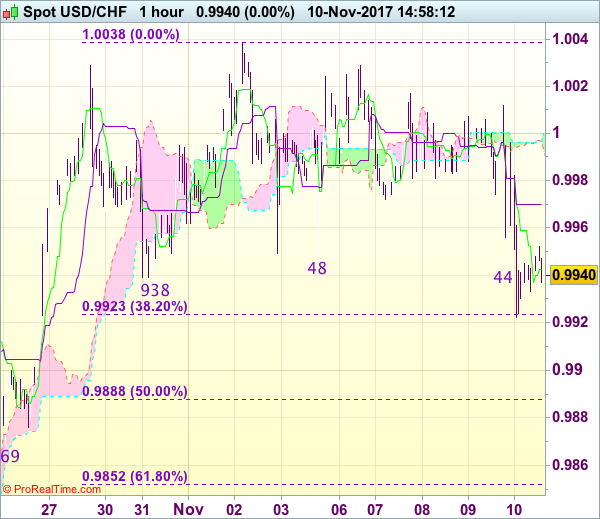
Trade Idea : USD/CHF – Stand aside
USD/CHF - 0.9954
Most recent candlesticks pattern : N/A
Trend : Up
Tenkan-Sen level : 0.9945
Kijun-Sen level : 0.9970
Ichimoku cloud top : 0.9994
Ichimoku cloud bottom : 1.0000
New strategy :
Stand aside
Position : -
Target : -
Stop : -
The greenback met renewed selling interest just below resistance at 1.0020, dampening our bullishness and further choppy trading below recent high at 1.0038 would take place and weakness to 0.9920-23 (38.2% Fibonacci retracement of 0.9737-1.0038) is likely, however, reckon downside would be limited to 0.9885-90 (50% Fibonacci retracement) and support at 0.9869 should remain intact, bring another upmove later.
As near term outlook is mixed, would be prudent to stand aside in the meantime. Above 0.9980 would bring rebound to 1.0000, then 1.0020 but only break of said resistance at 1.0038 would confirm the rise from 0.9421 low has resumed and extend further gain to 1.0050-55, then towards 1.0075-80 but price should falter below 1.0100 chart resistance.
It Is Time For Inflation In Norway Today
Market movers today
It is time for inflation in Norway today. Core inflation has surprised on the downside in recent months, due largely to unexpectedly low food prices on the back of fierce competition between supermarkets. The depreciat ion in the NOK last winter is beginning to have an impact on import prices at the border. In our view, this will gradually serve to push up imported inflation – and so also core inflation – but October might st ill be a little too early. On balance, we estimate that core inflation climbed to 1.1% y/y in October.
In the US, the University of Michigan is due to release preliminary consumer confidence for November. This rose to the highest level since 2004 in October, underlining the very upbeat sent imentamong US consumers. Consensus is for a further small increase but there may be some downside risk as rising gasoline prices may weigh a little on optimism.
The ECB's Yves Mersch is set to speak at the European Policy Forum in Windsor, England, at 13:30 CET.
Selected market news
Following last month's ECB decision to extend QE purchases for another nine months, financial markets have been remarkably calm. Volatility has been low and falling and investors have been looking towards carry st rategies in most markets. We wrote about this last week in Strategy - Low volatility favours ‘hunt for yield' but warning from IMF, 3 November. We argue that the ECB, Fed and Bank of Japan have created an environment where markets see a high central bank predictability in a situation where the macroeconomic out look looks increasingly stable. It creates a low volatility environment , which again pushes investors towards carry strategies and ‘risk' in all markets.
However, yesterday was a day of profit taking or second thoughts. In the European fixed income market we saw both Bund yields and periphery yields pushed higher. It is difficult to say what triggered the fixed income sell-off. A weak bond auct ion in Ireland could be one reason, in a situation where markets have rallied strongly since the latest ECB meeting but probably more important ly we saw a st ring of ECB speeches and comments. ECB member Benoît Coeuré said it is important that the eurozone states do not find t hemselves ‘unarmed' when t he next crisis hits and t hat loose monetary policy ‘won't last forever'. Also not eworthy was a Reuters ' interview last night with ECB member Philip R. Lane that argued that ECB could leave its ‘gradualist ' approach and act more ‘decisively' once inflat ion is on a clear path towards its goal.
Lane has a point but we doubt the market will suddenly change its expectations of eurozone monetary policy, simply because there are very few signs inflation and wage growth is picking up. In our view, inflation will not be ‘on a clear path towards it s goal' in 2018, so t he ‘hunt for carry' will soon return – volatility is st ill low and central bank predictability is st ill very high. What we saw yesterday was simply a hiccup or profit taking. In our view, it is st ill too early to position for the big ‘ECB sell-off'.
Global equity markets also came under pressure yesterday, probably for some of the same reasons as the fixed income market. Adding to the negative sentiment in the US markets was news regarding US tax reform, as the Senate revealed that its tax plan would delay lowering the corporate tax rate until 2019.
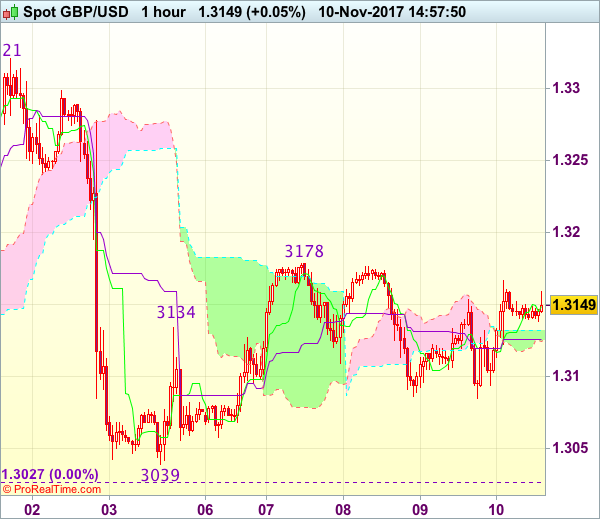
Trade Idea : GBP/USD – Sell again here
GBP/USD - 1.3140
Most recent candlesticks pattern : N/A
Trend : Near term down
Tenkan-Sen level : 1.3139
Kijun-Sen level : 1.3126
Ichimoku cloud top : 1.3132
Ichimoku cloud bottom : 1.3125
Original strategy :
Sold at 1.3175, stopped profit at 1.3155
Position : - Short at 1.3175
Target : -
Stop : - 1.3155
New strategy :
Sell at market level, Target: 1.3040, Stop: 1.3175
Position : -
Target : -
Stop : -
Although the British pound rebounded to 1.3166 yesterday and further choppy trading would be seen, as outlook remains consolidative, reckon upside would be limited and bring another decline, below 1.3085 would suggest the rebound from 1.3039 has ended, bring further fall to 1.3055-60, then retest of support at 1.3039. Looking ahead, only a drop below 1.3027 low would confirm early downtrend has resumed for weakness to psychological support at 1.3000, then towards 1.2970-75.
In view of this, we are looking to sell again here for such decline. Only above 1.3175-80 would abort and risk gain to 1.3200, break there would prolong choppy trading, bring a stronger rebound to 1.3235-40 first.