
Sample Category Title
Trade Idea : USD/CHF – Hold long entered at 0.9950
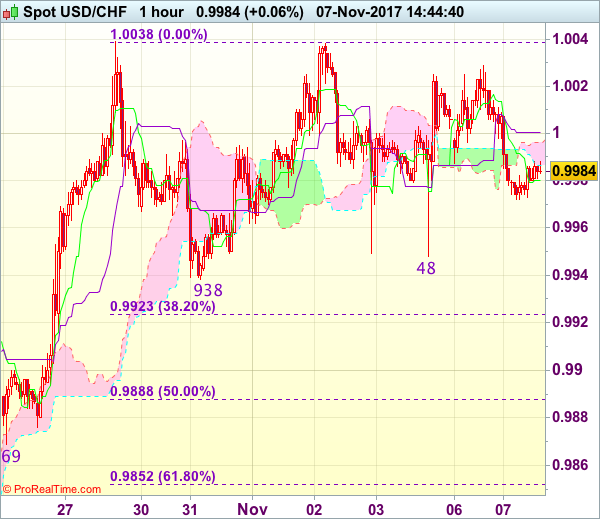
USD/CHF - 1.0003
Most recent candlesticks pattern : N/A
Trend : Up
Tenkan-Sen level : 0.9985
Kijun-Sen level : 1.0005
Ichimoku cloud top : 0.9996
Ichimoku cloud bottom : 0.9987
Original strategy :
Bought at 0.9950, Target: 1.0050, Stop: 0.9950
Position : - Long at 0.9950
Target : - 1.0050
Stop : - 0.9950
New strategy :
Hold long entered at 0.9950, Target: 1.0050, Stop: 0.9970
Position : - Long at 0.9950
Target : - 1.0050
Stop : - 0.9970
Although the greenback retreated after rising to 1.0029, reckon downside would be limited to 0.9970-75 and bullishness remains for recent rise to resume after consolidation, above said resistance at 1.0029 would bring retest of 1.0038, break there would confirm the rise from 0.9421 low has resumed and extend further gain to 1.0050-55, then towards 1.0075-80 but price should falter below 1.0100 chart resistance.
In view of this, we are holding on to our long position entered at 0.9950. Only below said support at 0.9938-48 would abort and signal top is formed instead, risk correction to 0.9920-23 (38.2% Fibonacci retracement of 0.9737-1.0038) but 0.9885-90 (50% Fibonacci retracement) should limit downside and support at 0.9869 would remain intact.
RBA: Don’t Rock The Boat Baby
RBA: Don't rock the boat baby
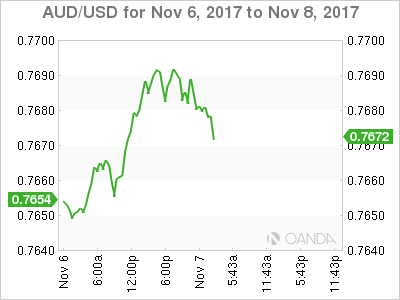
The RBA proved yet again to be one of more predictable G-10 Central Banks offering up standard fare of no rate cut with no serious attempt to adjust forward guidance. Given the growing ASX momentum lifted by gains in local miners on the back of surging commodity prices, the Aussie dollar bears may be better-served waiting for Fridays Statement of Monterey Policy. And specifically, the RBA's possibly revamped CPI projections given the tepid Q3 CPI data, which continues to track below the lower end of the RBA's 2-3 % inflation band. But to be honest anything other than the glass half full approach from theRBA would be a surprise at this stage. The Aussie initially moved higher because some thought the RBA would tack dovish, so bearish bets unwound
The Charge Of The Light Crude Brigade
Saudi's Arabia's 'purge' leads crude's geopolitical surge but traders should watch out of technical indicator cannon fire.
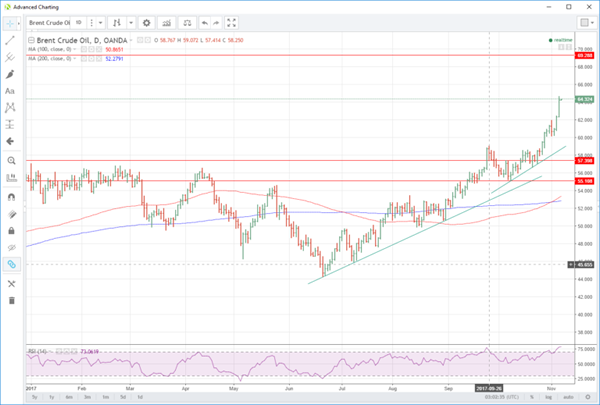
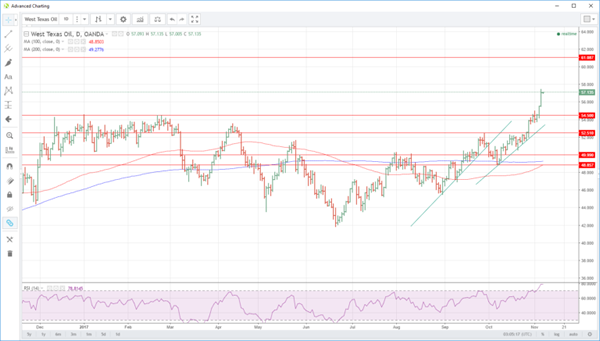
Oil's charge of the light crude brigade continued unabated overnight, with both Brent and WTI galloping 3.0% higher and even Natural Gas shaking of its multi-month lethargy, rising 3.50% in New York trading. Geopolitics continues to drive price surges, which is unsurprising when mainstream media use words such as 'purge' to describe the situation in Saudi Arabia.
Saudi Arabia's apparent purge aside, the rally comes against the backdrop of potential disruption of supplies in Iraqi Kurdistan, Libya and also forgotten in the noise, Venezuela. Venezuela appears to be nearing a default endgame at last with the country struggling with quality control issues of its already modest and declining exports. Much of Venezuela's production is destined for U.S. refineries, and this should be supportive for WTI even if the Saudi Arabia situation calms down.
With an OPEC and Non-OPEC production cut extension seemingly a done deal and Nigeria indicating its support, all would seem rosy for oil's short-term price momentum to continue. The original charge of the light brigade did not end well, however, and we continue to caution that the short-term technical indicators are now severely overbought on both contracts. Geopolitics can override these of course but like the original charge, the longer it went on, the uglier it became. In this case, crude could become vulnerable to an increasingly aggressive correction without some consolidation of the recent rallies.
Brent spot is trading unchanged at 64.25 this morning with initial resistance at the overnight high of 64.60. Its nearest long-term target at these levels remains the 69.00 regions. With oil running on vapours, support appears at 64.25 followed by a lot of clear air until the triple daily bottom at 60.00.
WTI spot is at 57.10, the overnight high at 57.40 being initial resistance, the bottom of a mid-2015 multimonth congestion zone that extends to 61.00 which is the next technical target. Support is at 55.50 followed by a series of multi-day lows around 53.60 and also today, the ascending trendline support that has held all pullbacks since the beginning of October. 53.60 is a critical support level with a break suggesting that the charge of the light crude brigade will be running into some severe cannon fire.
RBA Maintained Status Quo, Upbeat On Growth And Employment, Concerned Over Household Spending And Inflation
As widely anticipated, RBA left the cash rate unchanged at 1.5% in November. As we await Friday' Statement of Monetary Policy, policymakers revealed at today' statement that the macroeconomic guidance has stayed largely unchanged. In short, policymakers remained upbeat about the growth outlook, although they expressed concerns over household spending and soft inflation. Despite recent weakness in the Australian dollar, RBA reiterated the warning that higher exchange rate would lead to slower growth and inflation. Given the overall unchanged tone of the central bank, we retain the view that RBA would keep the policy rate unchanged at least until 1H18.
On the dovish side first, RBA pointed out that an ongoing source of uncertainty is the outlook for household consumption, due to slow growth in household incomes and high debt levels. Policymakers noted that growth in housing debt has continued to outpace that of household income. Policymakers also acknowledged the persistent weakness on both headline and core CPI.
Yet, policymakers were upbeat over the growth outlook, retaining the forecast is for GDP growth to “pick up and to average around +3% over the next few years. The optimism was driven by improvement in the business conditions and the increase in capacity utilization. They also noted that “the outlook for non-mining business investment has improved, with the forward-looking indicators being more positive than they have been for some time”. Meanwhile, the strong employment market also added to optimism. The central bank expected the unemployment rate to fall gradually from its current level of 5.5%. They, however, raised concerns of the subdued wage growth. On the housing market, the RBA noted that property prices eased further in Sydney, but continued to rise in Melbourne. Policymakers judged that additional supply of apartments over the coming years should help ease the conditions in the latter. Other cities have shown little change during the intermeeting period.
All in all, recent mixed macroeconomic data has not altered the central bank' stance. We expect to see similar forecasts at the upcoming Statement of Monetary Policy. We also retain the view that RBA would keep the policy rate unchanged at least until 1H18.
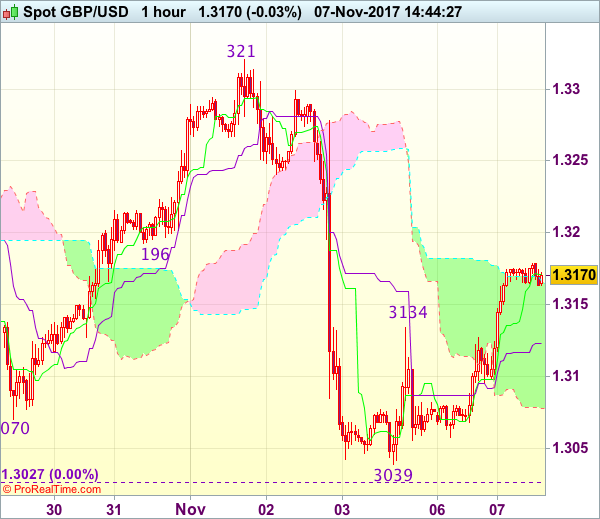
Trade Idea : GBP/USD – Hold short entered at 1.3175
GBP/USD - 1.3154
Most recent candlesticks pattern : N/A
Trend : Near term down
Tenkan-Sen level : 1.3164
Kijun-Sen level : 1.3123
Ichimoku cloud top : 1.3164
Ichimoku cloud bottom : 1.3078
Original strategy :
Sold at 1.3175, Target: 1.3045, Stop: 1.3210
Position : - Short at 1.3175
Target : - 1.3045
Stop : - 1.3210
New strategy :
Hold short entered at 1.3175, Target: 1.3045, Stop: 1.3210
Position : - Short at 1.3175
Target : - 1.3045
Stop : - 1.3210
Although cable staged another strong rebound since yesterday, as this move from 1.3039 is viewed as retracement of last week’s selloff, reckon upside would be limited and mild downside bias remains for test of the Kijun-Sen (now at 1.3123), break there would suggest an intra-day top is formed, bring weakness to 1.3095-00 but below 1.3065-70 is needed to signal the rebound from 1.3039 has ended and bring retest of recent low at 1.3027. Looking ahead, only a drop below this level would confirm early downtrend has resumed for weakness to psychological support at 1.3000, then towards 1.2970-75.
In view of this, we are holding on to our short position entered at 1.3175. Above 1.3175-80 would risk gain to 1.3200, break there would defer and prolong choppy trading, risk a stronger rebound to 1.3235-40 first.
Fed Chairman Janet Yellen Will Speak At An Event
Market movers today
Euro-area retail sales are expected to rebound in September after a 0.5% drop in August; consumer confidence is at the highest level in 20 years pointing to continued robust consumption.
Chinese FX reserves are due today but no time of the release has been announced. The reserves are expected to be broadly flat and have not attracted much attention since capital out flows stabilised again in spring 2016.
Tonight, Fed Chairman Janet Yellen will speak at an event where she will be given an Award for Ethics in Government. However, we do not expect her to say anything about the monetary policy out look in her speech, and indeed as she steps down in February, her speeches are getting less important by the day.
The US House of Representatives' tax-writing committee continues to work on a tax reform with a proposal possibly due by the end of the week, but markets will stay alert to progress on this issue to sense how wide raging it will be.
US President Trump arriving in Seoul, South Korea, could put focus back on geopolitical tensions with North Korea.
It is time for Norwegian industrial production. More on Scandi markets, page 2.
Selected market news
Risk appetite remains decent with notably energy stocks lifted by a continued uptick in oil prices with the price on Brent crude topping USD64/bbl. The main driver behind the most recent oil spike seems to be rising tensions around Iran's missile programme with UAE and Bahrain yesterday backing Saudi Arabia in saying that tackling the programme is an urgent priority. The ongoing purge launched by the Saudi Crown Prince bin Salman also seemingly continued to provide support to oil supply worries. Separately, the prospect of a Broadcom- Qualcomm tie-up also helped to lift notably tech stocks. US yields edged lower during the day led by the long end of the curve with the 10Y Treasury yield firmly below 2.35% again. Separately, Fed's Vice Chair Dudley announced that he will retire in mid-2018, which is somewhat earlier than expected, heightening uncertainty with respect to Fed policy .
Overnight, the Reserve Bank of Australia (RBA) as expected kept its cash target rate unchanged at 1.50%. The RBA noted that investment is picking up outside of mining but issued worries over household consumption, which remains low due to still subdued wage growth. Also this morning, data on Japanese wages for September was released, showing overall wage growth at 0.9% y/y. Although up from a (revised lower) 0.7% last time, the details showed that this is due mainly to part -time workers seeing salary increases. This limits the impact on inflationary pressure more broadly and in our view means there is still a long way before the Bank of Japan will see the overshoot of its inflation target it was again stressing its devotion to earlier this week. USD/JPY is slightly higher.
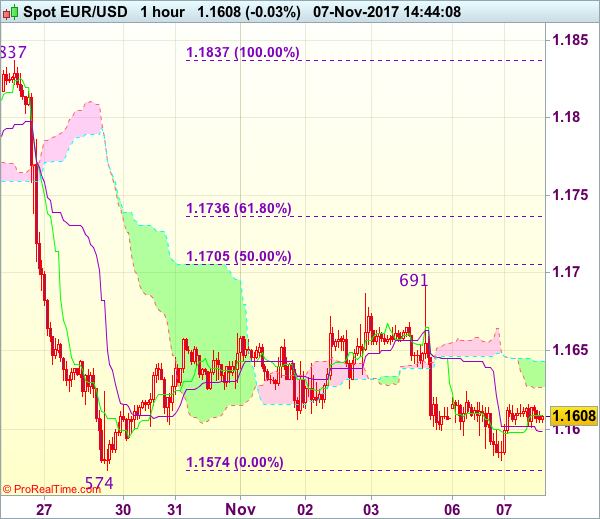
Trade Idea : EUR/USD – Hold short entered at 1.1620
EUR/USD - 1.1599
Most recent candlesticks pattern : N/A
Trend : Down
Tenkan-Sen level : 1.1606
Kijun-Sen level : 1.1599
Ichimoku cloud top : 1.1644
Ichimoku cloud bottom : 1.1627
Original strategy :
Sold at 1.1620, Target: 1.1520, Stop: 1.1655
Position : - Short at 1.1620
Target : - 1.1520
Stop : - 1.1655
New strategy :
Hold short entered at 1.1620, Target: 1.1520, Stop: 1.1645
Position : - Short at 1.1620
Target : - 1.1520
Stop : - 1.1645
As the single currency recovered after finding support at 1.1580, minor consolidation would be seen, however, reckon upside would be limited to the lower Kumo (now at 1.1627) and bring another decline later to 1.1574-80, break there would extend recent decline to 1.1520-25, then 1.1500 but near term oversold condition should prevent sharp fall below latter level.
In view of this, we are holding on to our short position entered at 1.1620. Above the upper Kumo (now at 1.1644) would risk another bounce towards 1.1691, however, only break there would abort and suggest further choppy trading above 1.1574 would be seen, bring a stronger rebound to 1.1700-05 but upside should be limited to previous support at 1.1725 (now resistance).
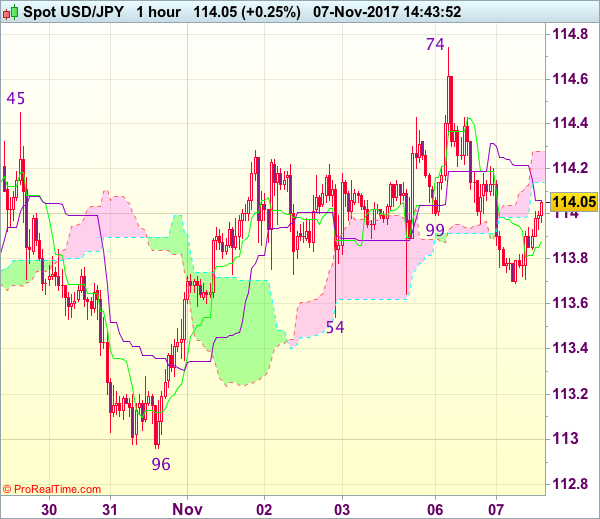
Trade Idea : USD/JPY – Hold long entered at 113.85
USD/JPY - 114.05
Most recent candlesticks pattern : N/A
Trend : Near term up
Tenkan-Sen level : 113.88
Kijun-Sen level : 114.06
Ichimoku cloud top : 114.28
Ichimoku cloud bottom : 114.14
Original strategy :
Bought at 113.85, Target: 114.85, Stop: 113.50
Position : - Long at 113.85
Target : - 114.85
Stop : - 113.50
New strategy :
Hold long entered at 113.85, Target: 114.85, Stop: 113.65
Position : - Long at 113.85
Target : - 114.85
Stop : - 113.65
Although the greenback retreated after rising to 114.74 yesterday, as dollar found support at 113.69 and has rebounded, retaining our bullishness and consolidation with upside bias remains for gain to 114.40-45, however, break of said resistance at 114.74 is needed to confirm recent upmove from 107.32 low has resumed and extend gain to 115.00 but overbought condition should limit upside to another previous resistance at 115.51.
In view of this, we are holding on to our long position entered at 113.85. Only below support at 113.54 would abort and prolong consolidation, risk weakness to 113.20-25, however, reckon support at 112.96 would remain intact, bring another rise later.
EUR/USD Candlesticks and Ichimoku Analysis
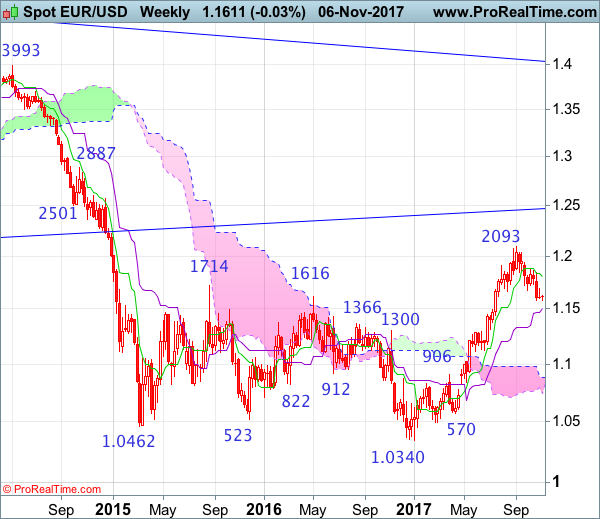
Weekly
• Last Candlesticks pattern: Shooting star
• Time of formation: 31 Jul 2017
• Trend bias: Near term up
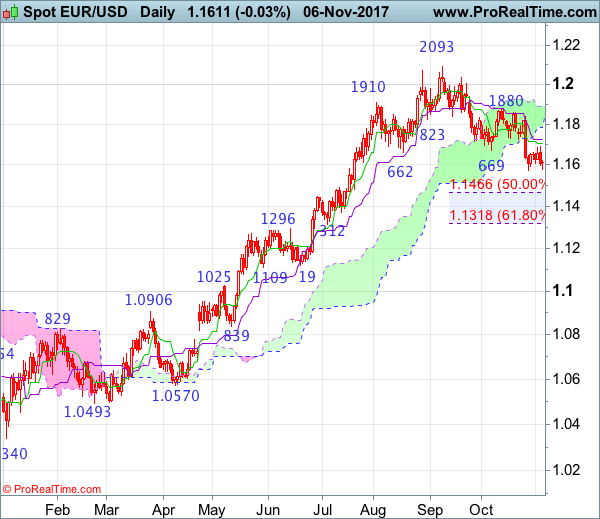
Daily
• Last Candlesticks pattern: Shooting star
• Time of formation: 2 Aug 2017
• Trend bias: Up
EUR/USD – 1.1605
As the single currency has remained under pressure, adding credence to our bearish view that the fall from 1.2093 top is still in progress, hence downside bias remains for the erratic fall from there to bring retracement of early upmove to 1.1550, then 1.1500, however, near term oversold condition should limit downside to 1.1465-66 (50% Fibonacci retracement of 1.0839-1.2093) and reckon 1.1370 support would hold and price should stay above 1.1312-18 (previous support and 61.8% Fibonacci retracement).
On the upside, whilst an initial recovery to 1.1660-70 cannot be ruled out, reckon the Tenkan-Sen (now at 1.1706) would limit upside and price should falter below 1.1725 (previous minor support), bring another decline to aforesaid downside targets. A daily close above the Kijun-Sen (now at 1.1727) would defer and suggest low is possibly formed instead, risk rebound to 1.1790-00, then test of resistance at 1.1837 but break there is needed to add credence to this view, bring another bounce to indicated previous resistance at 1.1880 first.
Recommendation: Sell at 1.1700 for 1.1500 with stop above 1.1800.
On the weekly chart, as euro’s retreat from 1.2093 has kept price under near term pressure, retaining our view that further consolidation below this level would be seen and mild downside bias remains for a retracement of recent rise to 1.1500, then 1.1466 (50% Fibonacci retracement of 1.0839-1.2093), however, reckon downside would be limited to 1.1400 and reckon 1.1312-18 (previous support and 61.8% Fibonacci retracement) would hold, price should stay above previous minor resistance at 1.1296, bring rebound later.
On the upside, expect recovery to be limited to 1.1650-60 and renewed selling interest should emerge around (1.1700-10), bring another decline later. Above 1.1790-00 would risk test of said resistance at 1.1837 but only break of this last week’s high would abort and suggest low is formed instead, bring test of resistance at 1.1880 first. Only a break of 1.1880 would suggest the pullback from 1.2093 top has possibly ended and extend gain to 1.1935-40, then towards 1.2035-40. Having said that, break there is needed to provide confirmation, bring retest of 1.2093.
Aussie Dollar To Consolidate Before Next Move?
Key Highlights
- The Aussie Dollar struggled recently and traded towards 0.7620-0.7600 against the US Dollar.
- There is a key bearish trend line forming with resistance at 0.7695 on the 4-hours chart of AUD/USD.
- Australia’s HIA/AiG Performance of Construction Index in Oct 2017 declined from the last reading of 54.7 to 53.2.
- Today in the US, the IBD/TIPP Economic Optimism Index for Nov 2017 will be released, which is forecasted to increase from 50.3 to 51.2.
AUDUSD Technical Analysis
The Aussie Dollar struggled a lot during the past few weeks and settled below 0.7700 against the US Dollar. The AUD/USD pair is currently recovering, but facing a major hurdle near 0.7695.
The pair recently formed a swing low at 0.7639 and started an upside move. It faces many resistances on the way up such as 0.7690 and 0.7700. There is also a key bearish trend line forming with resistance at 0.7695 on the 4-hours chart.
The trend line resistance is close to the 61.8% Fib retracement level of the last drop from the 0.7730 high to 0.7639 low.
Above 0.7690, the 0.7700 and 0.7715 levels are also important hurdles for buyers. A proper close above 0.7700 would only lift the market sentiment for AUD/USD.
On the other hand, the 0.7630-20 area is an important support, which must hold to contain further losses in the near term.
Australia’s HIA/AiG Performance of Construction Index
Today in Australia, the the HIA/AiG Performance of Construction Index for Oct 2017 was released by the Australian Industry Group and the Housing Industry Association. The market was looking for no major change from the last reading of 54.7.
The actual was a bit lower as there was a decline in the HIA/AiG Performance of Construction Index from 54.7 to 53.2 in Oct 2017. The best performing area was the engineering construction.
The report added:
The activity sub-index in the Australian PCI® registered 52.9 points in October. This was up by 0.3 points from September, signalling a marginal increase in the pace of overall industry growth.
Overall, the AUD/USD pair is likely to continue trading in a range below 0.7700 before the next move.
Economic Releases to Watch Today
Germany’s Industrial Production for Sep 2017 (MoM) – Forecast -0.8%, versus +2.6% previous.
UK Halifax House Price Index for Oct 2017 (MoM) – Forecast 0.2%, versus 0.8% previous.
UK Halifax House Price Index for Oct 2017 (3m/YoY) – Forecast +4.2%, versus +4% previous.
Euro Zone Retail Sales for Sep 2017 (YoY) – Forecast +3.1%, versus +1.2% previous.
Euro Zone Retail Sales for Sep 2017 (MoM) – Forecast +0.6%, versus -0.5% previous.
US IBD/TIPP Economic Optimism Index for Oct 2017 (MoM) – Forecast 54.2, versus 53.4 previous.