Sample Category Title
EUR/USD Analysis: Soars Amid Powell Pick
The US President Donald Trump named Governor Powell as the new Fed Chair yesterday. However, markets showed little response to this decision, as it was widely expected. The news that actually moved the currency rate was disclosure of some details of the new tax reform. From technical point of view, the weakening of the buck resulted in formation of a junior ascending channel. However, the exchange rate is likely to fail to surge to its upper boundary, as that path is blocked by a combination of the weekly PP at 1.1674 and the falling 200-hour SMA near 1.1682. The likelihood of a rebound is also supported on daily chart where the pair additionally faces the 23.6% Fibonacci retracement level at 1.1679. Plus the average market sentiment remains 59% bearish.
EUR/USD: US Non-Farm Productivity
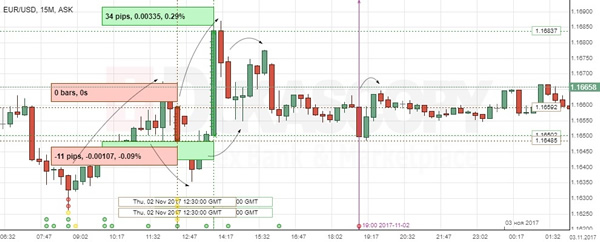
The Euro edged lower against the American counterpart on the US reports showing an increase in non-farm productivity. Then, the release of details about the Trump's tax reform strengthened the EUR/USD pair, where the Greenback lost 0.29% or 34 base points against the Euro, but continued a side move at the 1.1660 level. In addition, the reaction on the announcement of the Fed nominee was muted, when it matched expectations for Jerome Powell to be the next chairman.
The Labour Department said that the US worker productivity grew 3.0% year-on-year in the Q3, the fastest growth pace in nearly three years, which fuelled diminishing of labour costs. But, data pointed to the US growth to be sustained, keeping the chances for the Fed rate hike.
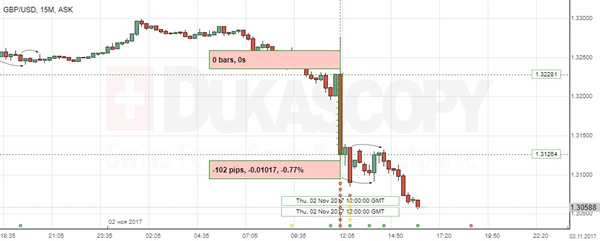
GBP/USD: BoE Interest Rate Decision
The British Pound plummeted sharply against the Greenback, as the Bank of England announced changes in its monetary policy. Data hurt the GBP/USD currency pair, putting the rate 0.77% or 102 base points down to the 1.312 mark, close to the monthly low.
The Bank of England raised interest rates from 0.25% to 0.50% for the first time in ten year, adding that further increases would be determined by the outcome of Brexit negotiations and how the country prepares to quit the European Union. Britain's economic expansion slowed markedly since the Brexit vote, the factor delaying the rate hike, but the BoE Governor Mark Carney feared that Brexit could aggravate already weak productivity and make the economy prone to high inflation.
USDCAD Is Neutral In Short Run, Immediate Risk Tilted To Downside
USDCAD is neutral in the short term after a recent rally lost steam at a high of 1.2916. The underlying downtrend from 1.3793 is weaker after the strong rebound but the pair still remains under the 200-day moving average, keeping the bearish market structure still in place.
The short-term technicals are neutral and suggest the rally is exhausted. RSI reached into overbought levels above 70.
USDCAD is expected to consolidate in the near-term unless it can break above the 50% Fibonacci retracement level of the downleg from 1.3793 to 1.2061. Rising above this 1.2924 level would bring the 200-day MA into sight. This is an important barrier as it converges upon the 1.3000 psychological level. Clearing this key resistance would put USDCAD on the path to re-test the 1.3793 peak and change the outlook to bullish.
To the downside, soft support is expected at last week's low of 1.2780. Below this, the 1.2500 level is another support (close to the 23.6% Fibonacci). A break below this support zone would turn the focus to the 1.2061 more than two-year low to strengthen the bearish bias, with a high probability of resuming the broader downtrend.
In the short run, USDCAD is expected to remain capped under 1.2916, with immediate risk tilted to the downside
GBPJPY Short-Term Bearish Bias, Scope For Extension Lower
GBPJPY does not have a clear trend since rising to a high of 152.85, subsequently consolidating gains in a broad 147 – 152 range.
On the short-term time frame, the pair is neutral to bearish, pausing a decline after rallying to the upper end of the range near 152 and dropping sharply to break below the 200-period moving average. RSI reached near oversold levels, suggesting the decline in the market has been exhausted.
Prices are expected to consolidate in a very tight range just under the 149 level in the near term, with immediate risk tilted to the downside for a move towards 147. This is expected to be an important support level since it is the 50% Fibonacci retracement level of the upleg from 141.34 to 152.85. From this point, there is scope for an extension lower towards the 144 area.
A break back above 149 is needed to shift focus to the upside for a push towards the upper end of the range at 152, bringing the 152.85 peak into sight. At this stage the odds are high for a resumption of the uptrend that started off the 140 handle.
For now, the short-term bias is bearish but downward momentum has eased, pointing to more consolidation during the next few sessions.
Dollar Little Changed Ahead Of Jobs Report, Aussie Loses Ground On Weak Retail Sales
As Asian traders were completing this week's trading, the dollar was not much changed relative to most major counterparts with investors' attention falling to the US jobs report due at 1230 GMT.
At 0818 GMT, the dollar's index against a basket of currencies was 0.1% higher, trading at 94.79. It yesterday fell to a one-week low of 94.41, perhaps on uncertainty related to US tax reform. Euro/dollar was 0.1% lower and not far below 1.1650. Dollar/yen was flat, a few pips above the 114 handle. Japanese markets were closed today for Culture Day.
President Trump yesterday announced that current Fed Board of Governors member Jerome Powell is his pick to lead the Federal Reserve when Janet Yellen's term expires in February. Given what preceded, this was already priced in by the markets -at least for the most part- and reaction in the forex markets was subdued upon the news.
Forecasts are for US nonfarm payrolls to have increased by 310k in October, a vast difference to September's decline by 33k. However, just as last month's fall was attributed to hurricane-related disruptions, October's rise will in large part be coming from the recovery efforts following the extreme natural phenomena hitting US soil. Having this in mind, market participants are, similar to the previous month's report, likely to focus on wage growth rather than the number of positions added to the economy. Expectations are for average earnings to increase by 0.2% m/m and 2.7% y/y, slowing down from September's 0.5% and 2.9% respectively.
Pound/dollar was last 0.1% lower, trading close a near one-month low of 1.3037 hit earlier in the day. Euro/pound was more or less unchanged relative to yesterday's close, trading around 0.8925. Sterling yesterday recorded heavy losses (in excess of 1%) relative to both currencies following what markets interpreted as a “dovish hike” by the Bank of England.
The Australian dollar recorded losses versus its US counterpart after September retail sales surprised to the downside (0.0% growth Vs expectations of 0.4%). Aussie/dollar was last 0.5% lower at 0.7973. Kiwi/dollar was up by 0.1% at 0.6919, rising for the third straight day and further distancing itself from last week's multi-month low of 0.6816.
In commodities, gold was 0.1% lower at $1,275.44 an ounce. WTI and Brent crude were 0.5% and 0.4% higher at $54.81 and $60.85 a barrel, trading near multi-month highs. The US Baker Hughes oil rig count will be released at 1700 GMT.
Canadian employment data will be released at 1230 GMT. Other important data out of the US will pertain to September's factory orders as well as October's ISM non-manufacturing PMI (both due at 1400 GMT). Minneapolis Fed President and FOMC voting member Neel Kashkari is scheduled to participate in a Q&A session at 1615 GMT.
Daily Wave Analysis: US Dollar Builds Key Patterns Before NFP Event
Currency pair EUR/USD
Important data is being announced in the US today. The NFP figures and the unemployment rate will indicate how well the employment market is doing in the current economic environment.
EUR/USD is still building a bullish retracement within wave 4 (blue). A break below the support of the sideways zone (green) could indicate the continuation of the wave 5 (blue) within a larger wave C (purple). A break above the 61.8% Fib makes a wave 4 (blue) less likely.
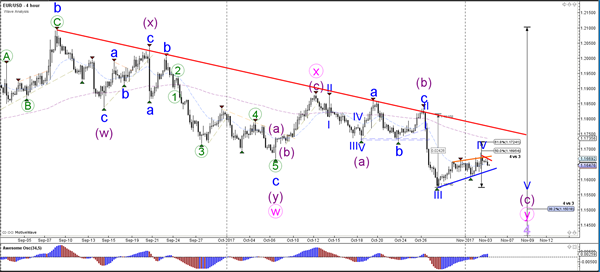
The EUR/USD will most likely complete the wave 4 (blue) if price breaks below the channel (blue). In the meantime, price could retrace to deeper Fibonacci levels of wave 4 (blue) but typically should not break above the 61.8% Fibonacci level.
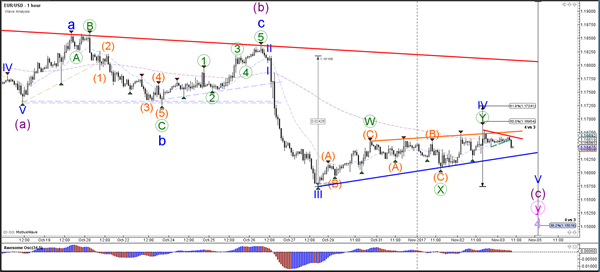
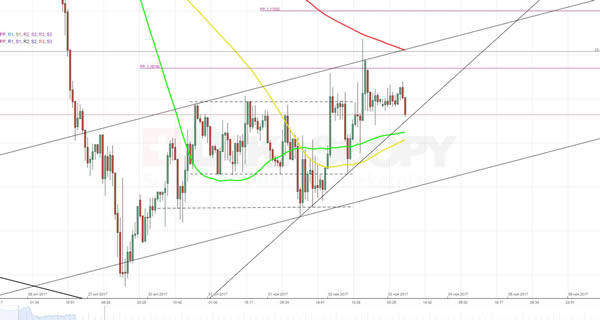
Currency pair GBP/USD
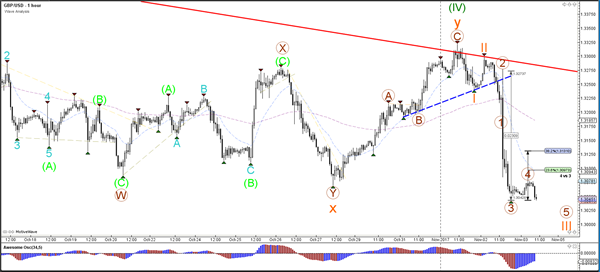
The GBP/USD broke the support trend lines (dotted blue) after strong bearish momentum occurred during the Bank of England rate decision. The bearish turn makes the wave 4 (green) correction more likely now and a wave 5 (green) breakout could occur soon or later this month.
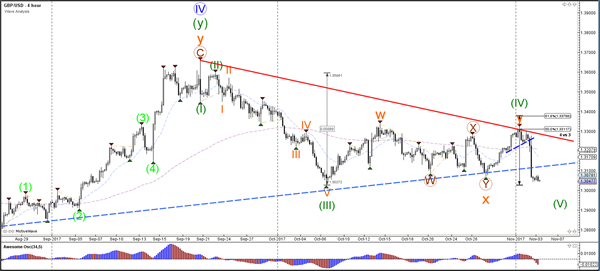
The GBP/USD is showing strong bearish momentum and could be in a wave 4 (blue) of a larger wave 3 (orange).
Currency pair USD/JPY
The USD/JPY sideways pattern is most likely indicating that one more bullish push is likely towards the 115-resistance level.
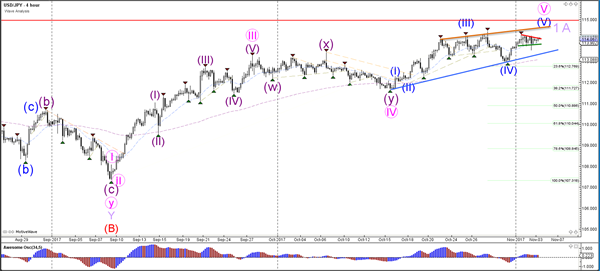
The USD/JPY needs to break above the resistance trend line (red) to continue towards the Fibonacci targets at 114.50-115.

Crude Continues To Fly High Ignoring The RSI
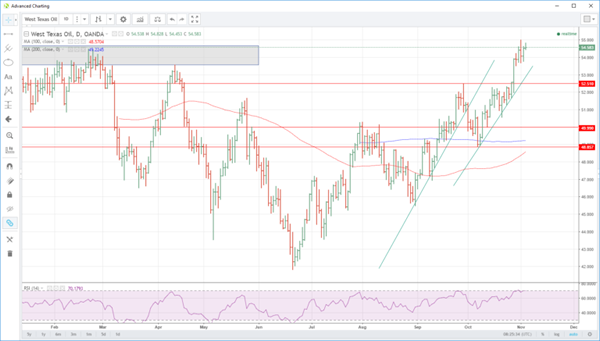
A Tokyo holiday has meant a quiet session in Asia for crude oil as it ignores overbought technical indicators.
Crude oil meandered higher in a subdued session overnight as the market awaits key U.S. employment data this afternoon. Oil was supported by rhetoric from Saudi Arabia and Iraq that OPEC compliance had been pleasing and that they supported an extension of the production cut agreement through to December 2018. Venezuela's announcement that it was attempting to restructure all of its foreign debt should continue to be price supportive as well as its almost inevitable default looms ever closer. This may cause supply disruptions from the South American country further tightening supplies.
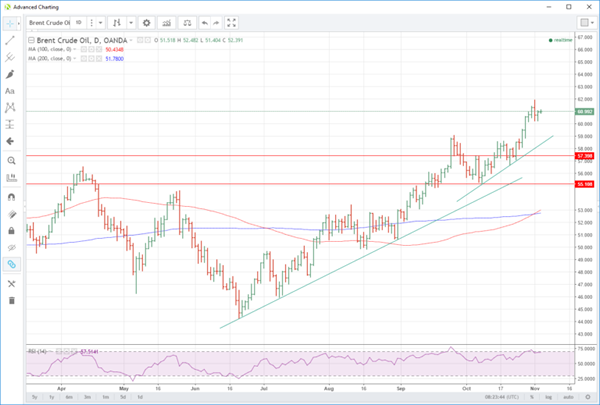
We continue to advise caution, however. Although both Brent and WTI look constructive on the charts, the RSI's on both are at very overbought levels. This short-term indicator suggests that despite the confidence in the market, they could be vulnerable to a near-term downside correction. Possibly quite an aggressive one.
Brent Crude climbed 35 cents to close at 60.95 in New York, rising a further 15 cents to 61.10 in early Asia. Brent has a well denoted triple bottom at 60.20 which should form strong support initially. Below this, we see 60.00 and then 59.00 as the next supports. Resistance is at 62.00 with little on the charts beyond there. We assume that more selling will appear at the 63.00 area.
WTI spot climbed 50 cents to close at 54.55 in New York as U.S. exports hit record highs and have drifted 10 cents higher to 54.65 in early Asian trading. WTI has a congestion zone of a series of daily lows between 53.50 and 53.70 that will lend reasonable support initially. Below here lies the daily uptrend support line at 52.90 with a break opening a drop to 52.00. Resistance is at 55.00 with a break clearing the path to the 56.50 regions.
Gold And Silver Trying To Avoid Buying The (Non) Farm
Gold and Silver continue attempting to base as a Tokyo holiday squashes Asian volatility ahead of tonights crucial U.S. employment data.
The aviation days of my youth featured some colourful sayings from the Air Force flight line. One of them being 'try not to buy the farm today Office Cadet Halley.' This was a charming way of saying, don't make a smoking hole in a farmers field with the government's very expensive aeroplane, we have just signed you off in to do solo aerobatics. To this day I am not sure whether my instructor was more concerned about losing the aeroplane or me, but both Gold and Silver are attempting to avoid the same fate today. This time in the shape of the Non-Farm Payrolls where a good number could see dollar strength and result in gold and silver 'buying the farm.'
Gold
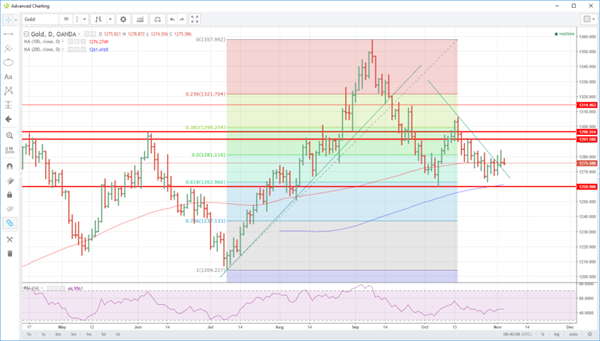
Gold spiked to 1284.00 overnight as Jerome Powell was confirmed as the new Federal Reserve Chairman. The gains were short-lived though, and gold gave all of the gains back to close one dollar higher at 1276.00.
Nevertheless, gold has continued to make a series of higher lows on a daily basis as it has remained bid in Asia this week, driven by Chinese retail buying. With the Shanghai Gold Exchange arbitrage clearly at attractive levels on this interest, this has ensured that the price action in gold remains constructive from a technical perspective.
Gold closed at its 100-day moving average and initial support of 1276.00 in New York and had climbed $1.50 in early Asia trading to 1277.50, most likely on more Chinese retail buying interest. Below this, support appears at 1273.00 followed by 1263.50, the 200-day moving average at 1261.40 and then the critical 1260.00 level. This is also near to the 61.80 Fibonacci retracements with the converging of all these technical factors in one area underlining this region's importance. Resistance is at the overnight high of 1284.00 followed by the double top at 1291.50.
Gold's fate into the next week will be decided by the U.S. Non-Farm Payroll data tonight with the street expecting a monster 315,000 increase. Meeting expectations could see the dollar strengthen possibly nipping gold's recovery in the bud. Conversely, a significant miss to the downside should be supportive of gold as the dollar weakens.
Silver
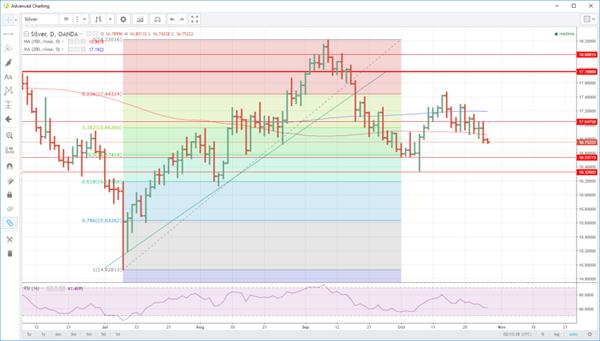
Silver continues to lead gold to the upside having traded more positively over the past couple of weeks. Overall it's corrective sell-off has been much more shallow than golds. It has been attempting to base again in its long-term Fibonacci retracement box between the 38.2 and 50.0% levels whose boundaries are 16.9550 and 16.1750.
Overnight silver managed to consolidate further its gains from Wednesday, finishing unchanged at 17.0500. Today's session has been somewhat moribund with Tokyo on holiday meaning that Silver remains almost unchanged at 17.0450. We expect volatility to pick up as the Non-Farm data draws nearer in the New York session.
Silver is flirting with its 200-day moving average and initial resistance at 17.1915 which is followed by a double top at 17.2950 and then October's high of 17.4750. Nearby support is at yesterdays low of 17.0340. A break of this level implies a deeper correction to its 100-day moving average at 19.8700 and p[ossibly as far as the 16.6000 could be on the cards.
Forex Technical Analysis: EUR/USD, USD/JPY, GBP/USD
EUR/USD
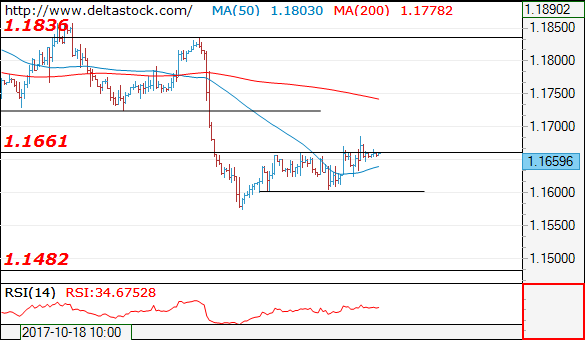
Current level - 1.1659
Still no sign of a reversal and the upmove from 1.1570 is intact, imposing a risk of a brief spike to 1.1720. Trigger on the downside is 1.1600 and a violation of that low will signal, that the expected sell-off is underway, towards 1.1480.
| Resistance | Support | ||
| intraday | intraweek | intraday | intraweek |
| 1.1660 | 1.1840 | 1.1600 | 1.1480 |
| 1.1720 | 1.1940 | 1.1480 | 1.1300 |
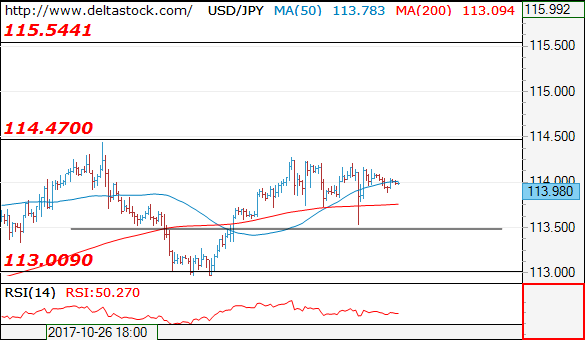
USD/JPY
Current level - 113.98
My outlook is already bullish, for a break through 114.50, towards 115.50 zone. Initial intraday support lies at 113.50.
| Resistance | Support | ||
| intraday | intraweek | intraday | intraweek |
| 114.50 | 114.50 | 113.50 | 111.00 |
| 114.50 | 115.50 | 113.05 | 107.30 |
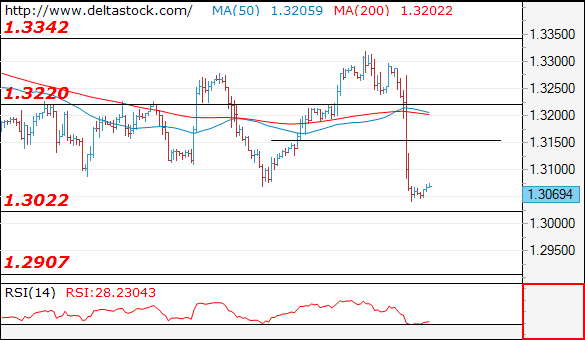
GBP/USD
Current level - 1.3069
The furious sell-off after MPC meeting broke through 1.3220 support, dashing all the way down to 1.3020 lows, thus showing, that a large scale move is underway, towards 1.2760. Current rebound shouldbe considered corrective, preceding a slide towards 1.2910. Initial intraday resistance lies at 1.3080, followed by 1.3150.
| Resistance | Support | ||
| intraday | intraweek | intraday | intraweek |
| 1.3080 | 1.3220 | 1.3020 | 1.3020 |
| 1.3150 | 1.3340 | 1.2910 | 1.2760 |