Sample Category Title
US Labour Market Report For October Is Due Out
Market movers today
In the US, the labour market report for October is due out . We estimate employment growth in October was 300,000, as other indicators have shown the labour market has recovered following the hurricanes. Note the very strong wage growth of 0.5% m/m in September was due partly to compositional effects, as the ‘leisure and hospitality' sector (typically low wage growth jobs) was the sector most severely hit by the hurricanes. This could potentially have added up to 0.1pp to wage growth and we expect this effect was reversed in October. Hence, we expect a correction, now people have returned to their jobs, so we think wages rose 0.1% m/m in October.
In the UK, PMI services for October will give us more information about economic growth at the beginning of Q4. We estimate the index was more or less unchanged at 53.6 but see risks skewed on the downside as the index is a bit higher than suggested by the most recent business confidence indicators.
In Norway, house price data are due out today (see overleaf).
Selected market news
Asian shares and US equities were mixed after yesterday's announcement of the House Republican's tax plan in the US. The plan was in line with details leaked earlier. The tax plan costs USD1,500bn (in line with what the Republicans have made room for in the budget ), implying higher government deficits and public debt if passed. It means there is little room for disagreement on changes to tax revenues/cuts. House Republicans hope to pass the plan quickly so it can move to the Senate later this month. Senate Republicans are working on their own tax plan, which they hope to unveil next week. The aim is still to have tax reform done by year-end, which is probably a bit optimistic (for more detail see POLITICO). The USD has weakened and Asian currencies were generally stronger overnight, as traders are sceptical the tax plan will pass in its current form without being watered down.
Furthermore, yesterday Donald Trump nominated Jerome Powell (current Fed governor) as the next Fed chair. He is still subject to Senate approval (simple majority) but we think this will happen relatively easily – this is also the signal Senate majority leader Mitch McConnell has sent . Powell is considered a centrist in terms of his views on monetary policy stance (much like current Fed chair Janet Yellen) and will therefore most likely continue the current monetary policy strategy of hiking Fed rates gradually. Also Mr Powell may be more dovish on financial sector regulation, in line with Trump's wish and the new Fed vice chair for supervision Randal K. Quarles.
Yesterday, the Bank of England (BoE) raised the Bank Rate by 25bp from 0.25% to 0.50%, with the vote count 7-2 in line with our expectation but against consensus of a 6-3 vote count (see Bank of England Review: BoE keeps its flexibility on further rate hikes, 2 November). The BoE has stopped commenting on current market pricing (two hikes over three years), maintaining its flexibility on further rate hikes. Overall, the signal is neutral, which was more dovish than expected by the market but in line with our expectation. We believe the BoE will stay on hold in 2018 and not hike again before 2019, while the market is more hawkish, expect ing the next hike in November 2018.
Yesterday, it was announcd Danish foreign reserves remained DKK464bn in October. This is the seventh month in a row that Danmarks Nationalbank refrained from intervening in the FX market
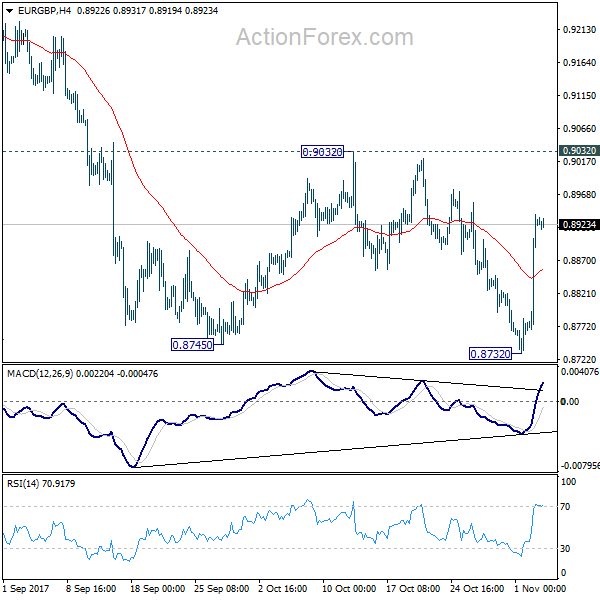
EUR/GBP Daily Outlook
Daily Pivots: (S1) 0.8741; (P) 0.8762; (R1) 0.8791; More...
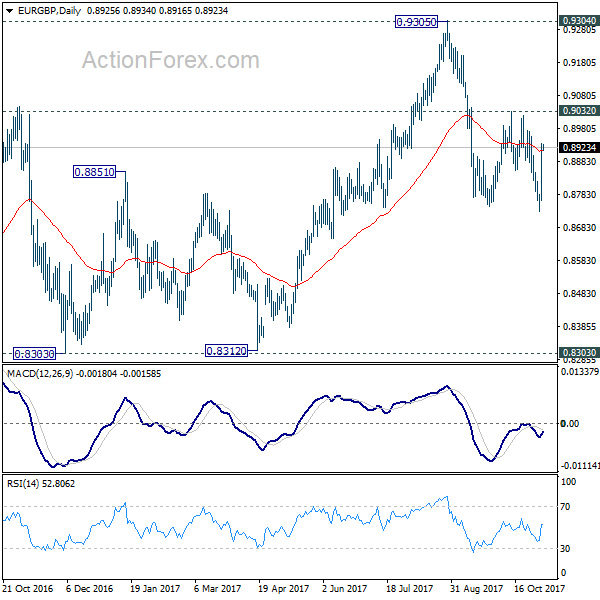
Intraday bias in EUR/GBP is mildly on the upside for 0.9032 resistance. Firm break there will indicate near term reversal and target a test on 0.9305 high. But before that, the fall from 0.9305 could still resume. And break of 0.8732 will target 0.8303 key support.
In the bigger picture, there are various ways to interpret price actions from 0.9304 high. But after all, firm break of 0.9304/5 is needed to confirm up trend resumption. Otherwise, range trading will continue with risk of another fall. And in that case, EUR/GBP could have a retest on 0.8303. But we'd expect strong support from 0.8116 cluster support (50% retracement of 0.6935 to 0.9304 at 0.8120) to contain downside.
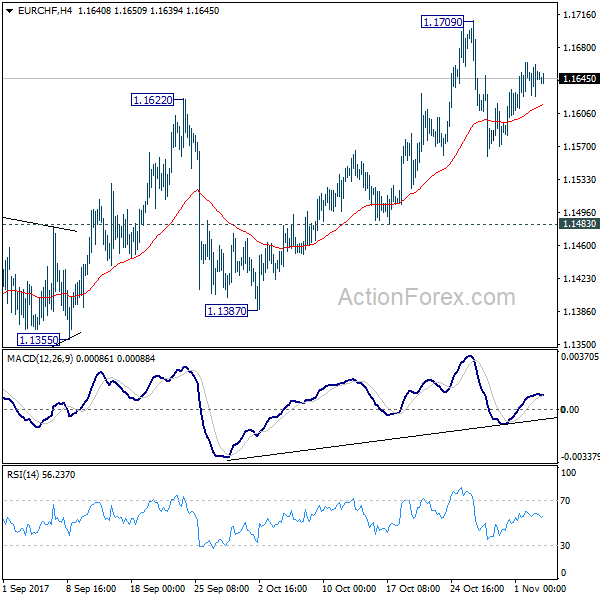
EUR/CHF Daily Outlook
Daily Pivots: (S1) 1.1628; (P) 1.1646; (R1) 1.1666; More...
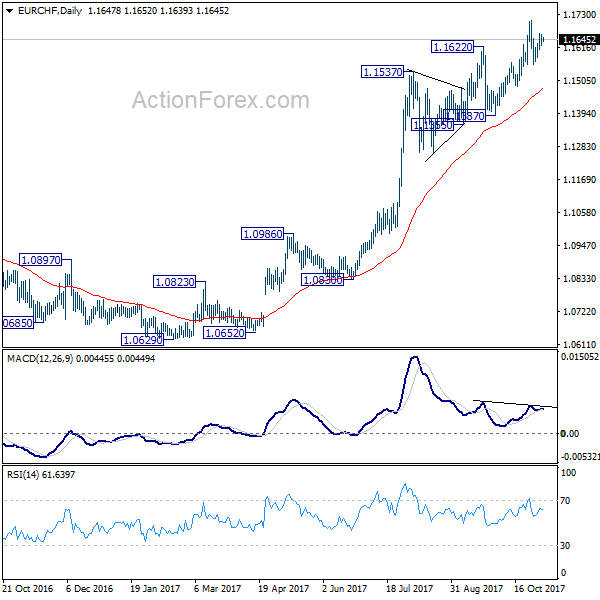
No change in EUR/CHF's outlook as consolidation from1.1709 continues. Intraday bias remains neutral at this point. Overall, near term outlook remains bullish as long as 1.1483 support holds. Break of 1.1709 will extend the medium term up trend towards 1.2 key level. However, break of 1.1483 will be an early sign of reversal. In that case, deeper decline should be seen back to 1.1355 support.
In the bigger picture, long term rise from SNB spike low back in 2015 is still in progress. EUR/CHF should now be heading back to prior SNB imposed floor at 1.2000. For now, this will be the favored case as long as 1.1355 support holds. However, break of 1.1355 will indicate medium term topping. In that case, EUR/CHF should head back to 55 week EMA (now at 1.1067) and possibly below.
USD/CHF Elliott Wave Analysis
USD/CHF – 0.9995
The greenback has maintained a firm undertone after recent anticipated rise to 1.0039, adding credence to our bullish view that low has been formed at 0.9421 and upside bias remains for this rise from there to extend further gain to 1.0050, then towards previous resistance at 1.0100, however, near term overbought condition should prevent sharp move beyond 1.0150 and reckon 1.0200-10, risk from there is seen for a retreat to take place later.
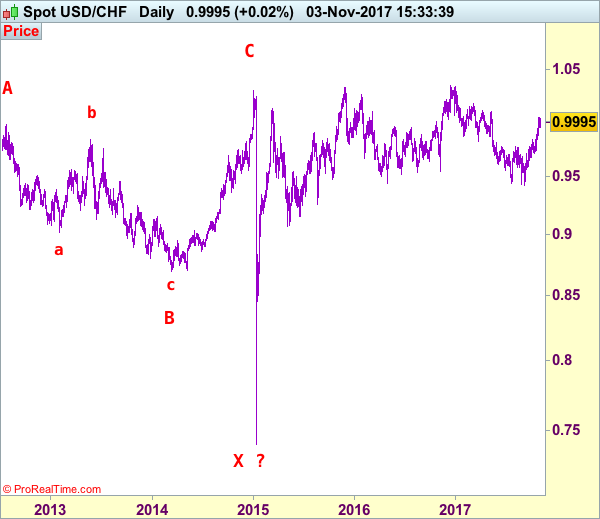
Our preferred count on the daily chart is that early selloff to 0.9630 is an end of the larger degree wave III and major correction is unfolding from there with a leg ended at 1.2298 (Nov 2008 with (a): 1.0625, (b):1.0011 and (c):1.2298), wave b ended at 0.9910 with (a): 1.0370, (b): 1.1967, (c): 0.9910. The rise from there to 1.1730 is the wave c which also marked the end of wave IV and wave V has possibly ended at 0.7068.
On the downside, whilst initial pullback to 0.9940-50 cannot be ruled out, reckon renewed buying interest would emerge above 0.9865-70 and bring another rise later. Below previous resistance at 0.9837 (now support) would defer and risk correction to 0.9795-00 but downside should be limited to 0.9755-60 and support at 0.9737 should remain intact, bring another rise. Only a drop below 0.9737 would signal top is formed instead, bring test of key support at 0.9705 which is likely to hold from here.
Recommendation: Buy at 0.9875 for 1.0075 with stop below 0.9775.
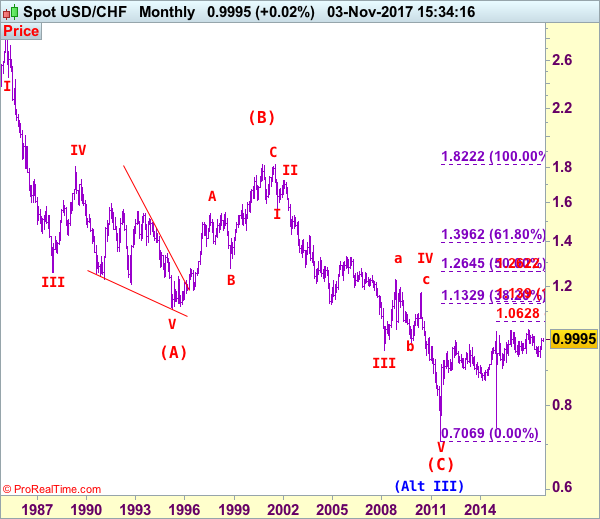
Dollar's long-term downtrend started from 2.9343 (Feb 1995) and it was unfolding as a (A)-(B)-(C) with (A): 1.1100, (B): 1.8310 (26 Oct 2000), then followed by another impulsive wave (C) with wave III ended at 0.9630 (Mar 2008). Under this count, correction in wave IV has possibly ended at 1.1730 and wave V already broke below support at 0.9630 and met indicated downside target at 0.7500 and 0.7400. The reversal from 0.7068 suggests the wave V has possibly ended and the breach of resistance at 0.9595 add credence to this view and indicated upside target at 1.0000 had been met, however, the sharp retreat from 1.0296 to 0.7401 suggests choppy trading would be seen but price should stay above said record low at 0.7068.
Trade Idea: EUR/JPY – Hold short entered at 132.70
EUR/JPY - 132.94
Original strategy:
Sold at 132.70, Target: 130.70, Stop: 133.30
Position: - Short at 132.70
Target: - 130.70
Stop: - 133.30
New strategy :
Hold short entered at 132.70, Target: 130.70, Stop: 133.30
Position: - Short at 132.70
Target: - 130.70
Stop:- 133.30
Although the single currency has continued trading with a firm undertone and marginal gain from here cannot be ruled out, as this move from 131.45 is viewed as retracement of the fall from 134.50, reckon upside would be limited and resistance at 132.96 should hold, bring retreat later, below 132.25-30 would bring weakness to 131.90-95 but break of latter level is needed to signal the rebound from 131.45 has ended, bring retest of this level, below there would extend the fall from 134.50 for a correction of early upmove to 131.00, then towards 130.50-60.
In view of this, we are holding on to our short position entered at 132.70. Above 133.10 would defer and suggest first leg of corrective decline from 134.50 top has ended, risk a stronger rebound to 133.50-60 but still reckon upside would be limited to 133.95-00, price should falter well below said last week’s high at 134.50, bring another selloff later.
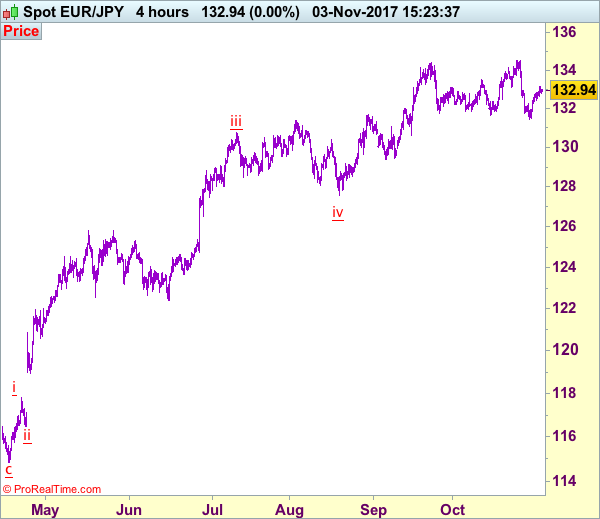
Our latest preferred count is that wave (ii) is ABC-X-ABC which ended at 123.33 and wave (iii) is unfolding with wave iii ended at 100.77, followed by wave iv at 111.57 and wave v as well as the wave (iii) has ended at 97.04, followed by wave (iv) at 111.43 and wave (v) has ended at 94.12 which is also the end of the larger degree v, this also implied the major wave (C) has also ended there, hence major correction has commenced from there with (A) leg unfolding in its lower degree wave c which has possibly ended at 145.69. Under this count, A-B-C wave (B) has commenced with A leg ended at 136.23, wave B at 143.79 and wave C has possibly ended at 149.79.
Our larger degree count is that the decline from 139.26 is wave (C) and is sub-divided into a diagonal triangle i-ii-iii-iv-v with wave i - 105.44, wave ii- 123.33, wave iii - 97.03, wave iv - 111.43, followed by the final wave v as well as the end of wave (C) at 94.12, this also mark the bottom of larger degree wave B. Under this count, major rise in wave C has commenced as an impulsive wave with minor wave III ended at 145.69, wave V is still in progress for further gain to 150.00. Having said that, this so-called wave V could well be the first leg of larger degree 5-waver wave C and this wave C should bring at least a retest of wave A top at 169.97 (July 2008).
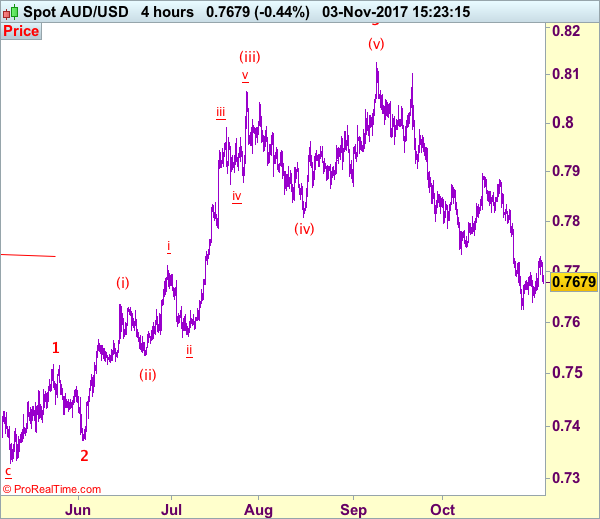
Trade Idea: AUD/USD – Hold short entered at 0.7720
AUD/USD – 0.7680
Original strategy:
Sold at 0.7720, Target: 0.7550, Stop: 0.7780
Position: - Short at 0.7720
Target: - 0.7550
Stop:- 0.7780
New strategy :
Hold short entered at 0.7720, Target: 0.7550, Stop: 0.7735
Position: - Short at 0.7720
Target: - 0.7550
Stop:- 0.7735
As aussie met resistance at 0.7730 yesterday and has retreated, retaining our bearishness and signals the rebound from 0.7625 has ended there and bearishness remains for weakness to 0.7650-60, break there would confirm the rebound fro 0.7625 has ended, bring retest of this level, below there would extend recent decline from 0.8125 top to 0.7600, having said that, loss of downward momentum should prevent sharp fall below 0.7550 and reckon 0.7500 would hold from here, bring rebound later.
In view of this, we are holding on to our short position entered at 0.7720. Above said resistance at 0.7730 would defer and risk a stronger rebound but only break of previous support at 0.7770 would abort and suggest a temporary low has possibly been formed, bring rebound to 0.7800 and then towards 0.7825-35 later.
On the 4-hour chart, recent upmove from 0.7329 is unfolding as an impulsive rise with wave 3 as well as smaller degree wave (iii) extending, only minor wave v of (iii) has ended at 0.8125, hence bullishness remains for this move to extend headway to 0.8200, then towards 0.8300, however, reckon upside would be limited to 0.8400 and the final wave 5 should falter below 0.8500, bring correction later.
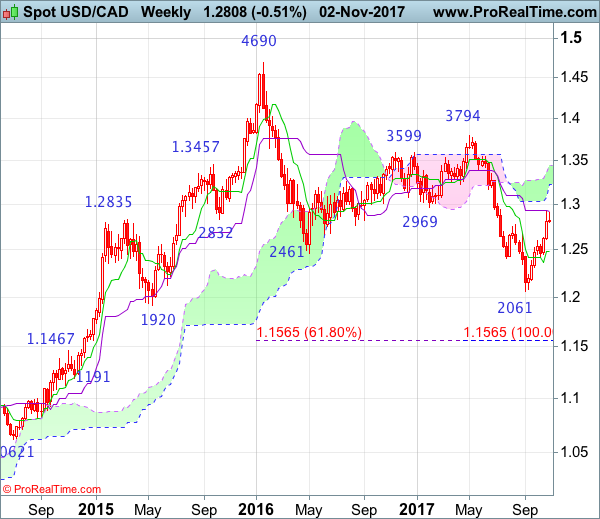
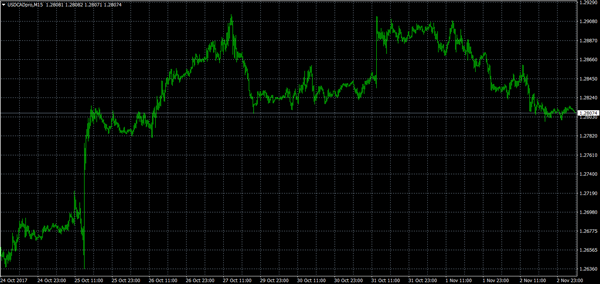
USD/CAD Candlesticks and Ichimoku Analysis
Weekly
• Last Candlesticks pattern: Shooting doji
• Time of formation: 01 May 2017
• Trend bias: Sideways
Daily
• Last Candlesticks pattern: Long white candlestick
• Time of formation: 20 Oct 2017
• Trend bias: Near term up
USD/CAD – 1.2814
The greenback has maintained a firm undertone after surging to 1.2917 late last week, adding credence to our bullish view that the rise from 1.2061 low is still in progress and may extend further gain to 1.2925-30 (50% Fibonacci retracement of 1.3794-1.2061) and then 1.3000, however, loss of near term upward momentum should prevent sharp move beyond 1.3100 and reckon dynamic resistance at 1.3130-35 (61.8% Fibonacci retracement) would hold from here, risk from there has increased for a retreat later.
On the downside, whilst pullback to the Tenkan-Sen (now at 1.2769) and then 1.2700 cannot be ruled out, reckon downside would be limited to the Kijun-Sen (now at 1.2667) and bring another rise later. Only a daily close below the Kijun-Sen would defer and suggest top is possibly formed, bring weakness to previous resistance at 1.2599 (now support) but a daily close below there is needed to confirm, bring correction to 1.2550, then towards 1.2500-10, having said that, price should stay well above support at 1.2433.
Recommendation: Buy at 1.2700 for 1.2950 with stop below 1.2600

On the weekly chart, as the greenback has eased after faltering below last week’s high at 1.2917, suggesting minor consolidation below this level would be seen and pullback to 1.2700 cannot be ruled out, however, reckon support at 1.2612 would limit downside and bring another rise later to 1.2925-30 (50% Fibonacci retracement of 1.3794-1.2061 and current level of the Kijun-Sen), break there would extend the rise from 1.2061 low to 1.3000 and then 1.3100 but still reckon upside would be limited to 1.3150-60 and the lower Kumo (now at 1.3224) should remain intact.
On the downside, although initial pullback to 1.2700 is likely, reckon downside would be limited to 1.2650-60 and last week’s low at 1.2612 should hold, bring another rise later. A drop below previous resistance at 1.2599 (now support) would defer and suggest top is possibly formed, bring weakness to 1.2550, then towards 1.2500 but reckon the Tenkan-Sen (now at 1.2489) would limit downside and bring another rise later. Only a drop below support at 1.2433 would signal the rebound from 1.2061 has ended instead, bring further fall to 1.2390-00 and later towards 1.2300-10 but reckon 1.2121 support would remain intact.
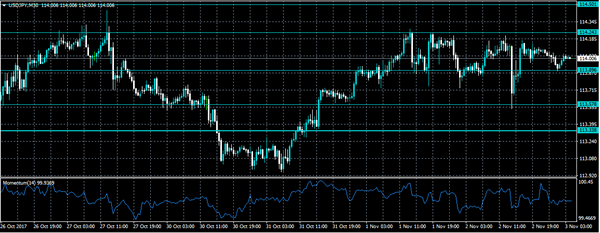
USDJPY Buyers Retain Control Above 113.89
The U.S dollar continues to ease around the 114 level against the Japanese yen, after the announcement of the new FED Chair Jerome Powell had been in-line with what market participants had been expecting. The USDJPY pair showed a muted reaction after the news, with price-action continuing to trade just below the three and a half month high, at 114.44. Traders now await the release of the U.S Non-farm payrolls job report, with 300,000 new U.S jobs expected to be created in October.
USDJPY buyers retain control of the pair while price-action holds above the 113.89 level. Further intraday buying towards the 114.24 and 114.50 levels remains most likely.
If intraday USDJPY sellers push price-action below the 113.89 level for a sustained period, a further decline towards the 113.57 and 113.33 levels remains the most likely scenario.
Further Pound Selling Below 1.3070
The British pound continues to fall sharply against the U.S dollar, with price-action hitting 1.3040, during late Thursday trading. The GBPUSD pair currently trades around the 1.3060 level, with the U.S dollar index remaining well supported after the announcement of the new FED Chair Jerome Powell and the Trump administration tax plan. Traders now await the release of the U.S Nonfarm payrolls job report.
Further GBPUSD selling pressure should remain while price-action trades below the 1.3070 technical level. Sellers will likely target the 1.3040 and 1.3023 support levels.
Should price-action trade above the 1.3070 level for a sustained period, a relief-rally towards the 1.3130 and 1.3200 resistance remains possible.

Friday Is Nonfarm Payrolls Day
On Friday, the US Department of Labor will release the most closely watched data event of the month. The October nonfarm payrolls report will make its way through the financial markets at 12:30 GMT, and could set the tone for the remainder of the session.
The monthly jobs report is expected to show a whopping 312,000 jobs added to the economy last month, following a decline of 33,000 in September that was caused by volatile weather in Texas and Florida. The jobless rate is expected to hold steady at 4.2% with average weekly hours going unchanged.
On Wednesday, payrolls processor ADP Inc. said private sector employers added 235,000 workers in September. That was much higher than the 200,000 forecasted by economists.
NFP data influence everything from stocks to forex. Any reading that deviates significantly from the consensus forecast is likely to trigger a volatile response from the market.
The Commerce Department will also release its September trade balance during the same time as the NFP report. The trade deficit is forecast to expand slightly to $43.2 billion from $42.4 billion the previous month.
Later in the day, the Institute for Supply Management (ISM) and IHS Markit will unveil the latest services PMI report for October. The ISM report is expected to show a slight cooldown in non-manufacturing growth after the PMI approached 60 in September.
A report on US factory orders will also make headlines at 14:45 GMT. Orders for factory goods are expected to climb 1.3% month-on-month.
On the policy front, Federal Open Market Committee (FOMC) member Neel Kashkari will deliver a speech at 16:15 GMT.
Of course, the financial world stretches far beyond the United States. North of the border, the Canadian government will also release its monthly jobs report for October. The net change in employment is expected to show a monthly gain of 15,000 jobs for Canada. Unemployment is widely expected to remain at 6.2%.
Statistics Canada will also report on the latest trade balance for September. Canada's trade deficit is forecast to shrink to $3 billion during the month.
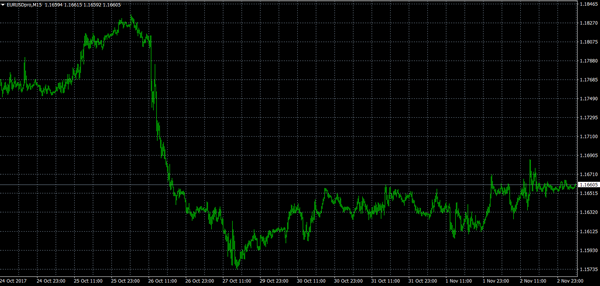
EUR/USD
The euro gained some upward traction on Thursday, but failed to generate significant support above 1.1670 US. The EUR/USD was last seen trading roughly 10 pips below that level, with investors setting their sights on nonfarm payrolls.
USD/CAD
The Canadian dollar clawed back some of its recent declines on Thursday, with the USD/CAD crumbling back toward the 1.2800 handle. Friday will be a big session for the pair, with data from both countries set to make headlines.
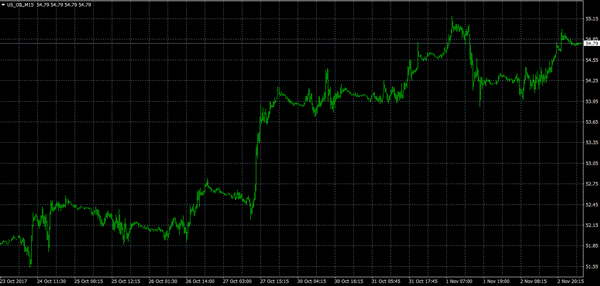
US CRUDE
Crude prices are trading at their highest level for 2017, a sign that investors are more comfortable with the supply/demand outlook. US crude prices were up again on Friday, adding half a percent to $54.83 a barrel. The market has enough momentum to continue higher, based on the fundamental indicators