
Sample Category Title
EUR/AUD Daily Outlook
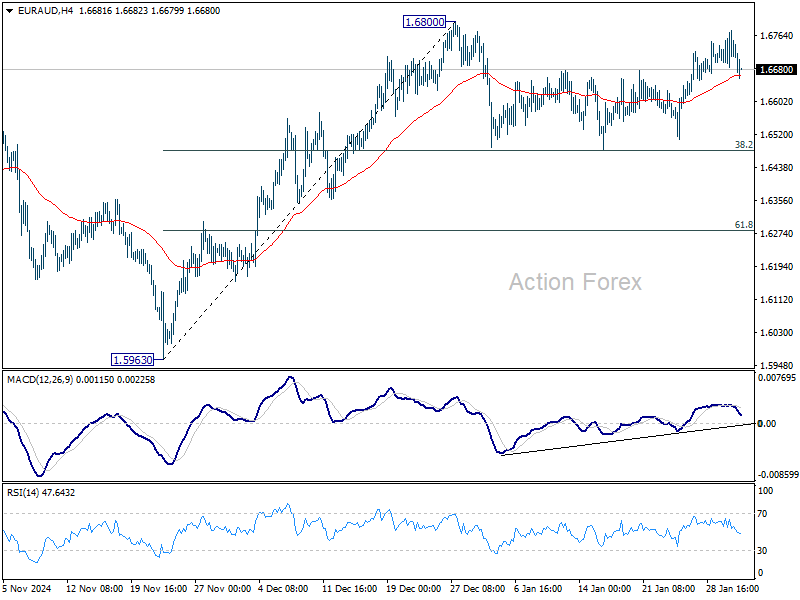
Daily Pivots: (S1) 1.6690; (P) 1.6735; (R1) 1.6782; More...
EUR/AUD failed to break through 1.6800 resistance and retreated. Intraday bias remains neutral for the moment. In case of another dip, strong support is expected from 38.2% retracement of 1.5963 to 1.6800 at 1.6480 to contain downside. On the upside, firm break of 1.6800 will resume the rally from 1.5963. However, sustained break of 1.6480 will bring deeper correction 61.8% retracement at 1.6283 instead.
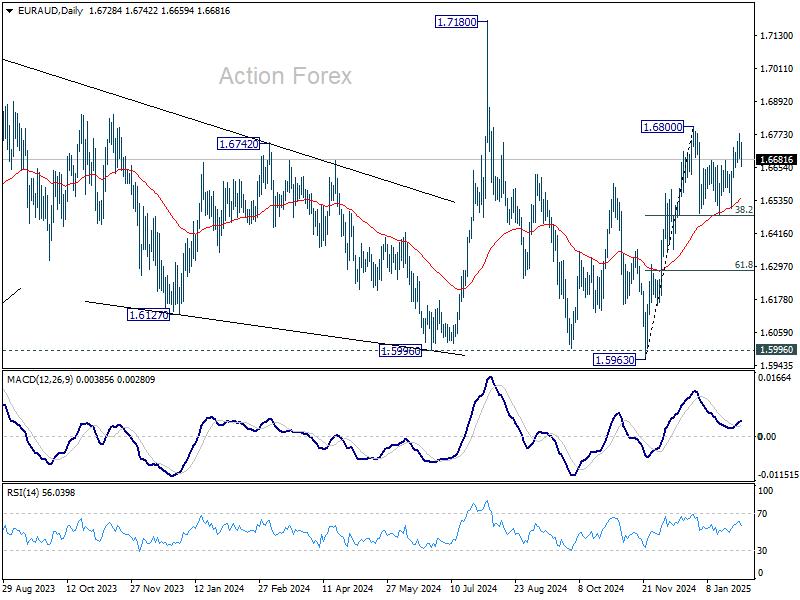
In the bigger picture, EUR/AUD is holding on to 1.5996 key support (2024 low) despite brief breach. Larger up trend from 1.4281 (2022 low) is still in favor to resume through 1.7180 at a later stage. Nevertheless, sustained break of 1.5996 will indicate that such up trend has completed and deeper decline would be seen.
EUR/CHF Daily Outlook
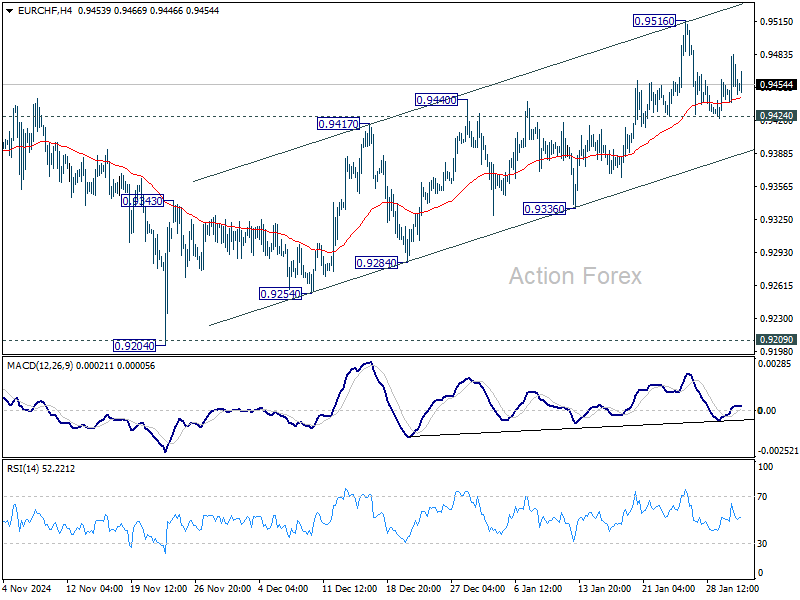
Daily Pivots: (S1) 0.9433; (P) 0.9459; (R1) 0.9481; More....
Intraday bias in EUR/CHF stays neutral for the moment. On the downside, firm break of 0.9424 support will indicate rejection by 38.2% retracement of 0.9928 to 0.9204 at 0.9481. Deeper fall would then be seen back to channel support (now at 0.93877). However, strong rebound from current level will keep the choppy rally from 0.9204 intact.
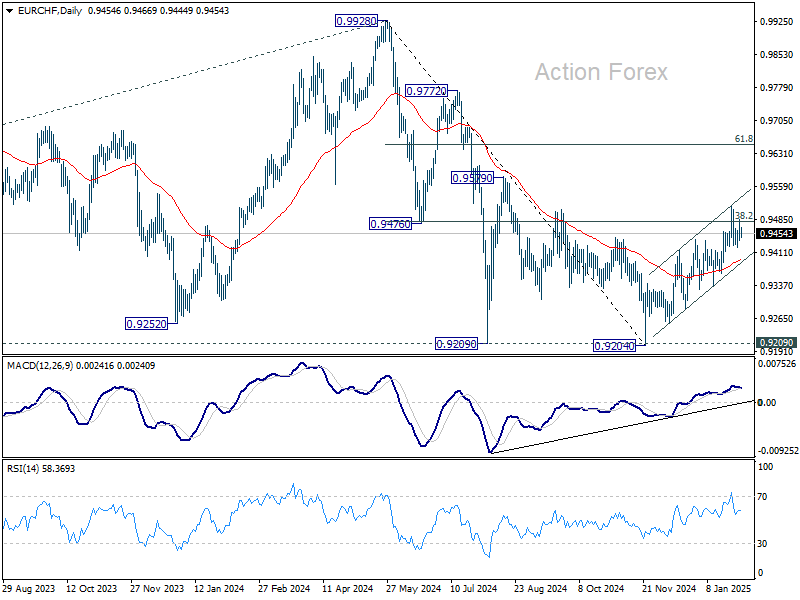
In the bigger picture, fall from 0.9928 should have completed at 0.9204 with the current strong rebound, after failing to sustain below 0.9252 (2023 low). It's still early to confirm long term bullish reversal. But even as a corrective move, current rebound could extend to 61.8% retracement of 0.9928 to 0.9204 at 0.9651. On the downside, firm break of 55 D EMA (now at 0.9390) will maintain medium term bearishness and bring retest of 0.9204 low.
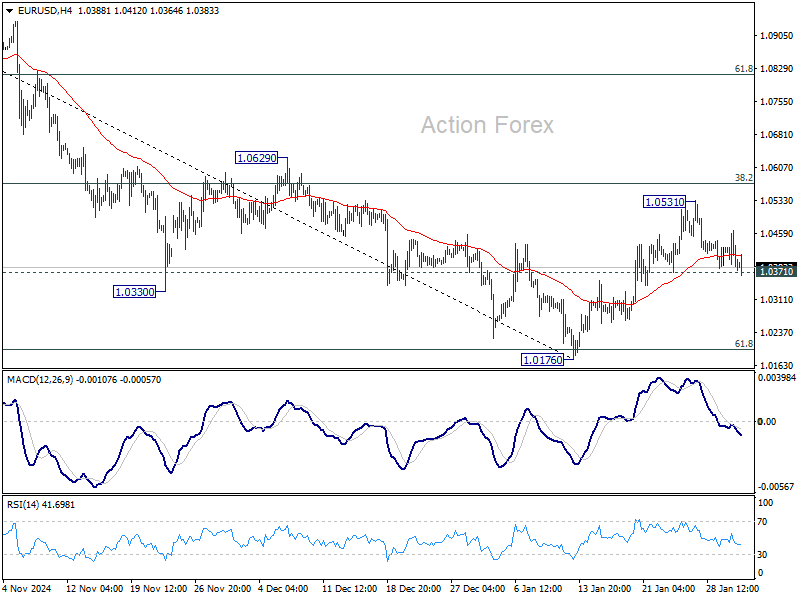
EUR/USD Daily Outlook
Daily Pivots: (S1) 1.0363; (P) 1.0415; (R1) 1.0445; More...
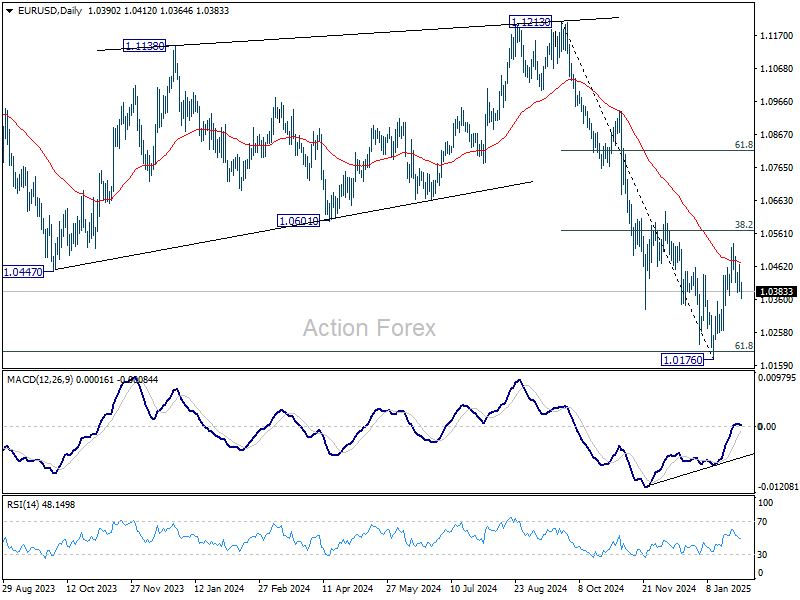
Intraday bias in EUR/USD remains neutral for the moment. On the downside, break of 1.0371 support will indicate rejection by 38.2% retracement of 1.1213 to 1.0176 at 1.0572 and retain near term bearishness. Retest of 1.0176 low should be seen next. On the upside, though, decisive break of 1.0572 will raise the chance of bullish reversal, and target 61.8% retracement at 1.0817.
In the bigger picture, outlook is mixed as fall from 1.1274 (2023 high) could either be the second leg of the corrective pattern from 0.9534 (2022 low), or another down leg of the long term down trend. Strong support from 61.8 retracement of 0.9534 to 1.1274 at 1.0199 will favor the former case, and sustained break of 55 W EMA (now at 1.0722) will argue that the third leg might have started. However, sustained trading below 1.0199 will favor the latter case and bring retest of 0.9534 low.
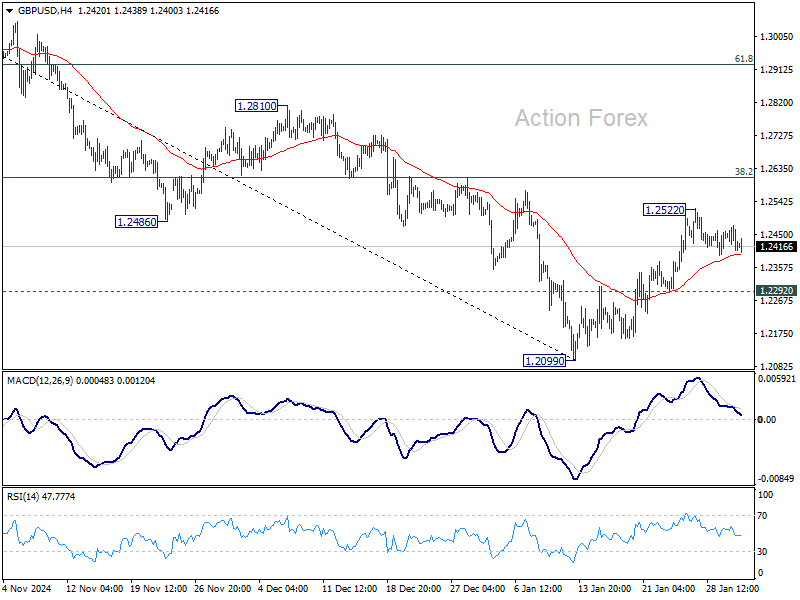
GBP/USD Daily Outlook
Daily Pivots: (S1) 1.2391; (P) 1.2434; (R1) 1.2459; More...
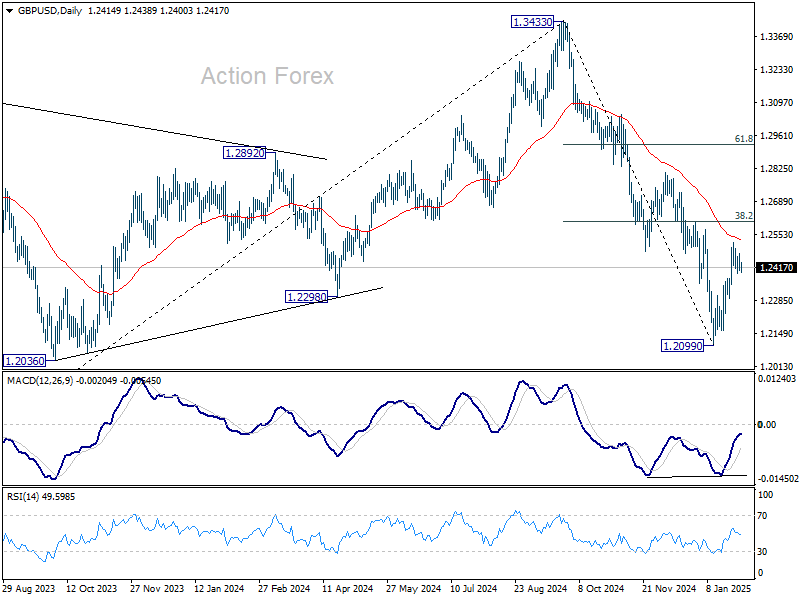
No change in GBP/USD's outlook as range trading continues and intraday bias stays neutral. Rebound from 1.2099 is seen as a corrective move. While another rise cannot be ruled out, strong resistance could be seen 38.2% retracement of 1.3433 to 1.2099 at 1.2609 to limit upside. On the downside, below 1.2292 minor support will bring retest of 1.2099 low. However, sustained trading above 1.2609 will raise the chance of reversal and target 61.8% retracement at 1.2923.
In the bigger picture, rise from 1.0351 (2022 low) should have already completed at 1.3433 (2024 high), and the trend has reversed. Further fall is now expected as long as 1.2810 resistance holds. Deeper decline should be seen to 61.8% retracement of 1.0351 to 1.3433 at 1.1528, even as a corrective move. However, firm break of 1.2810 will dampen this bearish view and bring retest of 1.3433 high instead.
USD/JPY Daily Outlook
Daily Pivots: (S1) 153.59; (P) 154.48; (R1) 155.16; More...
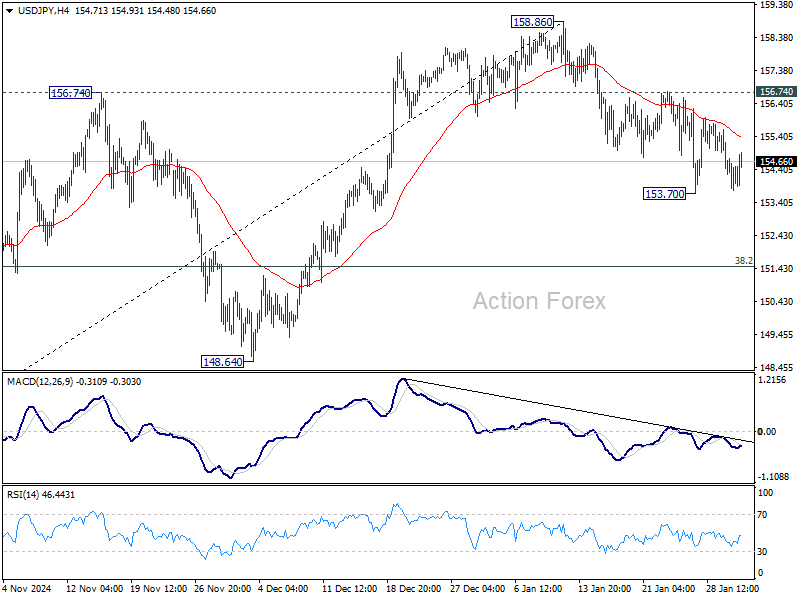
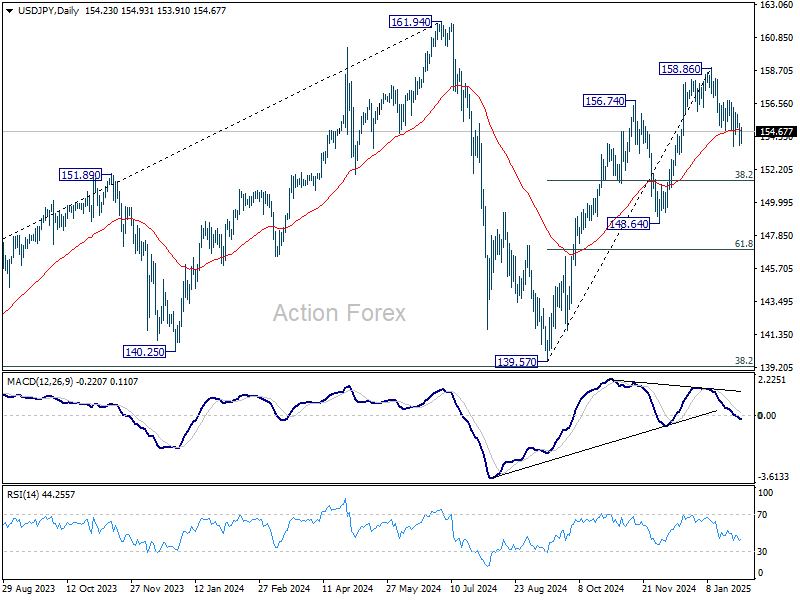
USD/JPY recovered ahead of 153.70 temporary low and intraday bias stays neutral. On the downside, firm break of 153.70 will resume the fall from 158.86 to 38.2% retracement of 139.57 to 158.86 at 151.49. Nevertheless, break of 156.74 resistance will indicate that fall from 158.86 has completed as a correction. Intraday bias will be back on the upside for 158.86 and above to resume the whole rally from 138.57.
In the bigger picture, price actions from 161.94 are seen as a corrective pattern to rise from 102.58 (2021 low). The range of medium term consolidation should be set between 38.2% retracement of 102.58 to 161.94 at 139.26 and 161.94. Nevertheless, sustained break of 139.26 would open up deeper medium term decline to 61.8% retracement at 125.25.
USD/CHF Daily Outlook
Daily Pivots: (S1) 0.9069; (P) 0.9087; (R1) 0.9114; More…
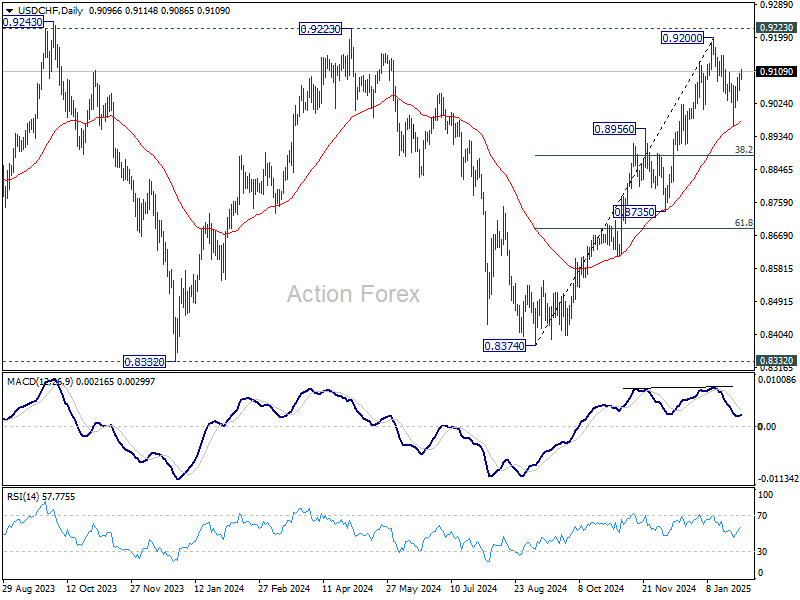
USD/CHF's recovery from 0.8964 extends today, and break of 0.9107 suggests that pull back from 0.9200 has completed. Intraday bias is back on the upside for 0.9200, and then 0.9223 key resistance. On the downside, break of 0.8964 will resume the fall from 0.9200 to 38.2% retracement of 0.8374 to 0.9200 at 0.8884 next.
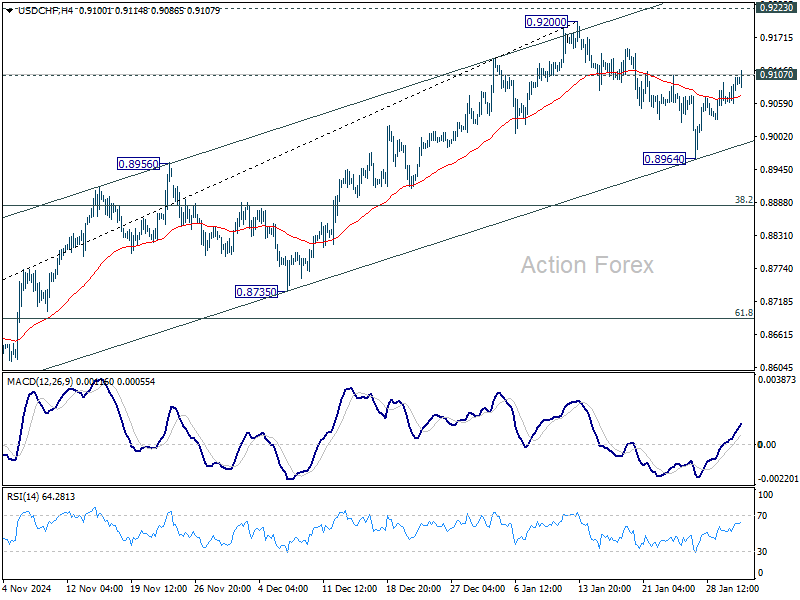
In the bigger picture, as long as 0.9223 resistance holds, price actions from 0.8332 (2023 low) are seen as a medium term corrective pattern. That is, long term down trend is in favor to resume through 0.8332 at a later stage. However, sustained break of 0.9223 will be an important sign of bullish trend reversal.
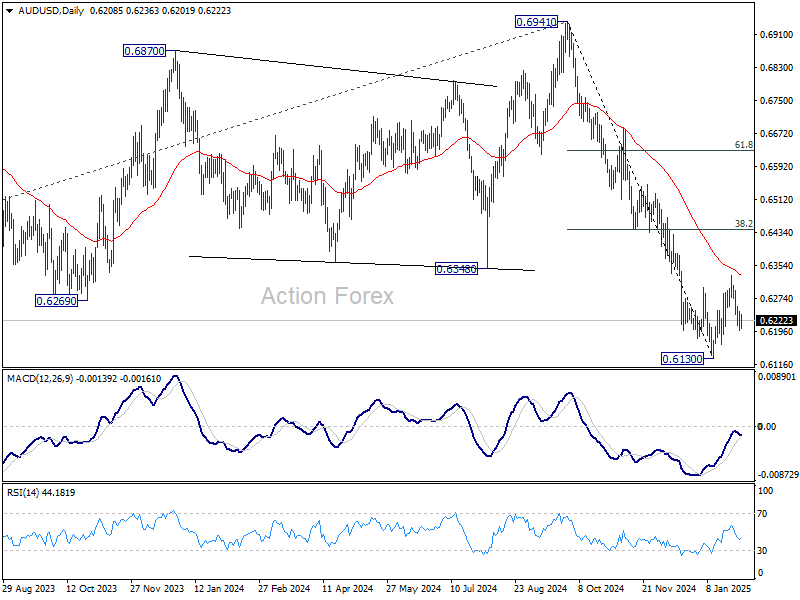
AUD/USD Daily Report
Daily Pivots: (S1) 0.6191; (P) 0.6218; (R1) 0.6236; More...
Intraday bias in AUD/USD remains mildly on the downside for retesting 0.6130 low. Firm break there will resume whole fall from 0.6941. On the upside, break of 0.6329 resistance will extend the corrective pattern from 0.6130 with another rally. But in this case, strong resistance is expected from 38.2% retracement of 0.6941 to 0.6130 at 0.6440 to limit upside to complete this pattern.
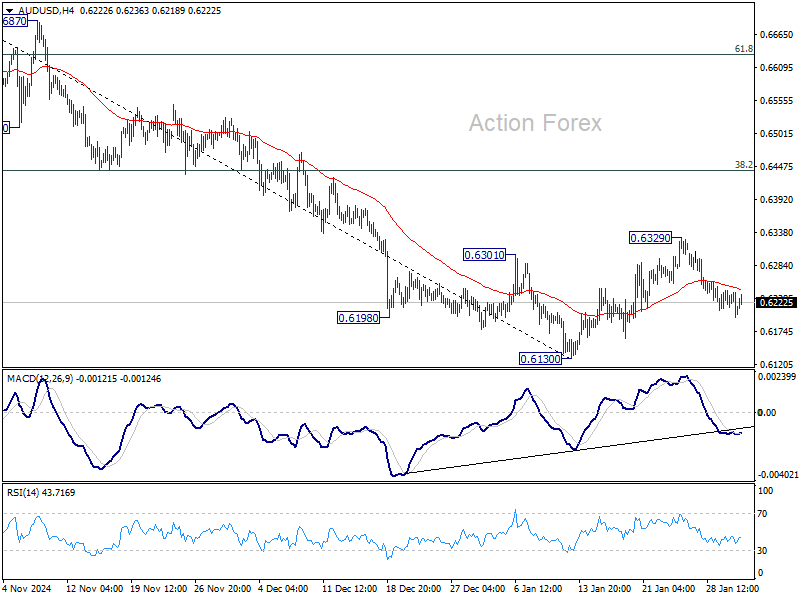
In the bigger picture, fall from 0.6941 (2024 high) is seen as part of the down trend from 0.8006 (2021 high). Next medium term target is 61.8% projection of 0.8006 to 0.6169 from 0.6941 at 0.5806. In any case, outlook will stay bearish as long as 55 W EMA (now at 0.6545) holds.
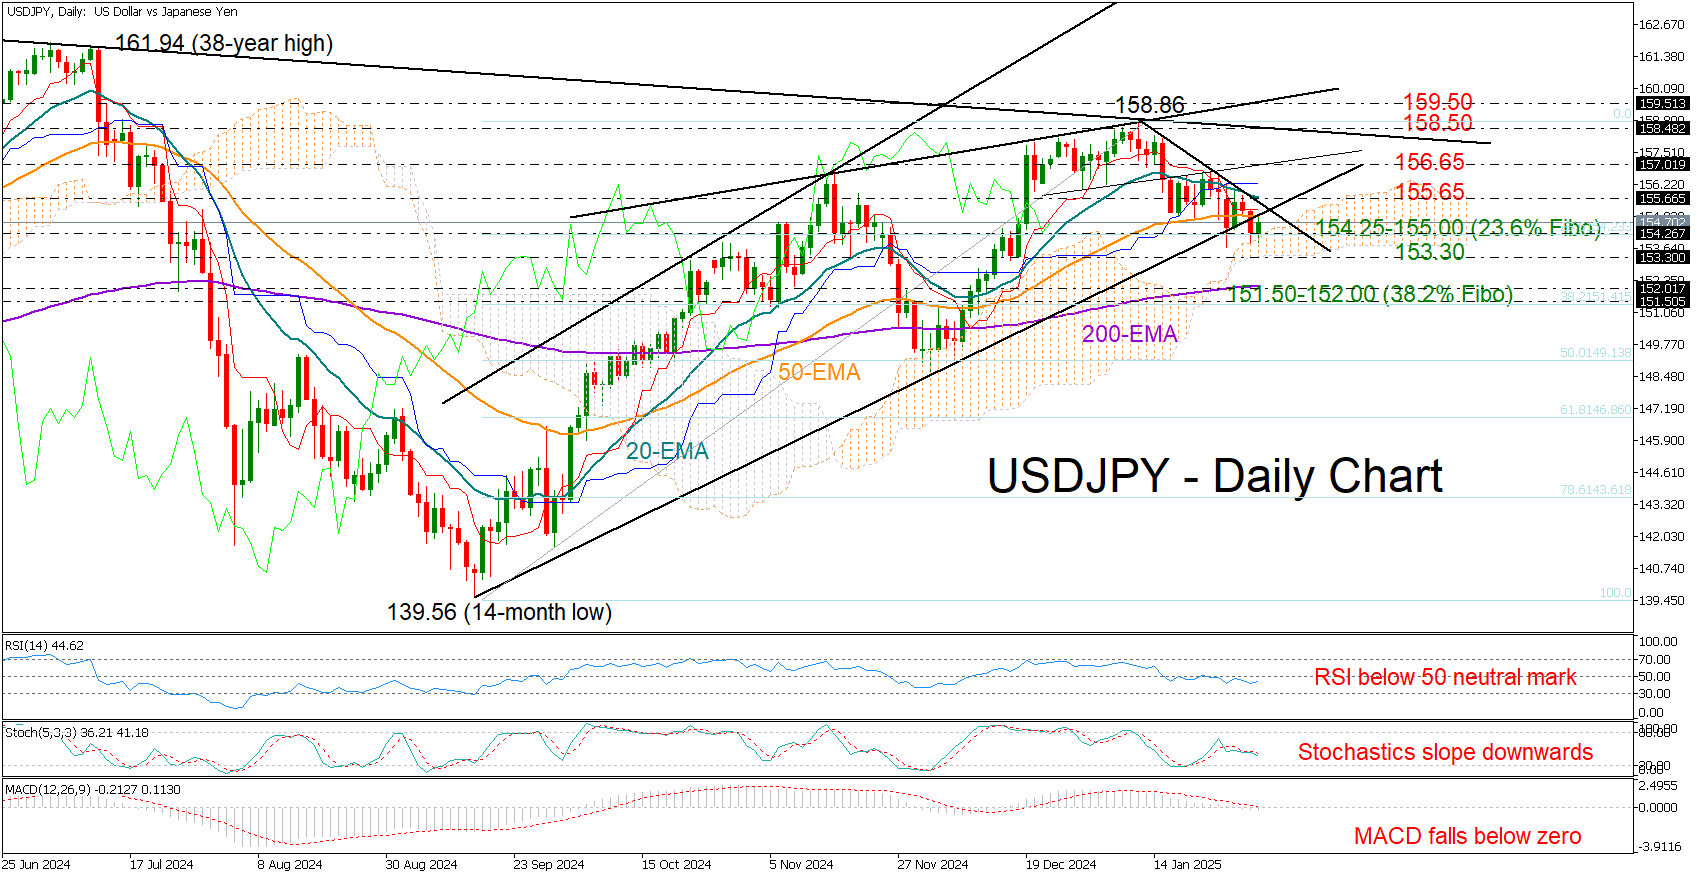
USD/JPY Holds Support, But Downside Risks Linger
- USD/JPY flatlines near 154.25 support.
- Technical signals remain downbeat.
- US core PCE inflation index due at 13:30 GMT.
USDJPY has held above the 154.25 floor for the fourth consecutive trading day despite Thursday’s downside pressures. However, this stability may not be enough to reignite buying interest.
Bearish risks remain in play as the RSI continues to hover around its 50 neutral mark, the Stochastic oscillator is decelerating, and the MACD is stepping into the negative region.
The 50-day exponential moving average (EMA) is currently keeping a lid on bullish attempts near 155.00 ahead of the US Core PCE inflation data. A break above it could attract buyers' attention, but the real test could come around the 20-day EMA at 155.65 –a key hurdle that bulls must clear to set the stage for a climb toward the 157.00 resistance zone. If momentum builds, traders could see a brief pause around 158.50 before the door opens to the critical 159.50 resistance line, where sellers may attempt to regain control.
If the 154.25 base –aligned with the upper band of the Ichimoku cloud –cracks, the pair could retest the 153.30 constraining zone before diving to 151.40-152.00. Additional losses from there could squeeze the price towards December’s base around 149.00, where the 50% Fibonacci retracement of the September-January upleg is sitting.
Overall, USDJPY remains under bearish pressure, with sellers watching for a sustained drop below 154.25 to accelerate downside momentum.
Gold Hits Record High as Demand for Safe-Haven Assets Surges
Gold soared towards 2,800 USD per ounce on Friday, setting a new all-time high. The surge comes as investors seek refuge in safe-haven assets amid renewed trade war threats from US President Donald Trump. His latest statements have heightened concerns over economic slowdowns and potential disruptions to global trade.
Key drivers of Gold’s record rally
Global monetary easing is reinforcing Gold’s rally. Several major central banks have adopted a softer stance, increasing liquidity and keeping interest rates low, further supporting the appeal of non-yielding assets like Gold.
- The European Central Bank (ECB) cut rates as expected, leaving room for further easing
- The Bank of Canada (BoC) halted quantitative tightening
- Sweden’s Riksbank also cut rates earlier in the week
- The People’s Bank of China (PBoC) and the Reserve Bank of India (RBI) signalled their willingness to ease policy further and inject liquidity
Meanwhile, the US Federal Reserve kept rates unchanged this week, maintaining expectations for at least two rate cuts later this year.
With all these factors, Gold is on track for its biggest monthly gain since March 2024.
Technical analysis of XAU/USD
On the H4 chart, Gold found support at 2,731 USD and extended its rally to 2,797 USD. A consolidation range is forming around this level.
- If the range breaks downward, a correction to 2,772 USD is possible
- If the range breaks upward, a growth wave towards 2,818 USD may develop, potentially extending further to 2,839 USD
This scenario is supported by the MACD indicator, which has its signal line above zero and points upwards, confirming bullish momentum.
On the H1 chart, Gold initially formed a consolidation range near 2,772 USD before breaking upwards, reaching 2,797 USD.
- A continuation of the rally towards 2,808 USD is likely.
- After reaching 2,808 USD, a pullback to 2,777 USD (testing support) is possible
- Following the correction, further growth towards 2,818 USD and potentially 2,839 USD is expected
The Stochastic oscillator supports this XAU/USD outlook, with its signal line above 50 and preparing for an upward move towards 80, indicating more upside potential.
Conclusion
Gold’s record-high surge reflects heightened risk aversion and global monetary easing. With central banks cutting rates and Trump’s trade threats unsettling markets, demand for Gold remains strong. Technical indicators suggest further upside, with key resistance levels at 2,818 USD and 2,839 USD. However, short-term corrections towards 2,772 USD or 2,777 USD could provide buying opportunities before the uptrend resumes.
USD/CAD Daily Outlook
Daily Pivots: (S1) 1.4390; (P) 1.4493; (R1) 1.4593; More...
USD/CAD's break of 1.4516 resistance indicates resumption of larger rally. Intraday bias is back on the upside for 1.4667/89 key resistance zone. Strong resistance might be seen there to limit upside on first attempt. But break of 1.4260 support is needed to confirm short term topping. Otherwise, outlook will stay bullish in case of retreat. Decisive break of 1.4689 will confirm long term up trend resumption.

In the bigger picture, up trend from 1.2005 (2021) is in progress for retesting 1.4667/89 key resistance zone (2020/2015 highs). Decisive break there will confirm long term up trend resumption. Next target is 100% projection of 1.2401 to 1.3976 from 1.3418 at 1.4993. Medium term outlook will remain bullish as long as 1.3976 resistance turned holds (2022 high), even in case of deep pullback.
