Sample Category Title
Japan’s Consumer Confidence Climbed In October
For the 24 hours to 23:00 GMT, the USD rose 0.45% against the JPY and closed at 114.15.
Overnight data revealed that Japan's monetary base rose 14.5% on an annual basis in October, from a gain of 15.6% in the prior month.
In the Asian session, at GMT0400, the pair is trading at 113.89, with the USD trading 0.23% lower from yesterday's close.
Early today, data showed that Japan's consumer confidence index unexpectedly rose to 44.5 in October, compared to a reading of 43.9 in the previous month. Market expectation was for the consumer confidence index to ease to a level of 43.6.
The pair is expected to find support at 113.65, and a fall through could take it to the next support level of 113.42. The pair is expected to find its first resistance at 114.2, and a rise through could take it to the next resistance level of 114.52.
The currency pair is trading between its 20 Hr and 50 Hr moving averages.

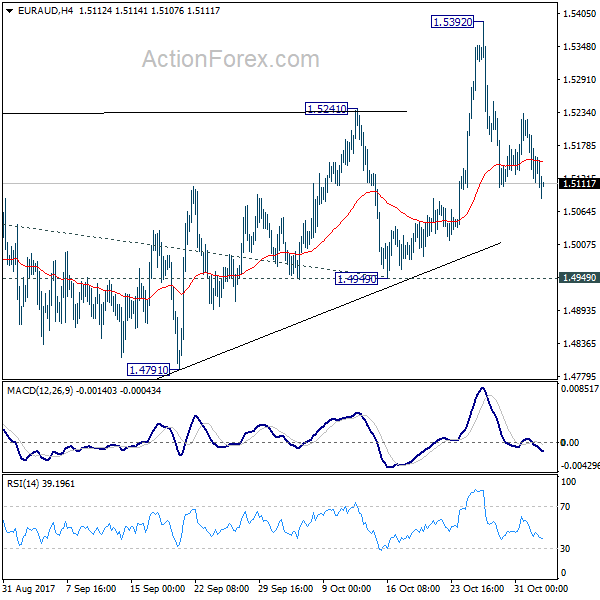
EUR/AUD Daily Outlook
Daily Pivots: (S1) 1.5092; (P) 1.5158; (R1) 1.5200; More....
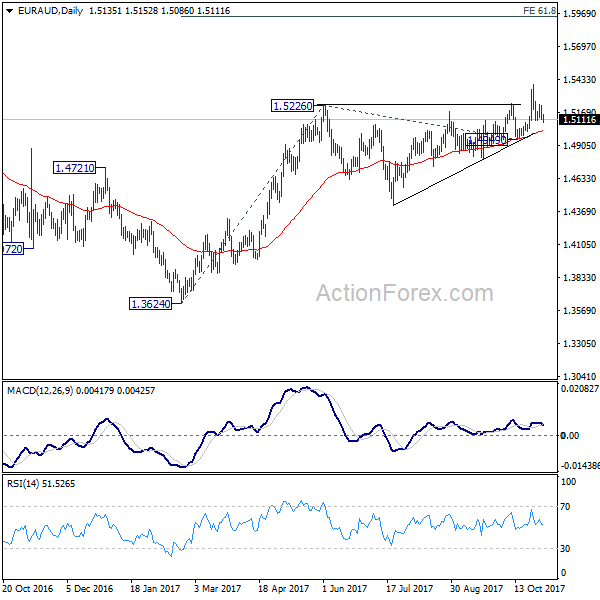
EUR/AUD's correction from 1.5392 is still in progress and outlook is unchanged. As long as 1.4949 support holds, outlook remains bullish. Medium term rally from 1.3624 is in favor to continue. On the upside, break of 1.5392 will resume medium term rise from 1.3624 and target 61.8% projection of 1.3624 to 1.5226 from 1.4949 at 1.5939 first. However, decisive break of 1.4949 will carry larger bearish implication and turn bias to the downside.
In the bigger picture, we're holding on to the view that corrective decline from 1.6587 medium term top has completed at 1.3624. Rise from 1.3624 is expected to extend to retest 1.6587. However, break of 1.4949 support will dampen our view and argue that rise from 1.3624 has completed. In that case, EUR/AUD would turn southward for retesting 1.3624 low.
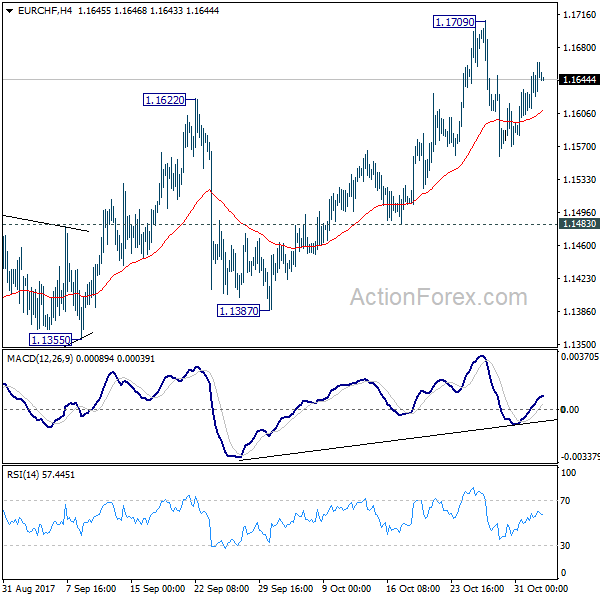
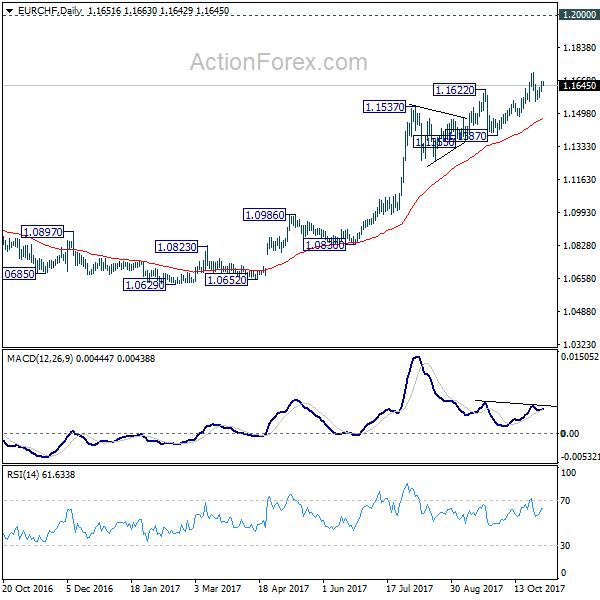
EUR/CHF Daily Outlook
Daily Pivots: (S1) 1.1622; (P) 1.1643; (R1) 1.1676; More...
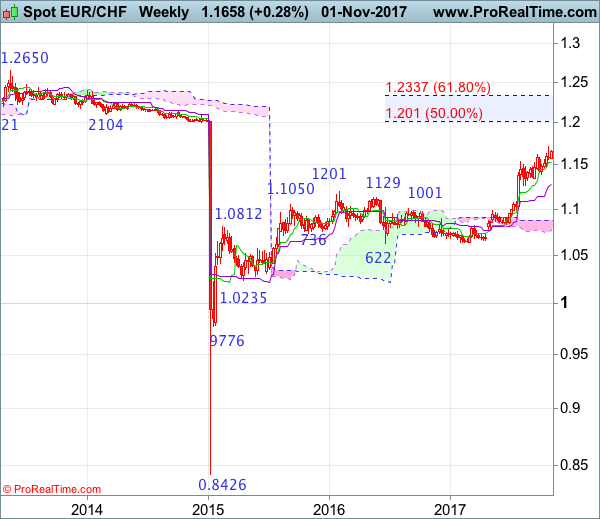
EUR/CHF recovered after dipping to 1.1559 but it still staying in range below 1.1709 temporary top. Intraday bias remains neutral first. Overall, near term outlook remains bullish as long as 1.1483 support holds. Break of 1.1709 will extend the medium term up trend towards 1.2 key level. However, break of 1.1483 will be an early sign of reversal. In that case, deeper decline should be seen back to 1.1355 support.
In the bigger picture, long term rise from SNB spike low back in 2015 is still in progress. EUR/CHF should now be heading back to prior SNB imposed floor at 1.2000. For now, this will be the favored case as long as 1.1355 support holds. However, break of 1.1355 will indicate medium term topping. In that case, EUR/CHF should head back to 55 week EMA (now at 1.1067) and possibly below.
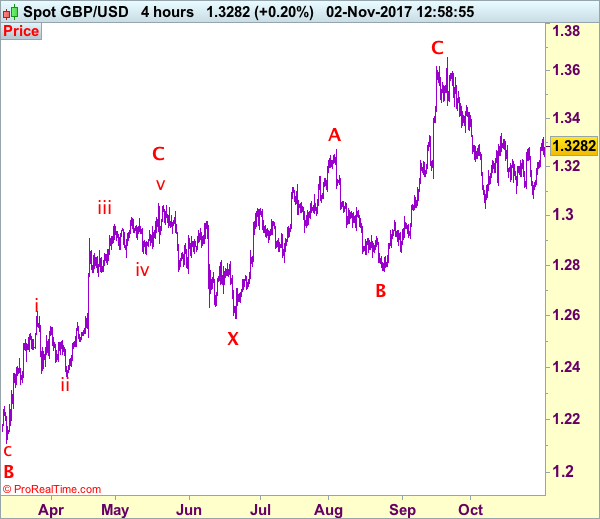
Trade Idea: GBP/USD – Stand aside
GBP/USD – 1.3283
New strategy :
Stand aside
Position: -
Target: -
Stop:-
As sterling has traded with a firm bias after breaking above previous resistance at 1.3279-87, suggesting near term upside bias remains for the rebound from 1.3070 to extend gain towards resistance at 1.3338, however, as broad outlook remains consolidative, reckon upside would be limited to 1.3390-00 and price should falter well below resistance at 1.3455, bring another decline later.
In view of this, would not chase this rise here and would be prudent to stand aside for now. Below 1.3240 would bring pullback to 1.3220-25 but only break of 1.3195-00 would signal top is formed instead, then further choppy trading within recent range would take place and weakness to 1.3150 and possibly 1.3117 would follow. Our preferred count is that (pls see the attached chart) the wave IV is unfolding as a complex double three (ABC-X-ABC) correction with 2nd wave B ended at 1.2774, hence 2nd wave C could have ended at 1.3658.
Our preferred count on the daily chart is that cable's rebound from 1.3500 (wave (A) trough) is unfolding as a wave (B) with A ended at 1.7043, followed by triangle wave B and wave C as well as wave (B) has ended at 1.7192, the subsequent selloff is the larger degree wave (C) which is still unfolding with minor wave (III) of larger degree wave 3 ended at 1.1986, hence wave (IV) correction is in progress which could either be a triangle wave (IV) of a complex formation but upside should be limited to 1.3500 and price should falter well below 1.4000, bring another decline in wave (V) of 3 for weakness to 1.1500, then 1.1200.
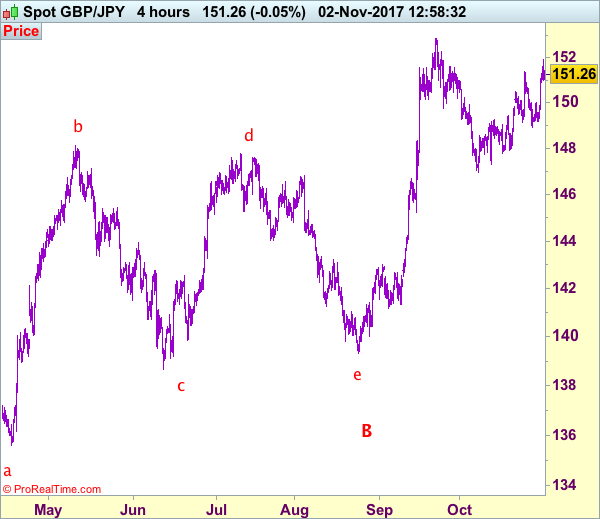
Trade Idea: GBP/JPY – Stand aside
GBP/JPY - 151.30
New strategy :
Stand aside
Position: -
Target: -
Stop:-
Although sterling retreated after surging to 151.90 yesterday and consolidation below this level would be seen initially today, reckon downside would be limited to 150.50-60 and bring another rise later, above said resistance at 151.90 would signal the rise from 146.95 is still in progress for further gain to 152.25-30 but break there is needed to retain bullishness and signal early upmove has resumed for retest of recent high of 152.85 which is likely to hold on first testing.
In view of this, would not chase this rise here and would be prudent to stand aside in the meantime. Below 150.50 would bring test of previous resistance at 150.00 but break there is needed to suggest top is possibly formed, bring weakness to 149.15-20, having said that, only break of support at 148.95 would confirm and revive bearishness for retracement of recent rise to 148.75, then towards 148.00-10.
Our preferred count is that larger degree wave V with circle is unfolding from 251.12 with wave (I) 219.34, (II): 241.38 and wave (III) is subdivided into 1: 192.60, 2: 215.89 (23 Jul 2008) and wave 3 ended at 118.87 earlier in 2009. The correction from there to 162.60 is wave 4 which itself is a double three and is labeled as first a-b-c ended at 151.53, followed by wave x at 139.03, 2nd a ended at 162.60, 2nd b at 146.75 and 2nd c leg of wave 4 ended at 163.00. Therefore, the decline from 163.00 to 116.85 is now treated as wave 5 which also marked the end of larger degree wave (III), hence wave (IV) major correction has commenced for retracement of the wave (III) from 241.38 and upside target at 183.95-00 (50% Fibonacci retracement of the wave (II) from 241.38) had been met, a drop below 160.00 would suggest wave (IV) has ended at 195.85, bring decline in wave (V) for initial weakness to 130 (already met) and 120.
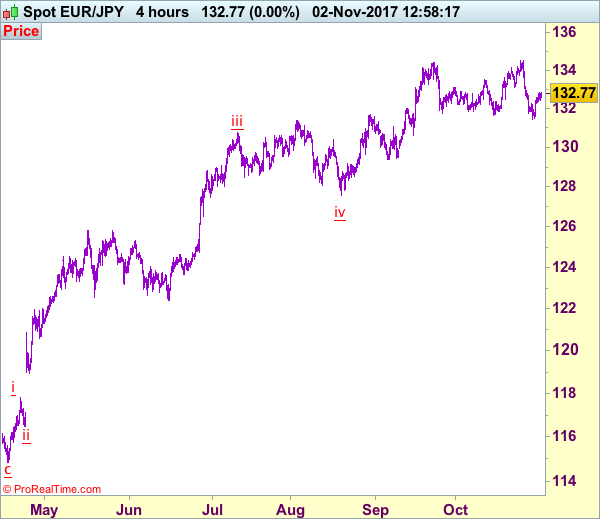
Trade Idea: EUR/JPY – Hold short entered at 132.70
EUR/JPY - 132.77
Original strategy:
Sold at 132.70, Target: 130.70, Stop: 133.30
Position: - Short at 132.70
Target: - 130.70
Stop: - 133.30
New strategy :
Hold short entered at 132.70, Target: 130.70, Stop: 133.30
Position: - Short at 132.70
Target: - 130.70
Stop:- 133.30
Although the single currency has maintained a firm undertone after staging a strong rebound from 131.45 and marginal gain from here cannot be ruled out, as this move from 131.45 is viewed as retracement of the fall from 134.50, reckon upside would be limited and resistance at 132.96 should hold, bring retreat later, below 132.25-30 would bring weakness to 131.90-95 but break of latter level is needed to signal the rebound from 131.45 has ended, bring retest of this level, below there would extend the fall from 134.50 for a correction of early upmove to 131.00, then towards 130.50-60.
In view of this, we are holding on to our short position entered at 132.70. Above 133.10 would defer and suggest first leg of corrective decline from 134.50 top has ended, risk a stronger rebound to 133.50-60 but still reckon upside would be limited to 133.95-00, price should falter well below said last week’s high at 134.50, bring another selloff later.
Our latest preferred count is that wave (ii) is ABC-X-ABC which ended at 123.33 and wave (iii) is unfolding with wave iii ended at 100.77, followed by wave iv at 111.57 and wave v as well as the wave (iii) has ended at 97.04, followed by wave (iv) at 111.43 and wave (v) has ended at 94.12 which is also the end of the larger degree v, this also implied the major wave (C) has also ended there, hence major correction has commenced from there with (A) leg unfolding in its lower degree wave c which has possibly ended at 145.69. Under this count, A-B-C wave (B) has commenced with A leg ended at 136.23, wave B at 143.79 and wave C has possibly ended at 149.79.
Our larger degree count is that the decline from 139.26 is wave (C) and is sub-divided into a diagonal triangle i-ii-iii-iv-v with wave i - 105.44, wave ii- 123.33, wave iii - 97.03, wave iv - 111.43, followed by the final wave v as well as the end of wave (C) at 94.12, this also mark the bottom of larger degree wave B. Under this count, major rise in wave C has commenced as an impulsive wave with minor wave III ended at 145.69, wave V is still in progress for further gain to 150.00. Having said that, this so-called wave V could well be the first leg of larger degree 5-waver wave C and this wave C should bring at least a retest of wave A top at 169.97 (July 2008).
Trade Idea: AUD/USD – Hold short entered at 0.7720
AUD/USD – 0.7717
Original strategy:
Sold at 0.7720, Target: 0.7550, Stop: 0.7780
Position: - Short at 0.7720
Target: - 0.7550
Stop:- 0.7780
New strategy :
Hold short entered at 0.7720, Target: 0.7550, Stop: 0.7780
Position: - Short at 0.7720
Target: - 0.7550
Stop:- 0.7780
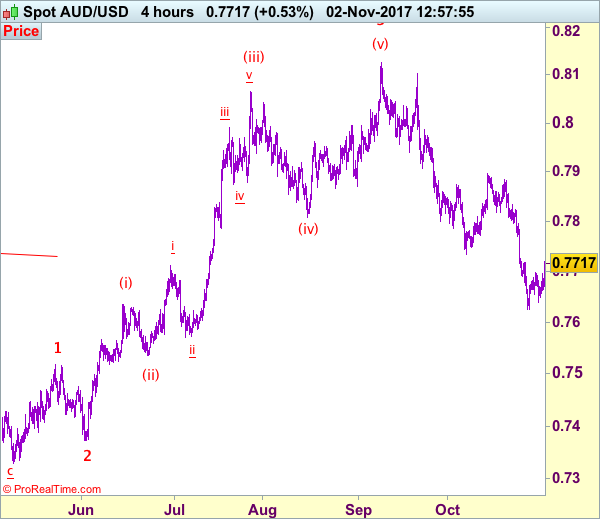
As aussie has rebounded again today, marginal gain from here cannot be ruled out, however, as this move from 0.7625 is viewed a retracement of recent decline (wave iv type), reckon upside would be limited to previous support at 0.7733 and bring another decline later, below support at 0.7660-65 would bring retest of 0.7625, break there would extend recent decline from 0.8125 top to 0.7600, having said that, loss of downward momentum should prevent sharp fall below 0.7550 and reckon 0.7500 would hold from here, bring rebound later.
In view of this, we are holding on to our short position entered at 0.7720. Above previous support at 0.7770 would defer and suggest a temporary low is possibly formed, bring rebound to 0.7800 and then towards 0.7825-35 later.
On the 4-hour chart, recent upmove from 0.7329 is unfolding as an impulsive rise with wave 3 as well as smaller degree wave (iii) extending, only minor wave v of (iii) has ended at 0.8125, hence bullishness remains for this move to extend headway to 0.8200, then towards 0.8300, however, reckon upside would be limited to 0.8400 and the final wave 5 should falter below 0.8500, bring correction later.
EUR/GBP Candlesticks and Ichimoku Analysis
Weekly
• Last Candlesticks pattern: N/A
• Time of formation: N/A
• Trend bias: Near term up
Daily
• Last Candlesticks pattern: Shooting star
• Time of formation: 29 Aug 2017
• Trend bias: Down
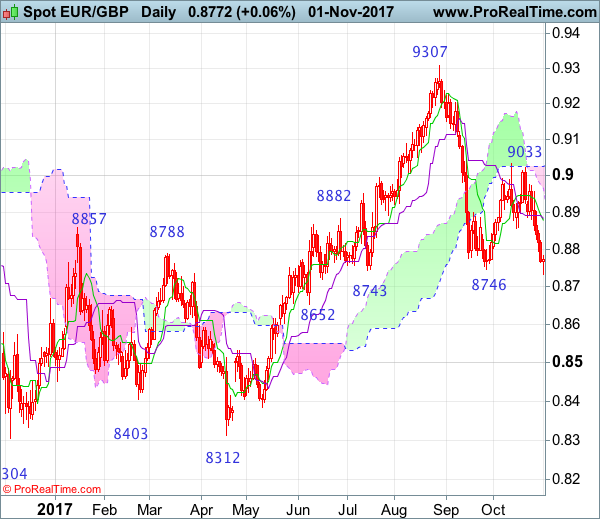
EURGBP – 0.8765
The single currency has continued to fall after breaking below previous support at 0.8856 and price finally penetrated previous chart support at 0.8746, signaling the decline from 0.9307 top is still in progress and may extend further weakness to 0.8690-95 (61.8% Fibonacci retracement of 0.8312-0.9307) and possibly towards previous support at 0.8652, however, near term oversold condition should prevent sharp fall below 0.8600, risk from there has increased for a rebound to take place later.
On the upside, whilst recovery to 0.8820-25 cannot be ruled out, reckon the Tenkan-Sen (now at 0.8894) would limit upside and bring another decline later. Above 0.8900-05 would defer and suggest low is possibly formed instead, bring a stronger rebound to 0.8955-60 but only break of resistance at 0.8976 would confirm and bring a stronger rebound towards resistance at 0.9033 which is likely to hold from here. Looking ahead, only a break of said resistance at 0.9033 would suggest the fall from 0.9307 has ended, then further gain to 0.9050-60 and possibly 0.9100-10 would follow but reckon upside would be limited and price should falter below 0.9203.
Recommendation: Stand aside for this week.
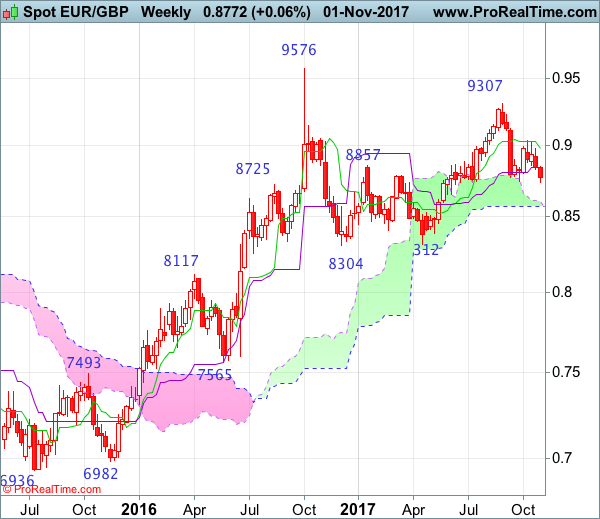
On the weekly chart, the single currency has dropped again and broke below previous support at 0.8746, signal another leg of corrective decline from 0.9307 top is in progress, hence downside bias is seen for this move to bring retracement of early upmove to 0.8690-95 (61.8% Fibonacci retracement of 0.8312-0.9307) and possibly support at 0.8562 but reckon downside would be limited to the lower Kumo (now at 0.8571) and previous resistance at 0.8531 should turn into support and contain euro’s downside.
On the upside, expect recovery to be limited to 0.8820-25 and this week’s high at 0.8849 should hold, bring another decline. Above the Kijun-Sen (now at 0.8846) would bring test of the Tenkan-Sen (now at 0.8980) but break there is needed to signal low is formed instead, bring a stronger rebound to 0.9023-33 resistance. Only a break of indicated resistance at 0.9033 would suggest the retreat from 0.9307 has possibly ended, bring recovery to 0.9060-70 and then 0.9120-25 but upside should be limited to 0.9203 and price should falter well below 0.9307, bring another leg of decline in later part of Q4.
EUR/CHF Candlesticks and Ichimoku Analysis
Weekly
• Last Candlesticks pattern: Long white candlestick
• Time of formation: 24 Jul 2017
• Trend bias: Up
Daily
• Last Candlesticks pattern: Morning doji
• Time of formation: 25 Jul 2017
• Trend bias: Up
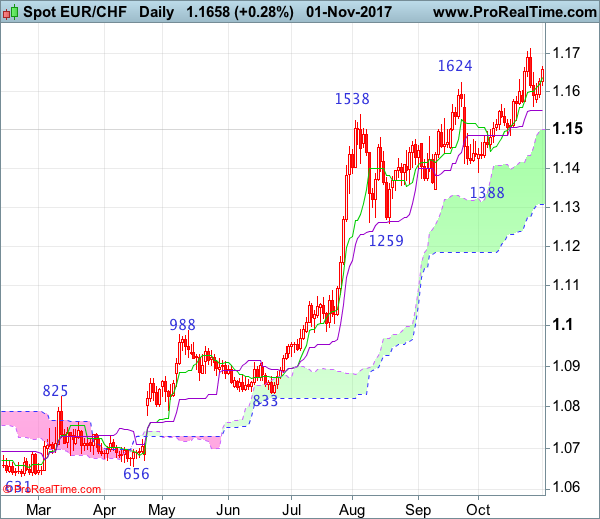
EUR/CHF – 1.1631
As the single currency has retreated after rising to 1.1713, suggesting consolidation below this level would be seen, however, reckon downside would be limited to the Kijun-Sen (now at 1.1551) and bring another rise later, above said resistance at 1.1713 would extend recent upmove to 1.1770-80, then 1.1800-10, having said that, loss of upward momentum should prevent sharp move beyond 1.1850-60 and reckon 1.1900 would hold from here, risk from there is seen for a retreat to take place later.
On the downside, expect pullback to be limited to 1.1600 and the Kijun-Sen (now at 1.1551) should hold, bring another rise later. A daily close below the Kijun-Sen would defer and suggest a temporary top has possibly been formed instead, bring weakness to 1.1520-25 but only break of 1.1485 support would confirm and bring retracement of recent rise to 1.14225-30, then towards support at 1.1388 which is likely to hold form here.
Recommendation: Hold long entered at 1.1600 for 1.1800 with stop below 1.1500.
On the weekly chart, despite last week’s rise to 1.1713, lack of follow through buying and the subsequent retreat formed a doji star, hence minor consolidation below this level would be seen and pullback to the Tenkan-Sen (now at 1.1529) cannot be ruled out before prospect of another rally, above said resistance at 1.1713 would extend medium term upmove from 0.8426 low to 1.1760-70, then 1.1800-10 but overbought condition should prevent sharp move beyond 1.1840-50 and reckon 1.1900-10 would hold, price should falter well below 1.2000, risk from there has increased for a retreat to take place later.
On the downside, whilst pullback to 1.1570-75 cannot be ruled out, reckon the Tenkan-Sen (now at 1.1529) would limit downside and bring another rise later to aforesaid upside targets. Only below support at 1.1485 would defer and suggest a temporary top is formed, bring retracement of recent rise towards support at 1.1388, below there would provide confirmation, then further fall to 1.1345 support would follow. Looking ahead, once this level is penetrated, this would turn outlook bearish for further subsequent decline to 1.1300, then towards another previous support at 1.1259.
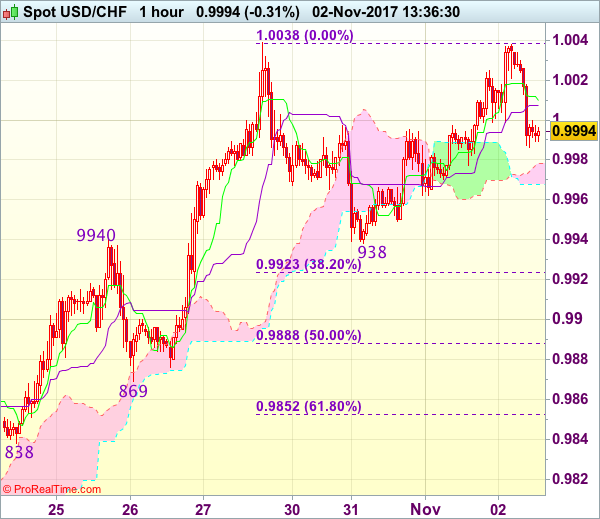
Trade Idea : USD/CHF – Buy at 0.9950
USD/CHF - 0.9991
Most recent candlesticks pattern : N/A
Trend : Up
Tenkan-Sen level : 1.0010
Kijun-Sen level : 1.0008
Ichimoku cloud top : 0.9978
Ichimoku cloud bottom : 0.9968
Original strategy :
Buy at 0.9980, Target: 1.0080, Stop: 0.9945
Position : -
Target : -
Stop : -
New strategy :
Buy at 0.9950, Target: 1.0050, Stop: 0.9915
Position : -
Target : -
Stop : -
As the greenback has retreated after faltering below indicated resistance at 1.0038, retaining our view that consolidation below this level would be seen and test of the lower Kumo (now at 0.9968) cannot be ruled out, however, reckon downside would be limited to 0.9950 and bring another rise later. A break of said resistance at 1.0038 would confirm recent upmove from 0.9421 low has resumed and may extend further gain to 1.0050-55, then towards 1.0075-80 but price should falter below 1.0100 resistance.
In view of this, we are looking to buy dollar again on further subsequent pullback as 0.9950 should limit downside, bring another rise later. Below said support at 0.9938 would abort and signal top is formed instead, risk correction to 0.9920-23 (38.2% Fibonacci retracement of 0.9737-1.0038) but 0.9885-90 (50% Fibonacci retracement) should limit downside and support at 0.9869 would reman intact.