
Sample Category Title
USD/JPY Mid-Day Outlook
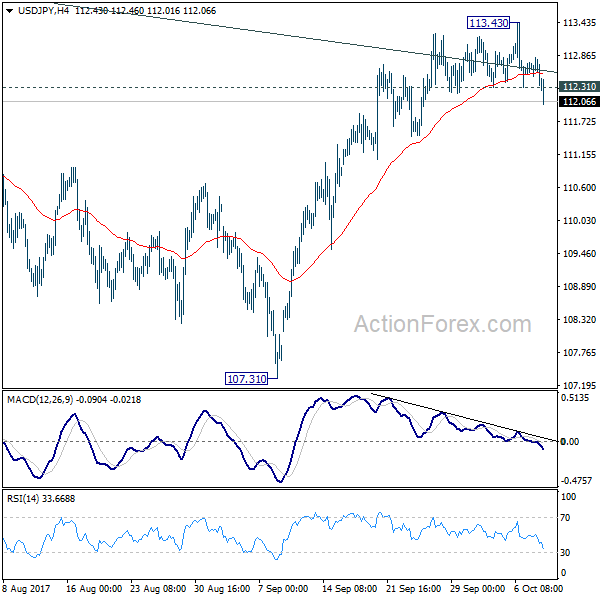
Daily Pivots: (S1) 112.34; (P) 112.88; (R1) 113.17; More...
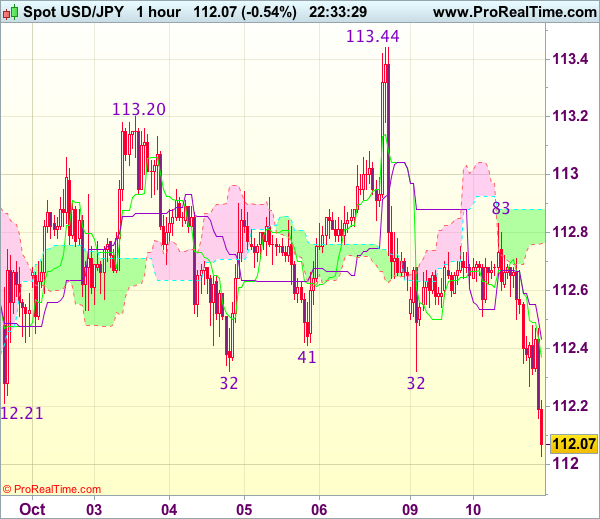
USD/JPY's strong break of 112.31 minor support argues that a short term top is formed at 113.43, on bearish divergence condition in 4 hour MACD. Also, this suggests that the pair is rejected by medium term channel resistance. Intraday bias is turned back to the downside for 55 day EMA (now at 111.26 first). Sustained break there will bring retest of 107.31. For now, risk will stays on the downside as long as 113.43 resistance holds.
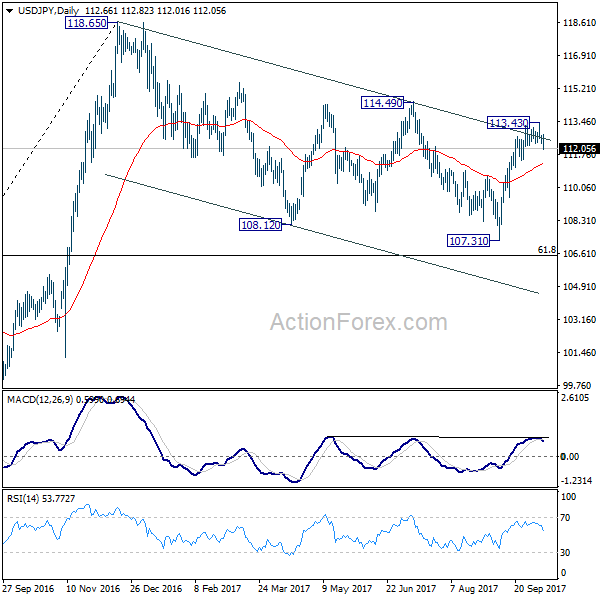
In the bigger picture, rise from 98.97 (2016 low) is seen as the second leg of the corrective pattern from 125.85 (2015 high). It's unclear whether this this second leg has completed at 118.65 or not. But medium term outlook will be mildly bearish as long as 114.49 resistance holds. And, there is prospect of breaking 98.97 ahead. Meanwhile, break of 114.49 will bring retest of 125.85 high. But even in that case, we don't expect a break there on first attempt.
Trade Idea Wrap-up: EUR/USD – Buy at 1.1740
EUR/USD - 1.1806
Most recent candlesticks pattern : N/A
Trend : Near term up
Tenkan-Sen level : 1.1787
Kijun-Sen level : 1.1768
Ichimoku cloud top : 1.1721
Ichimoku cloud bottom : 1.1718
Original strategy :
Buy at 1.1720, Target: 1.1820, Stop: 1.1685
Position : -
Target : -
Stop : -
New strategy :
Buy at 1.1740, Target: 1.1840, Stop: 1.1705
Position : -
Target : -
Stop : -
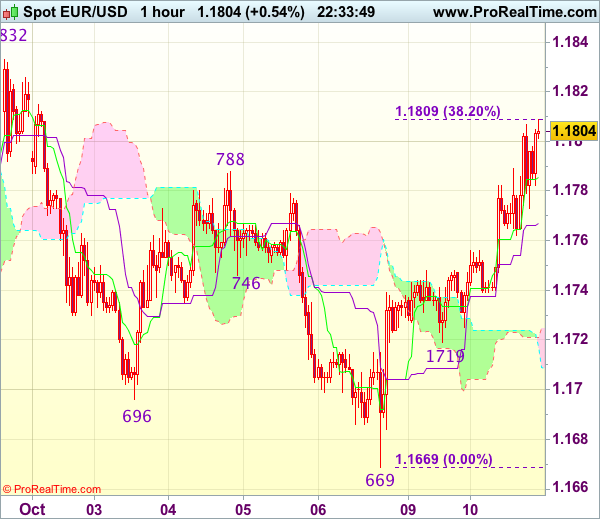
As the single currency surged again after brief pullback to 1.1719, adding credence to our view that a temporary low has possibly been formed at 1.1669 last week and consolidation with upside bias remains for the rebound from there to bring retracement of recent decline towards resistance at 1.1832, however, near term overbought condition should limit upside to 1.1850-55 (50% Fibonacci retracement of 1.2035-1.1669), bring retreat later.
In view of this, would not chase this rise here and we are still looking to buy euro on dips as 1.1740 should limit downside and bring another rebound. Only break of said support at 1.1719 would abort and signal an intra-day top is formed, risk weakness to 1.1695-00 but indicated strong support at 1.1662-69 should remain intact.
USD/CHF Mid-Day Outlook
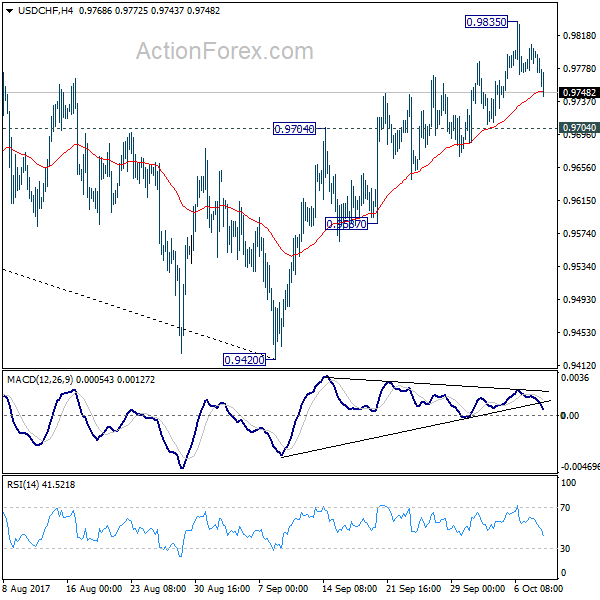
Daily Pivots: (S1) 0.9775; (P) 0.9791; (R1) 0.9812; More....
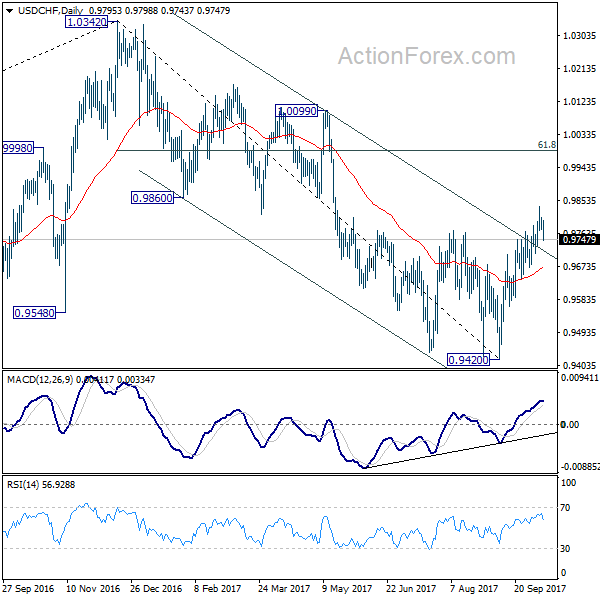
Intraday bias in USD/CHF is turned neutral for consolidation below 0.9835 temporary top. With 0.9704 resistance turned support intact, further rise is expected. We're favoring the whole down trend form 1.0342 has completed after defending 0.9443 key support again. Further rise would be seen to 61.8% retracement of 1.0342 to 0.9420 at 0.9990. However, break of 0.9704 will mix up this bullish outlook and turn bias back to the downside for 0.9587 support instead.
In the bigger picture, current development suggests that USD/CHF has defended 0.9443 (2016 low) key support level again. Rise from 0.9420 could develop into a medium term move and target a test on 1.0342 high. This represents the upper end of a long term range that started back in 2015. On the downside, break of 0.9587 support is now needed to indicate completion of the rise from 0.9420. Otherwise, further rally will remain in favor in medium term.
GBP/USD Mid-Day Outlook
Daily Pivots: (S1) 1.3083; (P) 1.3134; (R1) 1.3192; More....
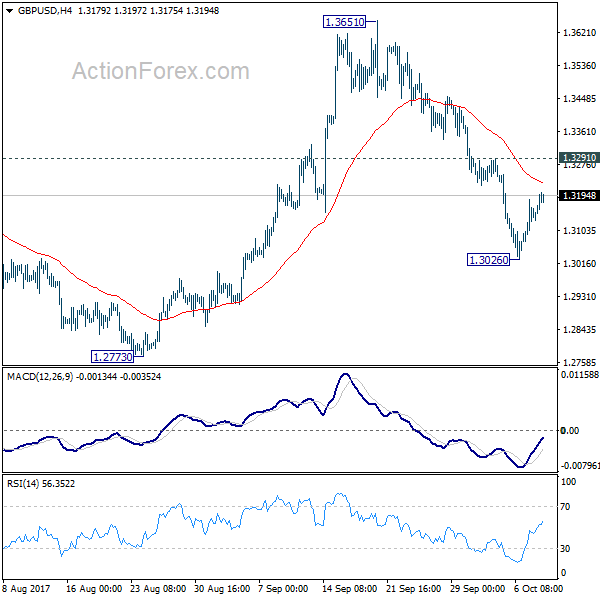
Intraday bias in GBP/USD remains neutral for consolidation above 1.3026 temporary low. At this point, deeper fall is mildly in favor as long as 1.3291 minor resistance holds. Below 1.3026 will target 1.2773 key support level. Decisive break there will affirm the bearish case of medium term reversal. Nonetheless, break of 1.3291 will suggest that the pull back from 1.3651 is completed and turn bias back to the upside.
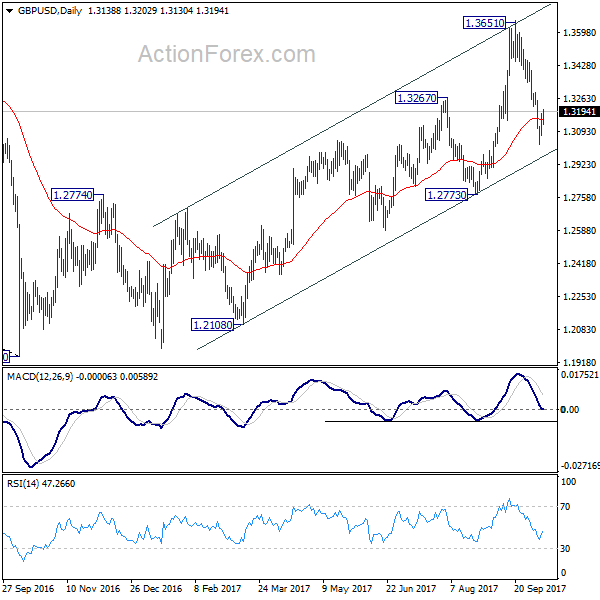
In the bigger picture, while the medium term rebound from 1.1946 was strong, GBP/USD hit strong resistance from the long term falling trend line. Outlook is turned a bit mixed and we'll turn neutral first. On the downside, decisive break of 1.2773 key support will argue that rebound from 1.1946 has completed. The corrective structure of rise from 1.1946 to 1.3651 will in turn suggest that long term down trend is now completed. Break of 1.1946 low should then be seen. On the upside, break of 1.3835 support turned resistance will revive the case of trend reversal and target 38.2% retracement of 2.1161 (2007 high) to 1.1946 (2016 low) at 1.5466 .
Trade Idea Wrap-up: USD/JPY – Sell at 112.65
USD/JPY - 112.05
Most recent candlesticks pattern : N/A
Trend : Up
Tenkan-Sen level : 112.37
Kijun-Sen level : 112.43
Ichimoku cloud top : 112.88
Ichimoku cloud bottom : 112.76
Original strategy :
Sell at 113.10, Target: 112.10, Stop: 113.45
Position : -
Target : -
Stop : -
New strategy :
Sell at 112.65, Target: 111.65, Stop: 113.00
Position : -
Target : -
Stop : -
As dollar’s intra-day decline has gathered momentum after breaking support at 112.32, suggesting the fall from last week’s high of 113.44 is still in progress, bearishness remains for this move to extend weakness to 111.75-80, then towards 111.47 support but near term oversold condition would limit downside today and reckon 111.11 support would remain intact.
In view of this, we are looking to sell dollar on recovery as 112.60-65 should limit upside and bring another decline. A break of resistance at 112.83 would abort and signal low is formed, bring a stronger rebound to 113.10-20 but price should falter well below said last week’s high at 113.44.
Yen Improves to 2-Week High as Japanese Current Surplus Jumps
USD/JPY has recorded losses in the Tuesday session. In North American trade, the pair is trading at 112.15, down 0.47% on the day. On the release front, Japan's current surplus improved to JPY 2.27 trillion, easily beating the estimate of JPY 1.98 trillion. Japanese Economy Watchers Sentiment improved to 51.3, beating the estimate of 49.9 points. On Wednesday, the US releases JOLTS Job Openings and the Federal Reserve releases the minutes of the September policy meeting.
Japanese numbers have started the week on a positive note. The current account surplus climbed to JPY 2.27 trillion, the highest monthly surplus since 2007. As well, Economy Watchers Sentiment pushed above the 50-point line, with a reading of 51.3 points. This release points to optimism from workers regarding economic conditions. Japan's economy has rebounded in 2017, boosted by a weak yen and strong global demand for Japanese products. Still, chronically weak inflation remains a sore point, and the Bank of Japan has acknowledged that it doesn't expect its inflation target of just below 2.0% percent to be reached before 2020. On Tuesday, a BoJ report gave a thumbs-up to the economy, noted that exports were strong and consumer spending and construction had strengthened. BOJ Governor Haruhiko Kuroda reiterated a familiar message on Tuesday, saying that the bank will continue its ultra-loose stimulus program until inflation moves above its target of 2 percent.
The Federal Reserve did not raise rates at the September meeting, but the markets are clearly expecting one final rate hike in December. According to CME FedWatch, the odds of a December rate hike are currently at 86%, compared to just 31% a month ago. Why the huge turnaround? A strong US economy has helped raise the odds, but the primary reason for the huge shift in market sentiment can be attributed to the Fed policymakers that have come out in support of a rate hike, notably Fed Chair Janet Yellen. The lack of inflation remains the most significant impediment to raising rates, but Yellen and other FOMC members have insisted that strong economic conditions will lead to higher inflation levels. Even if inflation does not move higher before 2018, the Fed now appears ready to press the rate trigger.
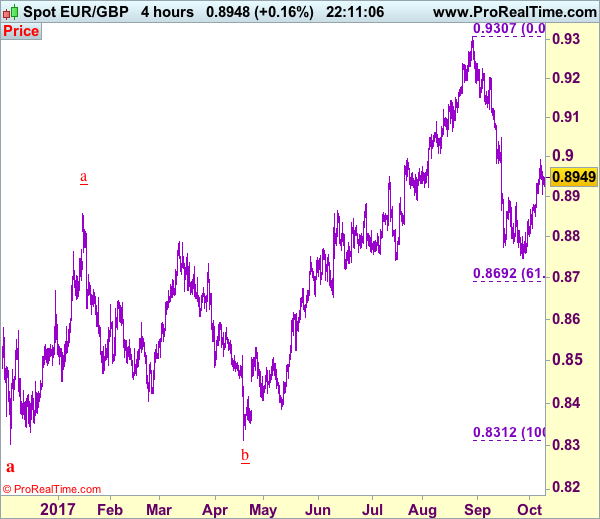
Trade Idea: EUR/GBP – Hold short entered at 0.8930
EUR/GBP - 0.8947
Original strategy :
Sold at 0.8930, Target: 0.8750, Stop: 0.8970
Position : - Short at 0.8930
Target : - 0.8750
Stop : - 0.8970
New strategy :
Hold short at 0.8930, Target: 0.8750, Stop: 0.8970
Position : - Short at 0.8930
Target : - 0.8750
Stop : - 0.8970
Euro’s near term sideways trading is expected to continue and as long as indicated level at 0.8970 holds, prospect of another retreat remains, below support at 0.8850 would signal top is formed, bring further fall to 0.8820-25 but break of 0.8800-05 is needed to signal the rebound from last month’s low at 0.8746 has ended, then subsequent decline to 0.8770 would follow.
In view of this, we are holding on to our short position entered at 0.8930. Above said resistance at 0.8970 would signal the rise from 0.8746 low is still in progress for retracement of early decline to psychological resistance at 0.9000 but reckon previous resistance at 0.9048 would remain intact.
Our preferred count is that, after forming a major top at 0.9805 (wave V), (A)-(B)-(C) correction is unfolding with (A) leg ended at 0.8400 (A: 0.8637, B: 0.9491 and 5-waver C ended at 0.8400. Wave (B) has ended at 0.9413 and impulsive wave (C) has either ended at 0.8067 or may extend one more fall to 0.8000 before prospect of another rally. Current breach of indicated resistance at 0.9043 confirms our view that the (C) leg has ended and bring stronger rebound towards 0.9150/54, then towards 0.9240/50.
Home Starts Pull Back in September, But Beat Expectations
Canadian housing starts pulled back to 217k in September, but beat expectations for a larger decrease to 210k. This performance comes after two months of mid-220k performance with August starts revised up slightly to 226k.
The single family segment (+5k) increased on the month with multifamily starts in large CMAs accounting for the entire decrease (-16k) on the month. Rural homebuilding also rose (+2k).
Provincially, the losses were concentrated in Ontario (-18k), which had the worst month since May, while Quebec (+2k), B.C. (+2k), and Atlantic Canada (+4k) saw faster pace of homebuilding. In the Prairies, the pace was largely unchanged (-1k) with gains in Alberta more than offset by losses in the other two provinces.
Activity in Toronto, the country's most closely-watched housing market, fell nearly 19k to 35k - the slowest pace in four months. Vancouver also decreased, falling by 3k to 19k - the lowest pace since January. On the other hand, starts in Montreal more than doubled to 36k - the fastest pace in two years.
Key Implications
Today's report is a bit of mixed bag, with starts pulling back, but remaining above expectations and the decline concentrated in the volatile multifamily starts. While starts in Toronto remain under close watch, given past regulatory changes, the overall market appears to be taking higher interest rates in stride and remains healthy.
While Ontario was behind much of the weakness in September, provincial housing starts for the third quarter are at the second highest level (after the red-hot first-quarter) in more than five years. This suggests that so far, the market is adjusting well to the provincial Fair Housing Plan that injected some uncertainty in previous months.
All in all, we expect Canadian housing starts to tick up in the following month, given multifamily volatility, but begin to trend lower toward the end of the year and fall below 200k during 2018 as the effects of rising interest rates bite (another BoC hike is still likely later this year) while potential new B20 regulation from OSFI may further weigh on demand.
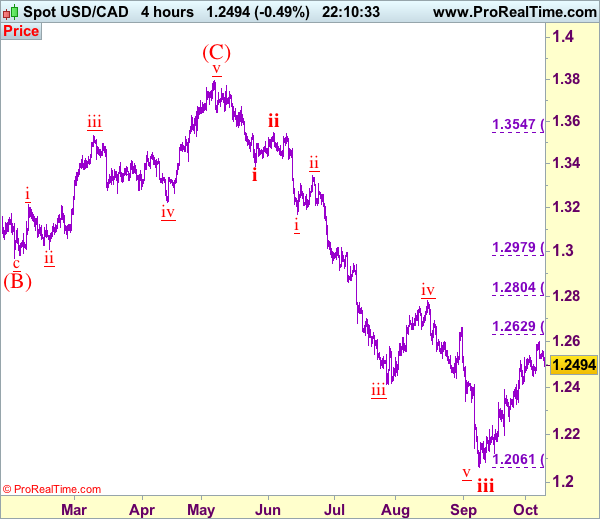
Trade Idea: USD/CAD – Buy at 1.2415
USD/CAD - 1.2493
Trend: Down
Original strategy :
Buy at 1.2415, Target: 1.2600, Stop: 1.2355
Position: -
Target: -
Stop: -
New strategy :
Buy at 1.2415, Target: 1.2600, Stop: 1.2355
Position: -
Target: -
Stop:-
As the greenback has retreated after rising to 1.2599 late last week, suggesting consolidation below this level would be seen and pullback to 1.2445-50 cannot be ruled out, however, reckon previous support at 1.2415 would hold and bring another rise later, above 1.2555-60 would signal the pullback from 1.2599 has ended, bring retest of this level, break there would extend the rise from 1.2061 low (wave iii trough) towards previous resistance at 1.2663 but overbought condition should limit upside to 1.2700 and price should falter well below another previous resistance at 1.2778.
In view of this, would not chase this rise here and would be prudent to buy again on pullback as 1.2410-15 should limit downside. Below 1.2395-00 would bring correction back to 1.2350-55 but reckon indicated support at 1.2313 would hold. Only a drop below 1.2313 would abort and signal the aforesaid rise from 1.2061 has ended, bring further fall to 1.2254 support, however, reckon downside would be limited to another previous support at 1.2197, bring rebound later. We are keeping our count that wave v as well as wave (C) ended at 1.3794 and impulsive wave (i ii, i ii) is now unfolding with minor wave iii ended at 1.2414, followed by wave iv correction ended at 1.2778, wave v has reached our indicated downside target at 1.2100 and may extend to 1.2000.
To recap, wave B from 1.3066 is unfolding as an a-b-c and is sub-divided as a: 1.2192, b: 1.2716 and wave c is a 5-waver with i: 1.1983, ii: 1.2506, extended wave iii with minor iii at 1.0206, wave iv ended at 1.0781 and wave v as well as wave iii has ended at 0.9931, hence the subsequent choppy trading is the wave iv which is unfolding as (a)-(b)-(c) with (a) leg of iv ended at 1.0854, followed by (b) leg at 1.0108 and (c) leg as well as the wave iv ended at 1.0674. The wave v is sub-divided by minor wave (i): 0.9980, (ii): 1.0374, (iii): 0.9446, (iv): 0.9913 and (v) as well as v has possibly ended at 0.9407, therefore, consolidation with upside bias is seen for major correction, indicated target at 1.3700 and 1.4000 had been met and further gain to 1.4700 would be seen later.
Canadian Housing Starts Remain Strong in the Face of Slower Resales
Highlights:
- Housing starts slipped to a still-strong 217k annualized units in September from 226k in August. The year-to-date average of 217k is well above 2016's 198k pace.
- The decline was in multi-unit starts although that component still posted its strongest quarterly pace on record in Q3. Single-unit starts picked up to a six-month high in September.
- On a regional basis, Ontario accounted for almost all of the monthly decline with starts pulling back following three consecutive monthly gains.
- In a separate report, building permits fell to 214k annualized units in August from 235k in July.
Our Take:
It was a busy summer for Canadian homebuilders with another 217k annualized housing starts in September capping off a strong Q3. Ontario finally saw a moderation in starts in September although it would be a bit of a stretch to attribute it to the recent slowing in resales - the province's quarterly pace of housing starts was still the second-fastest in a decade. Meanwhile, starts remain elevated in other areas of the country that haven't seen declines on the resale side. The upshot is that housing starts at the national level are running at their strongest pace in a decade through nine months this year - and well above most estimates of the underlying household formation rate. We continue to believe the recent pace won't be sustained. However, with permit issuance remaining relatively strong in August, it may be a few months yet before we see a more trend-like pace of homebuilding emerge.