Sample Category Title
USD/CHF Ready For Another Leg Higher
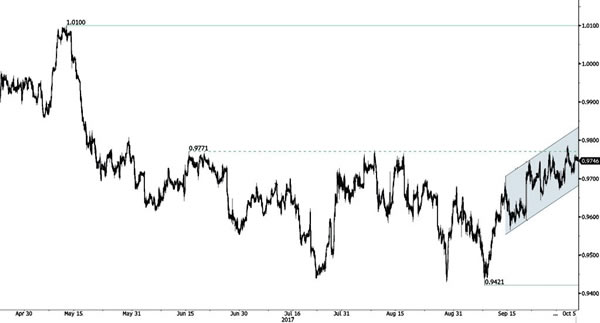
USD/CHF is trading higher within short-term uptrend channel. Yet, demand is has been increasing since September. Closest resistance is given at 0.9808 (30/05/2017 high). There are nonetheless decent downside risks. Strong support is given at 0.9421 (03/05/2017). Expected to show bullish pressures.
In the long-term, the pair is still trading in range since 2011 despite some turmoil when the SNB unpegged the CHF. Key support can be found 0.8986 (30/01/2015 low). The technical structure favours nonetheless a long term bullish
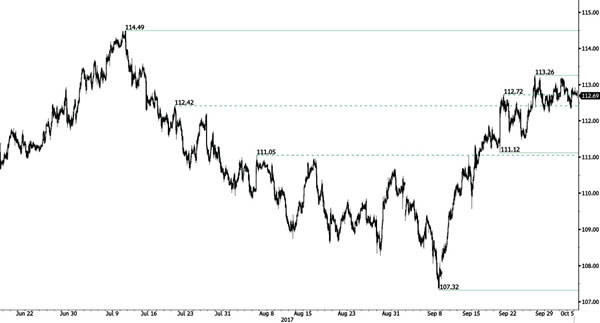
USD/JPY Stalling Below Resistance Area
USD/JPY is trading mixed. Strong support is located at a distance at 111.12 (20/09/2017 low). The pair is still located into a medium-term bullish trend. Yet, downside risks are rising as markets may soon take some short-term profit.
We favor a long-term bearish bias. Support is now given at 99.02 (10/08/2013 low). A gradual rise towards the major resistance at 125.86 (05/06/2015 high) seems unlikely. Expected to decline further support at 93.79 (13/06/2013 low).
GBP/USD Continues To Ride Downtrend Channel
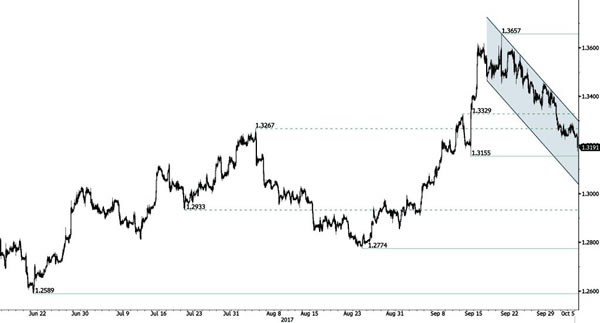
GBP/USD is pushing lower since the pair has topped 1.3657 (20/09/2017 high). The pair is going towards hourly support is given at 1.3155 (14/09/2017 low). Expected to show continued bearish pressures within downtrend channel.
The long-term technical pattern is reversing. The Brexit vote had paved the way for further decline. Long-term support can be found at 1.1841 (07/10/2017 low). Long-term resistance given around 1.35 is at stake and indicates a long-term reversal in the negative trend. Yet, it is very unlikely at the moment.
EUR/USD Weak Buying Pressures
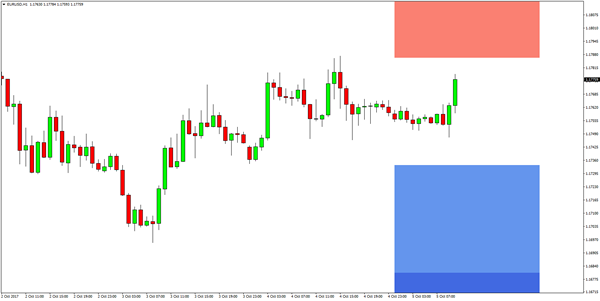
EUR/USD is way into a bearish trend. Hourly resistance can be found at 1.1833 (29/09/2017 high). Strong support is given at a distance at 1.1662 (17/08/2017 low). Expected to show continued short-term bearish pressures.
In the longer term, the momentum is now turning largely positive. We favour a continued bullish bias. Key resistance is holding at 1.2252 (25/12/2014 high) while strong support lies at 1.0341 (03/01/2017 low).
GBP/JPY Hit Another Downside Target
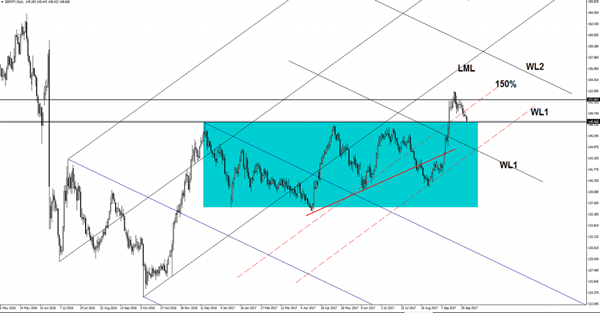
The GBP/JPY has finally reached the 148.46 horizontal support as predicted. Is strongly bearish on the short term, a valid breakdown will announce a further drop and will bring us a great selling opportunity. The next major downside target will be at the first warning line (WL1) of the ascending pitchfork.
GBP/USD Very Heavy
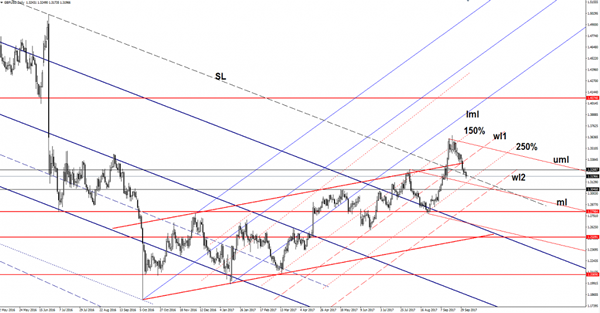
Price drops further on the short term and should hit the 250% Fibonacci line (ascending dotted line), which represents a strong dynamic support. I’ve said in the previous days that the rate is expected to be attracted also by the median line (ml) of the minor red descending pitchfork, a breakdown below the mentioned support levels will confirm a larger drop.
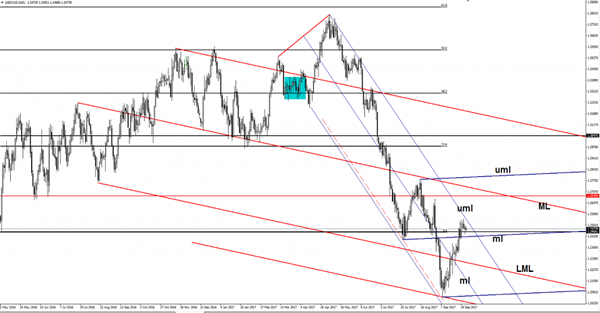
USD/CAD Consolidating The Lates Gains
The USD/CAD increased a little today and continues to stay in the green zone, but needs a bullish spark to be able to climb much higher in the upcoming period. Price decreased a little in the previous days, but this could be only temporary. It could retest also the median line (ml) of the blue ascending pitchfork and could resume the upside movement.
USD/CAD tries to increase a little today as the USDX is fighting hard to stay higher and near the 93.81 horizontal resistance. The US and the Canadian data should bring life on the USD/CAD in the afternoon, the fundamental data will take the lead. The Canadian Trade Balance could increase a little from -3.0B to -2.6B, a lower deficit will lift the Loonie. On the other hand, the US trade deficit could decrease from 43.7B to 42.7B, which is very good for the USD, the Unemployment Claims are expected to drop from 272K to 266K, while the Factory Orders could increase by 1.0% versus a 3.3% drop in the former reading period.
Price decreased a little after the failure to reach and retest the upper median line (uml) of the minor descending pitchfork, but only a valid breakdown below the 1.2460 and below the median line (ml) of the blue ascending pitchfork will confirm a further drop. A valid breakout from the minor descending pitchfork will validate an increase towards the 1.2678 level.
CPI Surprises To The Upside, Catalan Crisis Still Weighs On EUR
Swiss CPI surprises to the upside
Switzerland's consumer price index rose more than expected during the month of September as it increases 0.7% year-over-year as it reached 100.9 points, beating slightly median expectations of a 0.6% increase. On a month-over-month basis, the headline gauge rose 0.2%, matching expectation. The price increase was mostly driven by a price rise for clothing and footwear (+7.4%y/y).
The Swiss franc held steady following the release of the data. EUR/CHF rose a few pips to 1.1483 before reversing gains. USD/CHF did not react at all as the pair is mostly driven by development in the US, with ongoing speculation regarding Yellen's potential replacement and Nonfarm payroll figures due for release tomorrow.
From our standpoint, the fact that the euro was able to hold recent gains against the Swiss franc suggests that investors are definitely not worried with the Catalan situation. Regarding the upside surprise in inflation reading, it could be tempting to conclude that the SNB will have to adjust its monetary policy as inflation pressures finally pick-up. In addition, we are still far from the SNB's 2% inflation target, there is therefore plenty of room before calling for a tighter monetary policy.
Long USDJPY
Sentiment around the USDJPY remains negative causing the par drift down to 112.35 yesterday. Yet, outlook supports a higher USDJPY. Recent election news has been causing JPY volatility. News that the popular Tokyo governor Koike would not stand as a candidate for PM should have weaken JPY but has a muted effect. There has been a general rise in support for Abe and his LDP party according to polls, shifting away from upstarts and historical opponents. Moving forward we expect the LDP will further strength control of the 465 seat parliament.
The increase probably of Abe remaining to drive Japanese policy suggest that “Abenomics” and the systematic debasing of the JPY will continue. However, given the exhausted tools accessible the BoJ external factors are more likely to drive JPY pricing. In this regard, our base scenario is a USD rally in the short-term. Our thinking based on growing risk in Catalonia Spain and underpricing of Fed policy path (65% probably for a 25bp rate hike in Dec). We remain constructive on USDJPY with expectations for extension of bullish rally to 114.35.
Catalan political crisis weighs on euro bulls
Benoit Coeuré, a ECB member, will speak on Thursday in a panel in Frankfurt and the accounts of the September ECB meeting will be published today. We believe that the panel's discussion will be mostly on the size of the potential reduction of the ECB balance sheet starting in January. We continue to consider that markets are way too optimistic regarding this asset purchase reduction. Markets have sent the euro too high at the moment. Yet, the momentum, which is pausing at the moment, will likely be back on ECB meeting expectations as soon as we get closer to the meeting date which will be held the 26th of October.
The Eurodollar is pausing at the moment below 1.18. Catalonian uncertainties have not clearly weighed on the pair price. We nonetheless believe that bulls have been reduced. Catalonia will declare its independence in a matter of days have declared a Catalan leader. Tensions are then likely to increase and political risks will definitely add downside pressures on the single currency. Markets have not priced in yet any deep consequences of this independence.
Volatility is set to increase, a euro sell-off may be triggered by the Catalonian crisis. Yet, one should not forget the high expectations from the ECB.
EUR/GBP Strong Marubozu Candle Cues For Continuation
The EUR/GBP has recently made an upside breakout from the PPR channel, signalled by a strong Marubozu candle that could provide a continuation of uptrend towards 0.8950 and 0.8980. However, traders need to pay attention towards possible retracement as I showed in High Volatility trading video that is a part of Price Action Trading School. 0.8880-90 is the POC zone (D H4, order block, 61.8, ATR pivot, trend line) but also pay attention to 0.8906 that could reject the price too. As lons as the EUR/GBP is above 0.8850, we have a strong intraday/week uptrend.
W L3 - Weekly Camarilla Pivot (Weekly Interim Support)
W H3 - Weekly Camarilla Pivot (Weekly Interim Resistance)
W H4 - Weekly Camarilla Pivot (Strong Weekly Resistance)
D H4 - Daily Camarilla Pivot (Very Strong Daily Resistance)
D L3 – Daily Camarilla Pivot (Daily Support)
D L4 – Daily H4 Camarilla (Very Strong Daily Support)
PPR - Progressive Polynomial Channel
AP -Andrew's Pitchfork
POC - Point Of Confluence (The zone where we expect price to react aka entry zone)
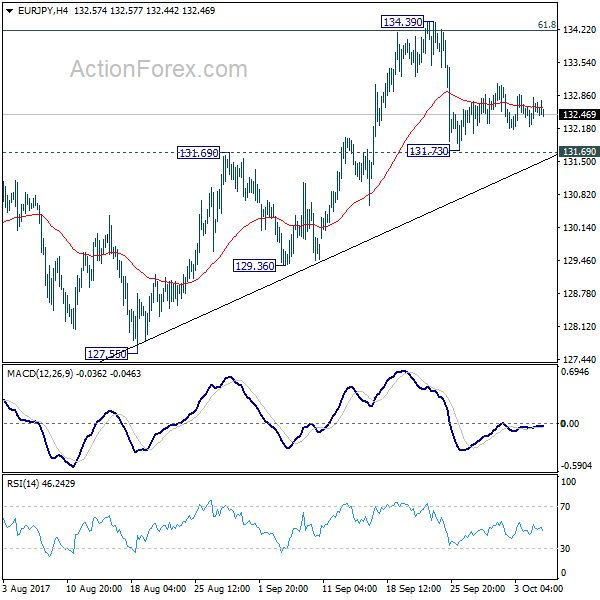
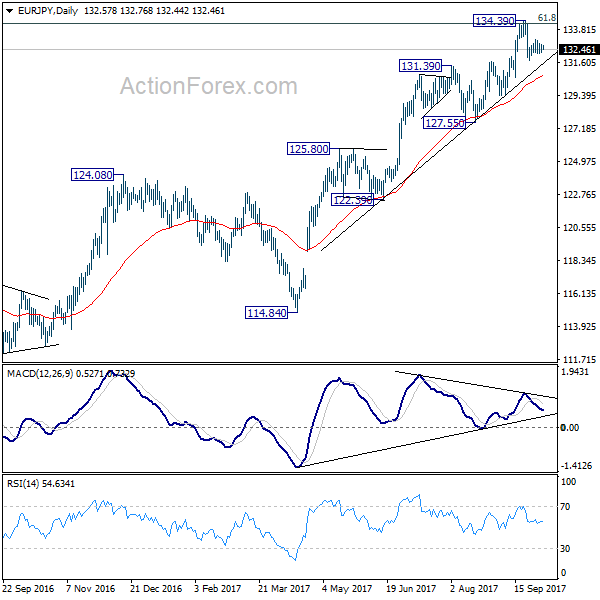
EUR/JPY Daily Outlook
Daily Pivots: (S1) 132.28; (P) 132.55; (R1) 132.87; More...
Intraday bias in EUR/JPY remains neutral for consolidative trading below 134.39 high. Near term outlook remains bullish as long as 131.69 holds. Sustained break of 134.20 fibonacci level will extend larger up trend to 141.04 resistance next. However, break of 131.69 will be an early sign of medium term reversal and will target 127.55 key support level instead.
In the bigger picture, current rise from 109.03 is seen as at the same degree as the down trend from 149.76 (2014 high) to 109.03 (2016 low). 61.8% retracement of 149.76 to 109.03 at 134.20 is already met. Sustained break there will pave the way to key long term resistance zone at 141.04/149.76. On the downside, break of 127.55 support is needed to be the first signal of medium term reversal. Otherwise, outlook will remain bullish.