
Sample Category Title
USD/CHF Weekly Outlook
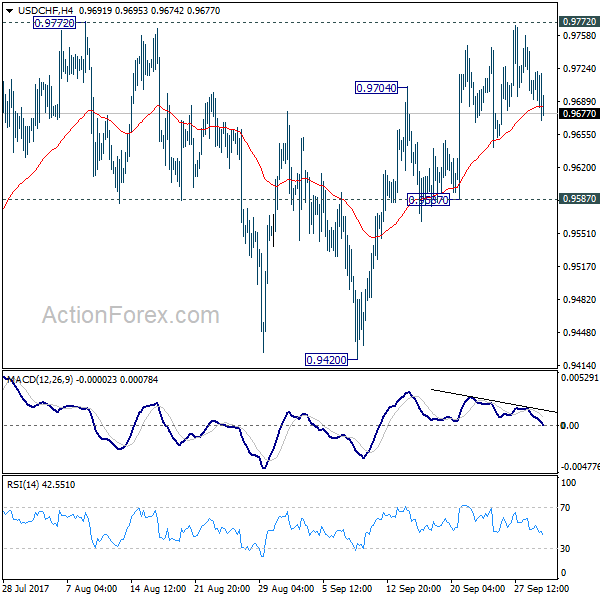
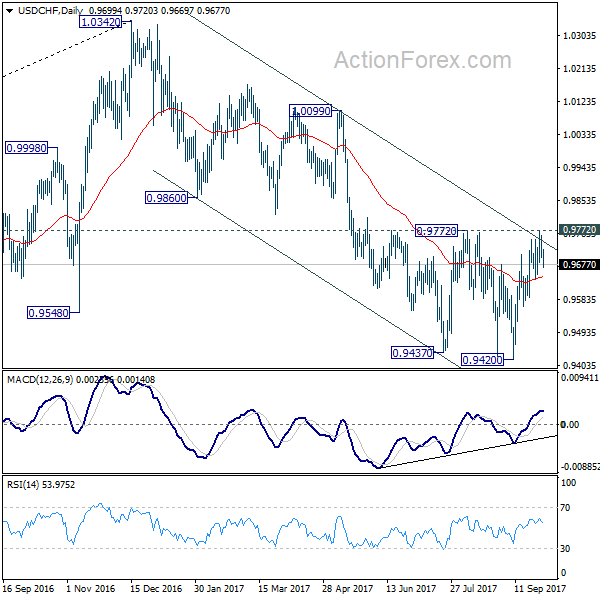
USD/CHF edged higher to 0.9769 last week but failed to take out 0.9772 key near term resistance. Also, upside was limited below 55 week EMA (now at 0.9777). Initial bias remains neutral this week first. On the upside, decisive break of 0.9772 will suggest that whole down trend form 1.0342 has completed after defending 0.9443 key support again. That would also complete a double bottom pattern (0.9437, 9420). In that case, near term outlook will be turned bullish for 0.9860/1.0099 resistance zone first. Nonetheless, with 0.9772 resistance intact, outlook remains bearish. Below 0.9587 minor support will turn bias back to the downside for retesting 0.9420 low.
In the bigger picture, focus remains on whether 0.9443 key support (2016 low) would be taken out firmly as down trend from 1.0342 extends. There are various interpretation of the price actions. But in any case, medium term outlook will stay bearish as long as 0.9772 resistance holds. Current down trend could extend to 38.2% retracement of 0.7065 (2011 low) to 1.0342 (2016 high) at 0.9090. However, break of 0.9772 will indicate that USD/CHF has successfully defended 0.9443 again and turn outlook bullish for 1.0099 resistance.
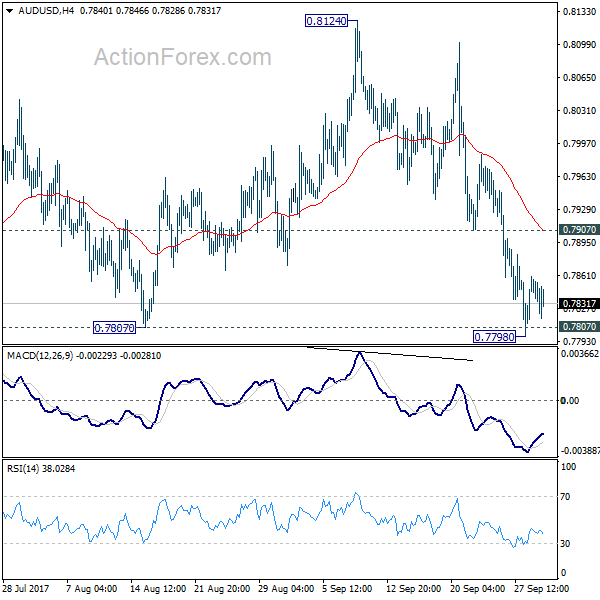
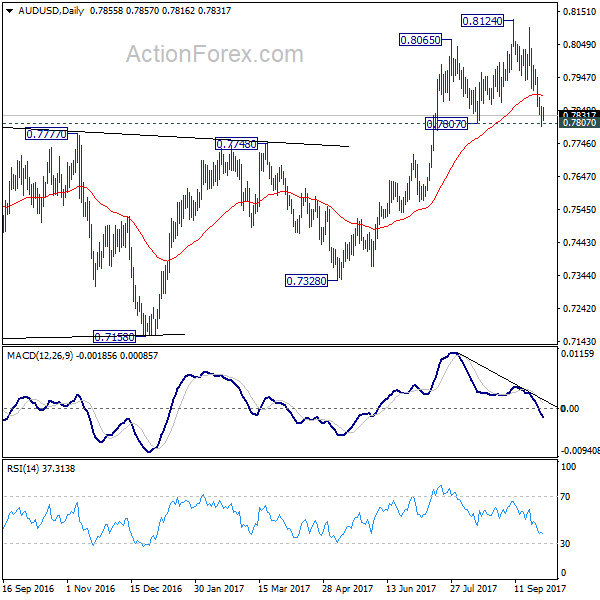
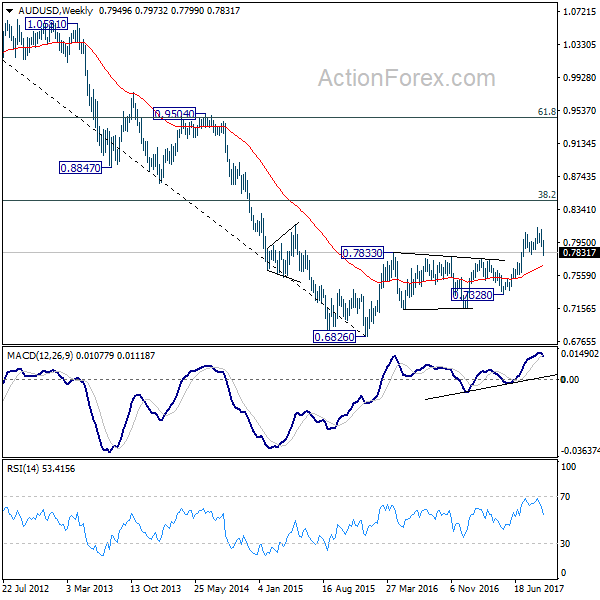
AUD/USD Weekly Outlook
AUD/USD's fall from 0.8124 extended lower last week and breached 0.7807 support. But it cannot sustain below this level yet. Initial bias stays neutral this week first, with focus on 0.7807. Considering bearish divergence condition in daily MACD, firm break of 0.7807 will indicate near term reversal. Outlook will then be turned bearish for 55 week EMA (now at 0.7669) first. Meanwhile, rebound from 0.7807 will retain bullishness. Above 0.7907 minor resistance will turn bias back to the upside for retesting 0.8124 high.
In the bigger picture, rise from 0.6826 medium term bottom is seen as corrective pattern. In case of further rally, strong resistance should be seen at 38.2% retracement of 1.1079 to 0.6826 at 0.8451 to limit upside. Meanwhile, firm break of 0.7807 is the first signal that such correction is focused. Break of 0.7328 will bring retest of 0.6826 low.
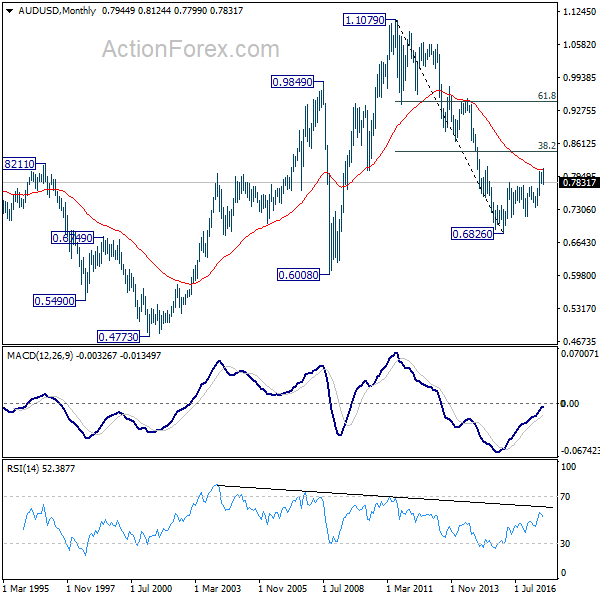
In the longer term picture, 0.6826 is seen as a long term bottom. Rise from there could either reverse the down trend from 1.1079, or just develop into a corrective pattern. At this point, we're favoring the latter. And, as long as 38.2% retracement of 1.1079 to 0.6826 at 0.8451 holds, we'd anticipate another decline through 0.6826 at a later stage.
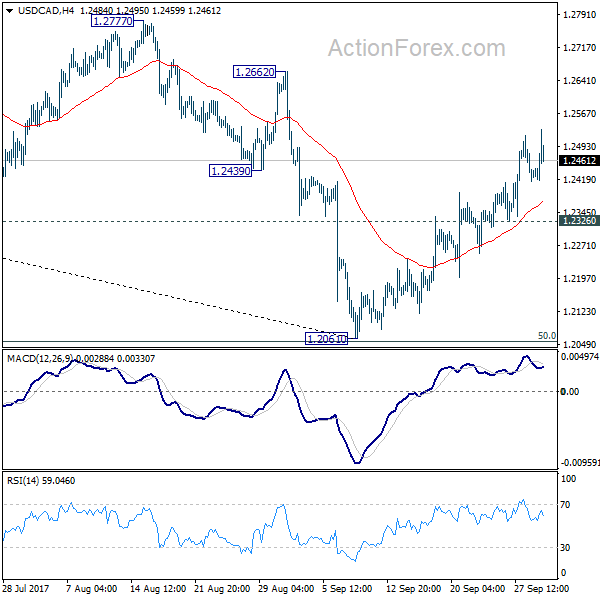
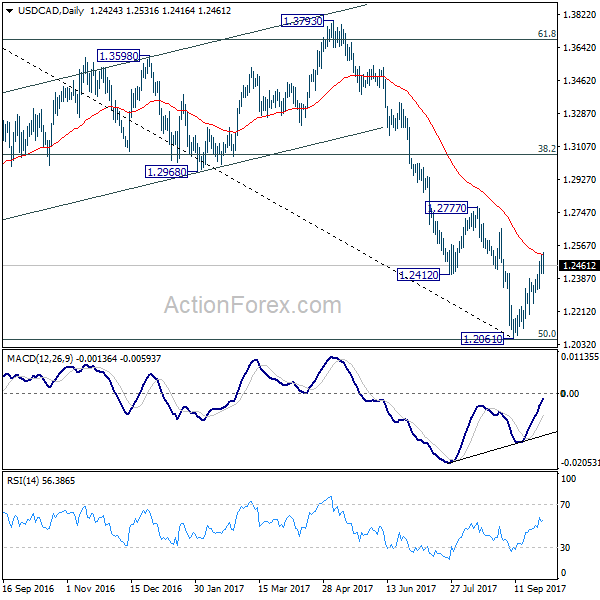
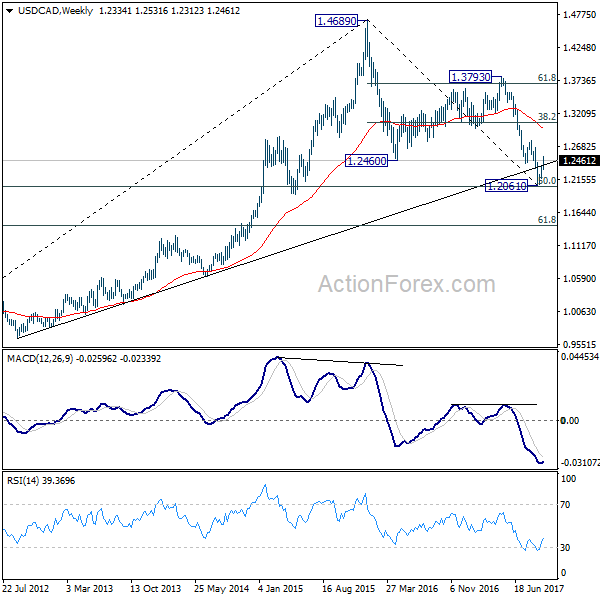
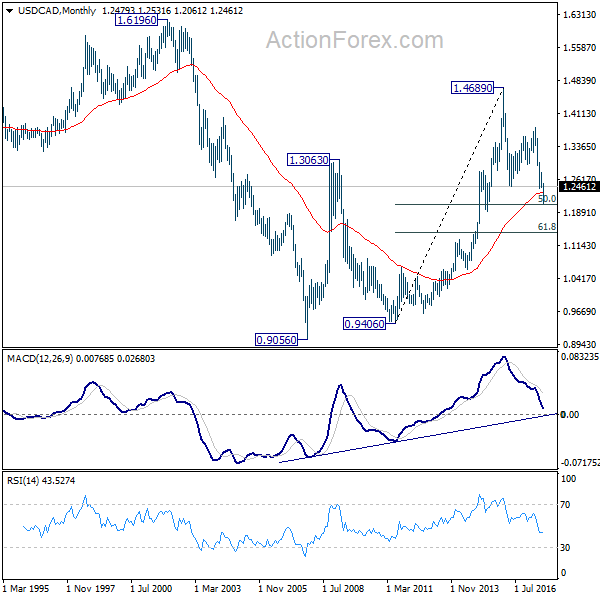
USD/CAD Weekly Outlook
USD/CAD's rebound from 1.2061 extended higher last week. The development argues that the pair has successfully defended 1.2048 fibonacci level. Further rise is expected this week as long as 1.2326 minor support holds, for 1.2777 resistance first. Decisive break there will target 38.2% retracement of 1.4689 to 1.2061 at 1.3065 next. However, break of 1.2326 will dampen this bullish view and turn bias back to the downside for 1.2061 instead.
In the bigger picture, current development argues that USD/CAD has defended 50% retracement of 0.9406 (2011 low) to 1.4869 (2016 high) at 1.2048. And with 1.2048 intact, we'd favor the case that fall from 1.4689 is a correction. Break of 1.2777 will further affirm this bullish case. That is, larger up trend from 0.9406 is not completed. However, on the other hand, firm break of 1.2048 will indicate that fall from 1.4689 is at least a medium term down trend and should target 61.8% retracement at 1.1424 and below.
In the longer term picture, the long term outlook is turned a bit mixed. As noted above, 50% retracement of 0.9406 to 1.4869 at 1.2048 is a key level to determine whether up trend from 0.9056 (2007) has already completed.
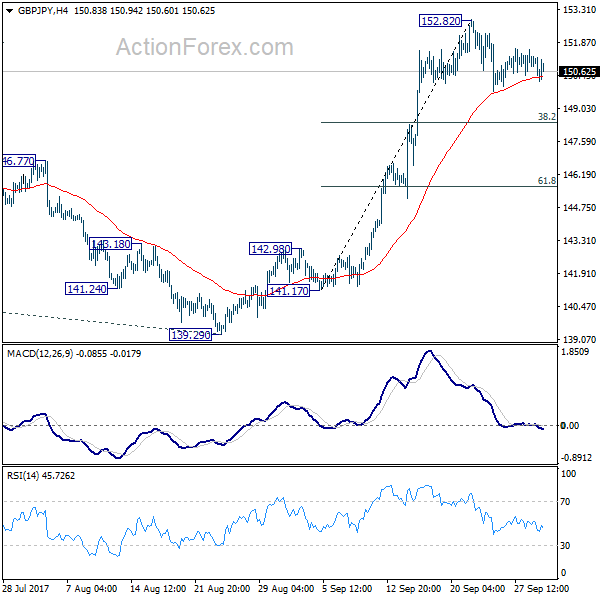
GBP/JPY Weekly Outlook
GBP/JPY stayed in consolidation from 152.82 short term top last week and outlook is unchanged. Initial bias remains neutral this week first. In case of another fall downside should be contained above 146.57 support to bring another rally. Break of 152.82 will extend the larger rise from 122.36 to 61.8% projection of 122.36 to 148.42 from 139.29 at 155.39 next.
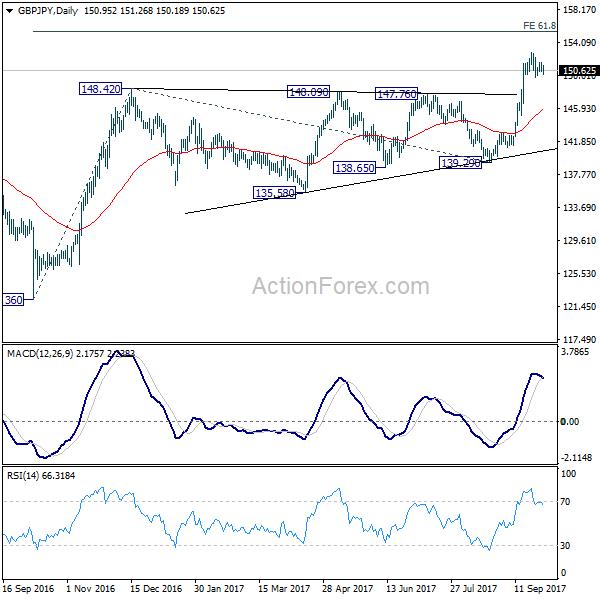
In the bigger picture, medium term rebound from 122.36 is in progress. Firm break of 38.2% retracement of 196.85 to 122.36 at 150.43 will carry long term bullish implications. In that case, GBP/JPY could target 61.8% retracement at 167.78. For now, the bullish scenario is preferred as long as 139.29 support holds.
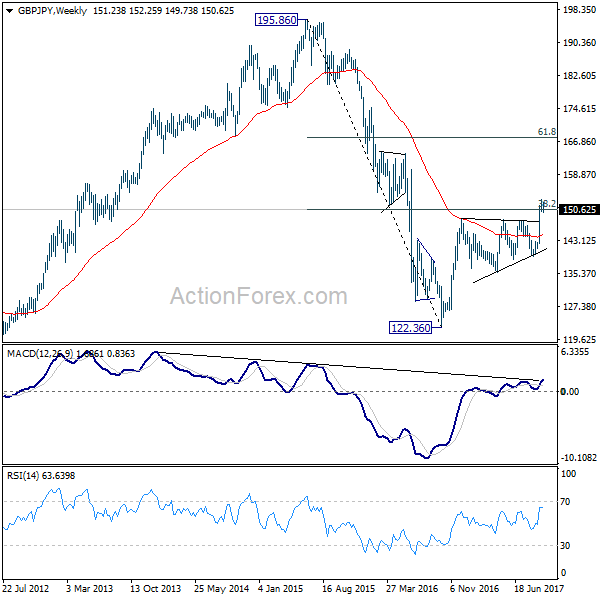
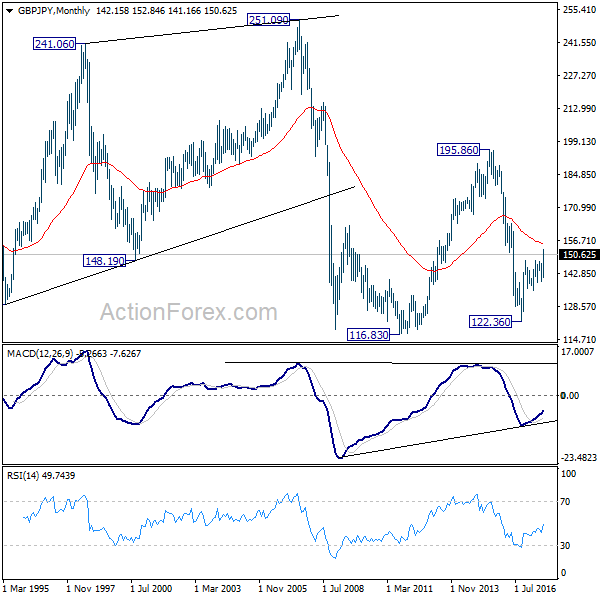
In the longer term picture, current decline argues that the down from fro 195.86 (2015 high) has already completed at 122.36. Focus is now on 55 month EMA (now at 155.14). Firm break there will suggest that rise form 122.36 is developing in to a long term move that target 195.86 again. And, price actions from 116.83 (2011 low) is indeed a sideway pattern that could last more than a decade.
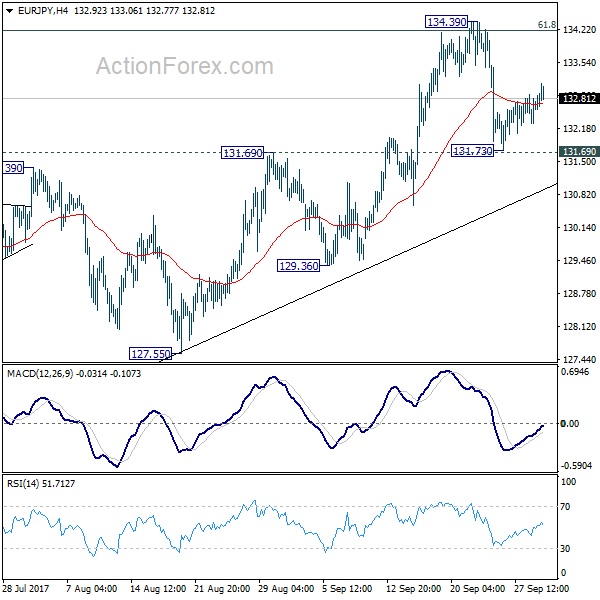
EUR/JPY Weekly Outlook
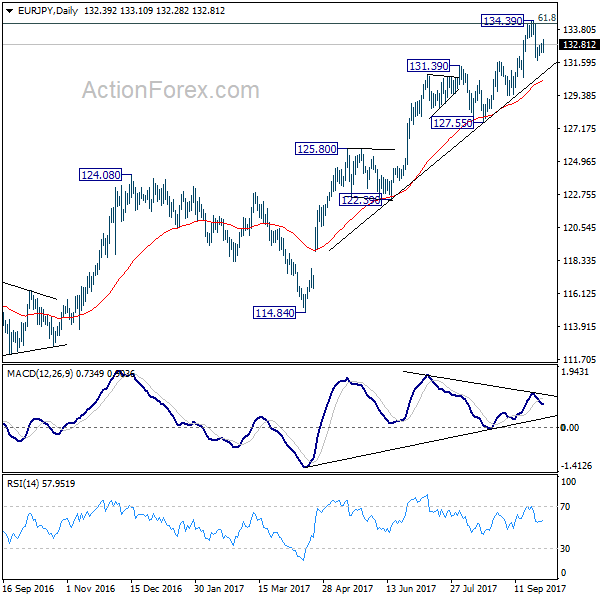
EUR/JPY edged lower to 131.73 last week but recovered ahead of 131.69 resistance turned support. Initial bias stays neutral this week work. Near term outlook remains bullish as long as 131.69 holds. Sustained break of 134.20 fibonacci level will extend larger up trend to 141.04 resistance next. However, break of 131.69 will be an early sigh of medium term reversal and will target 127.55 key support level instead.
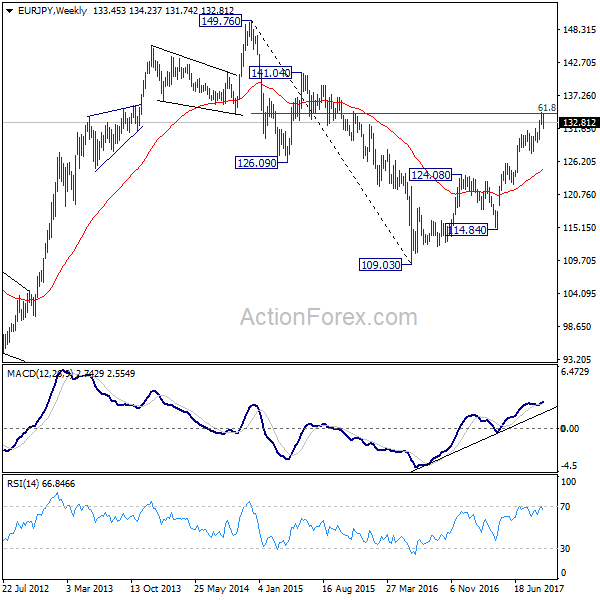
In the bigger picture, current rise from 109.03 is seen as at the same degree as the down trend from 149.76 (2014 high) to 109.03 (2016 low). 61.8% retracement of 149.76 to 109.03 at 134.20 is already met. Sustained break there will pave the way to key long term resistance zone at 141.04/149.76. On the downside, break of 127.55 support is needed to be the first signal of medium term reversal. Otherwise, outlook will remain bullish.
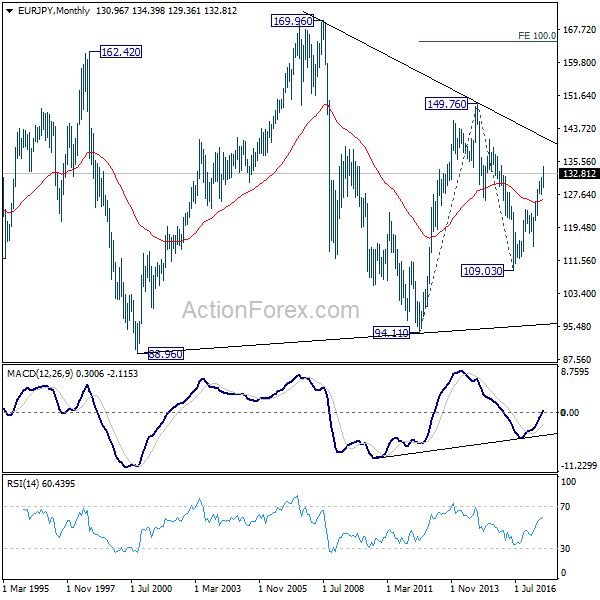
In the long term picture, at this point, there is no clear indication that rise from 109.03 is resuming that from 94.11. Hence, we'd be cautious on topping below 149.76 to extend range trading. Nonetheless, firm break of 149.76 will indicates strong underlying buying. In such case, EUR/JPY will target 100% projection of 94.11 to 149.76 from 109.03 at 164.68.
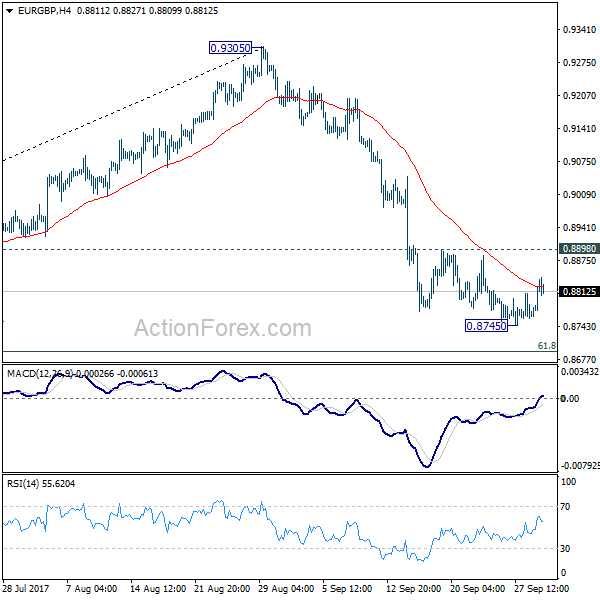
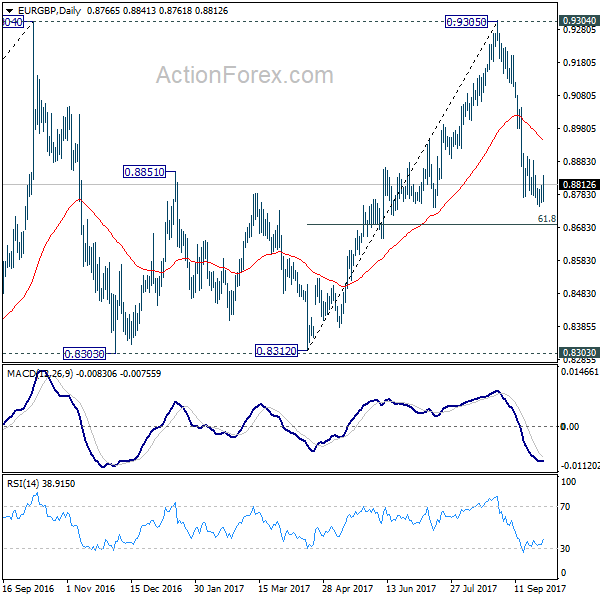
EUR/GBP Weekly Outlook
EUR/GBP edged lower to 0.8745 last week but formed a temporary low there and recovered. Initial bias is neutral this week first. Deeper fall is expected as long as 0.8898 resistance holds. Below 0.8745 will target 61.8% retracement of 0.8312 to 0.9305 at 0.8691 and below. Fall from 0.9305 is seen as the third leg of consolidation pattern from 0.9304. We'll look for bottoming signal again at it approaches 0.8303 support. On the upside, break of 0.8898 will indicate near term reversal and turn bias back to the upside for 55 day EMA (now at 0.8945) first.
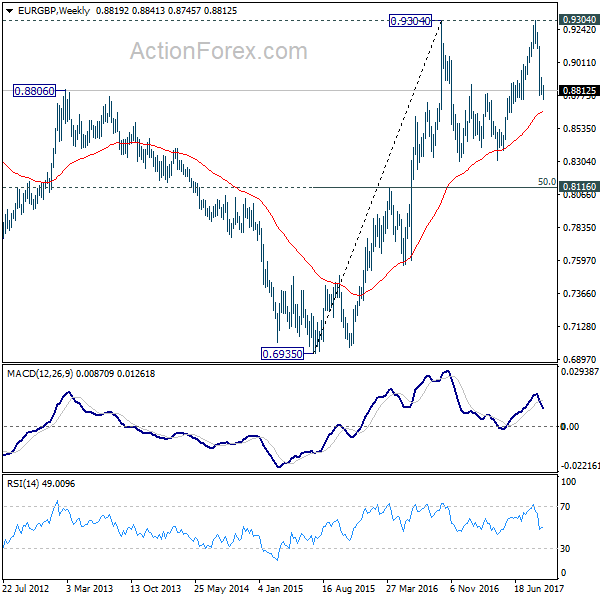
In the bigger picture, price actions from 0.9304 are viewed as a medium term corrective pattern. It's still in progress with fall from 0.9305 as the third leg. Break of 0.8303 could be seen. But even in that case, we'd expect strong support from 0.8116 cluster support (50% retracement of 0.6935 to 0.9304 at 0.8120) to contain downside. Whole up trend from 0.6935 is expected to resume after consolidation from 0.9304 completes.
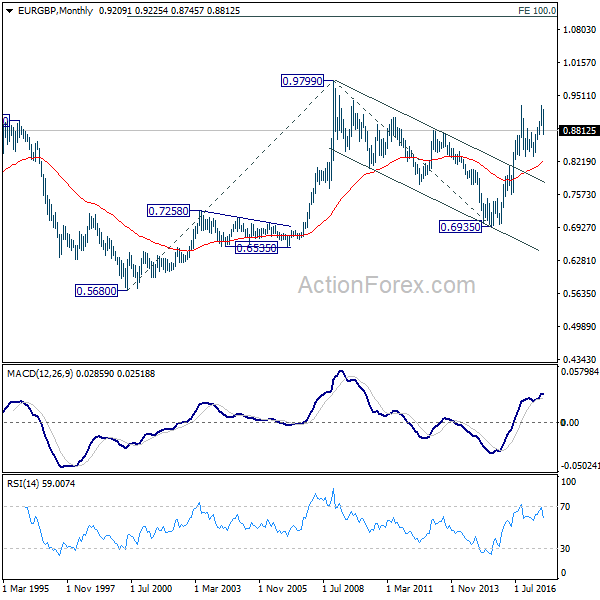
In the long term picture, firstly, price action from 0.9799 (2008 high) is seen as a long term corrective pattern and should have completed at 0.6935 (2015 low). Secondly, rise from 0.6935 is likely resuming up trend from 0.5680 (2000 low). Thirdly, this is supported by the impulsive structure of the rise from 0.6935 to 0.9304. Hence, after the correction from 0.9304 completes, we'd expect another medium term up trend through 0.9799 to 61.8% projection of 0.5680 to 0.9799 from 0.6935 at 1.1054.
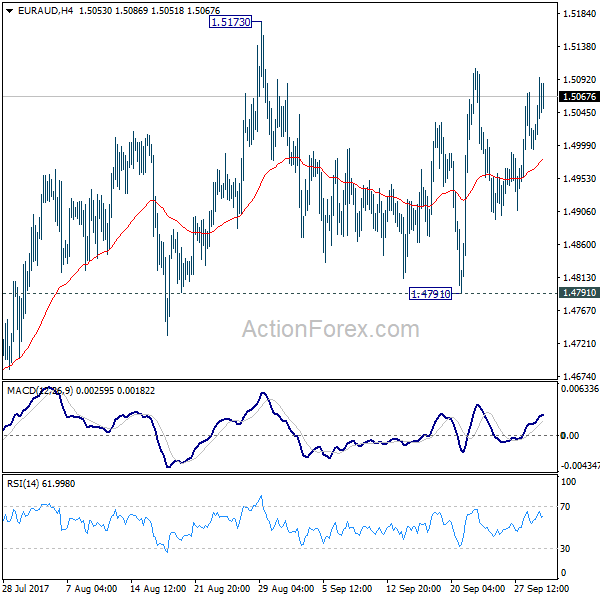
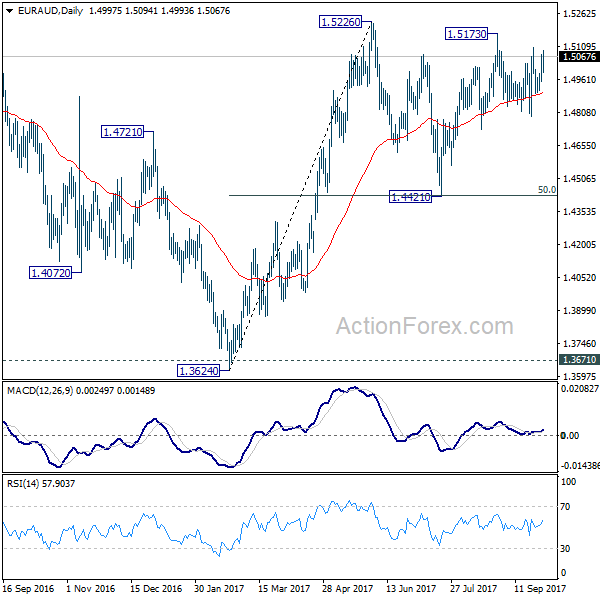
EUR/AUD Weekly Outlook
EUR/AUD continued to stay in range of 1.4791/5173 last week and outlook is unchanged. Initial bias remains neutral this week first. On the upside, break of 1.5173/5226 resistance zone will finally resume larger rise from 1.3624. In that case, EUR/AUD will target 1.5644 resistance first. On the downside, break of 1.4791 support will turn bias to the downside and extend the fall from 1.5173 to retest 1.4421 support.
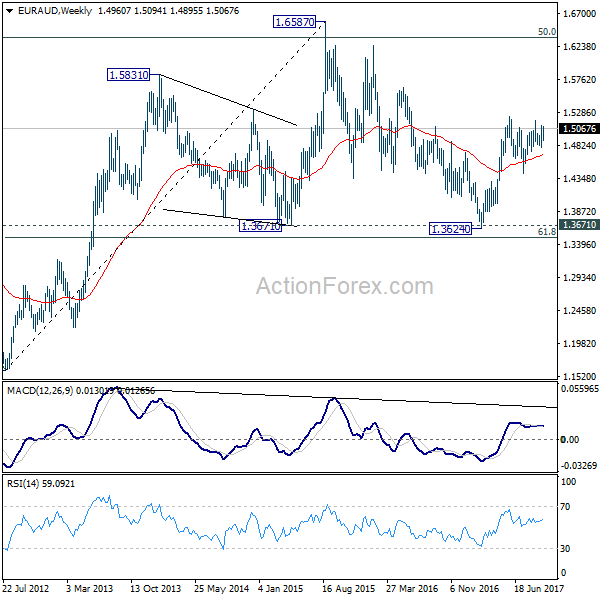
In the bigger picture, we're holding on to the view that corrective decline from 1.6587 medium term top has completed at 1.3624. Rise from 1.3624 is expected to extend to retest 1.6587. The corrective structure of the price actions from 1.5226 is affirming this view. Above 1.5226 will target a test on 1.6587 key resistance. However, break of 1.4421 support will dampen our view and would drag EUR/AUD lower to retest key support zone around 1.3624.
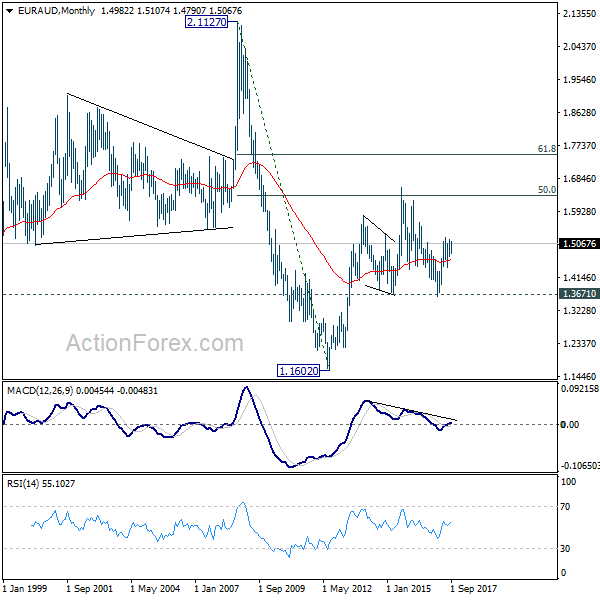
In the longer term picture, the rise from 1.1602 long term bottom isn't over yet. We'll keep monitoring the development but there is prospect of extending the rise to 61.8% retracement of 2.1127 to 1.1602 at 1.7488 and above. However, sustained trading below 1.3671 should confirm trend reversal and target 1.1602 long term bottom again.
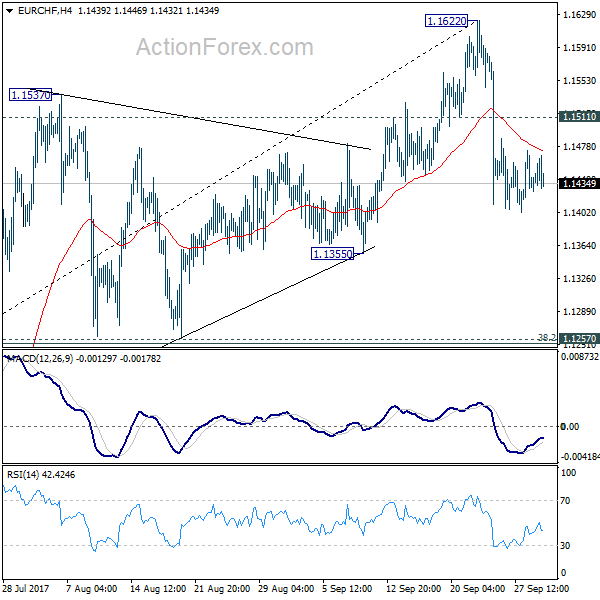
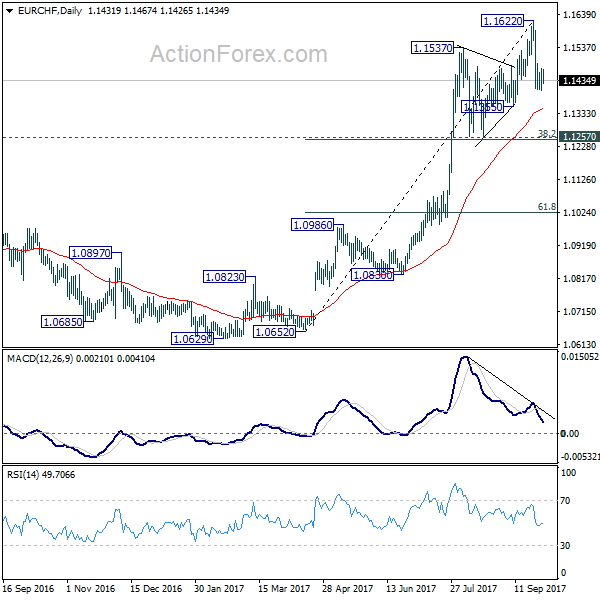
EUR/CHF Weekly Outlook
EUR/CHF's sharp fall last week suggests short term topping at 1.1622. The cross as now turned into correction. With 1.1511 minor resistance intact, deeper decline is expected this week for 1.1355 support first. Break will target 1.1257 cluster support (38.2% retracement of 1.0652 to 1.1622 at 1.1251). Strong support is expected there to contain downside and bring rebound. Meanwhile, break of 1.1511 minor resistance will suggest that the pull back is completed and bring retest of 1.1622.
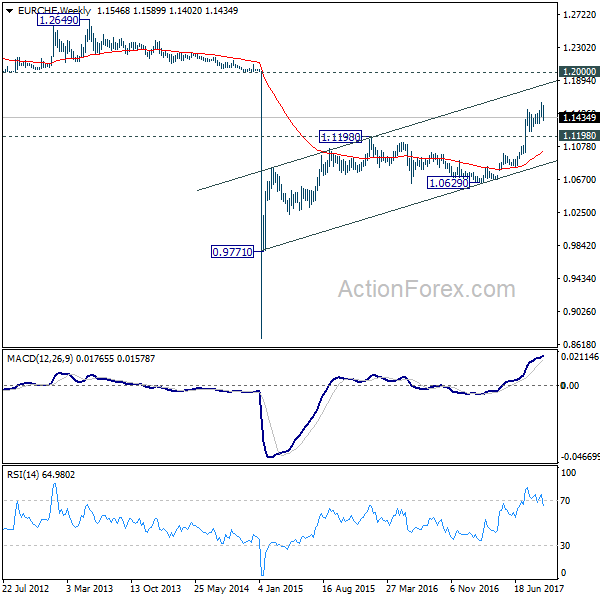
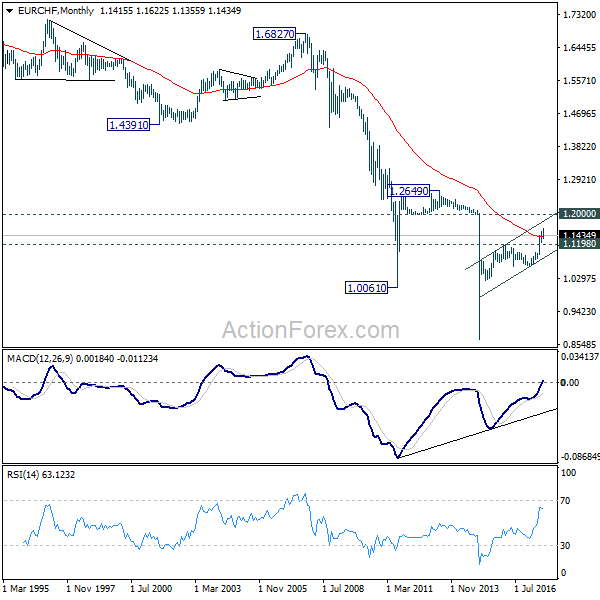
In the bigger picture, long term rise from SNB spike low back in 2015 is still in progress. EUR/CHF should now be heading back to prior SNB imposed floor at 1.2000. For now, this will be the favored case as long as 1.1198 resistance turned support holds.
Risk Apettite Surged, Conflicting Movements in Currency Markets Due to Quarter End Trading
There were some conflicting movements in the markets last week. Risk appetite was clearly strong in US and Europe. S&P 500 and NASDAQ ended at record highs and DOW was not far from it. Dollar was firm as investors finally got some more details about the long awaited tax reform. Treasury yield also jumped as markets were getting more confident on the bet of December Fed hike. However, the greenback was overshadowed by Swiss Franc, which ended as the strongest one for the week. Dollar was only the second best performer. Yen also ended the third strongest ones. The decoupling of risk sentiments with Swiss Franc and Yen could be partly seen as the results of quarter end position squaring. Or, it's a sign that Dollar strength was indecisive due to lack of confidence over the tax plan.
Meanwhile, Euro dipped broadly except versus Aussie and Kiwi. Some attributed the weakness in Euro to the political uncertainties after German Election. However, the strong gains in DAX and CAC 40 argue that investors were not worried at all. Profit taking in Euro, against Dollar and Yen, was likely the main driver in Euro's weakness instead. Also traders were starting to get cautious ahead of ECB meeting in October, when re-calibration of monetary stimulus would be announced. On the other hand, strength in Sterling was not too apparent even though BoE Governor Mark Carney affirmed the chance of a November hike. And FTSE also closed higher following other major European indices, in spite of lack of progress in Brexit negotiation and expectation of rate hike. It's something that is worth close attention.
Price actions in commodity currencies were closer to what one could expect. Canadian Dollar lost ground as BoC Governor Stephen Poloz reminded the market that it's not on autopilot for rate hike. RBA is clear that it's in no hurry to raise interest rates. New Zealand Dollar was weighed down by dovish RBNZ and indecisive election results. Also, performance of Asian stock markets lagged far behind Europe and US.
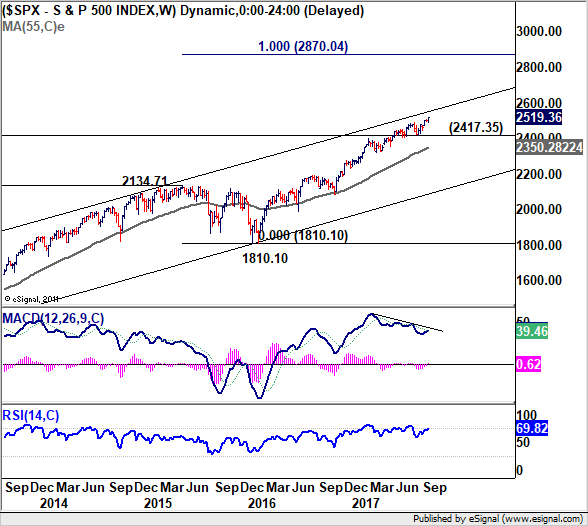
S&P 500's (SPX) long term up trend continued last week and closed at new record high at 2519.36. Medium term upside momentum remains unconvincing with bearish divergence condition in weekly MACD. The proximity to long term channel resistance is giving some weight to the index. But after all, outlook will remain bullish as long as 2417.35 support holds. We'd monitor if the index will follow the path of the channel resistance, or if there will be upside acceleration that power it through. In the latter case, next fibonacci level at 100% projection of 1074.77 (2011 low) to 2134.71 (2015 high) from 1810.10 (2016 low) at 2870.04 will be reachable.
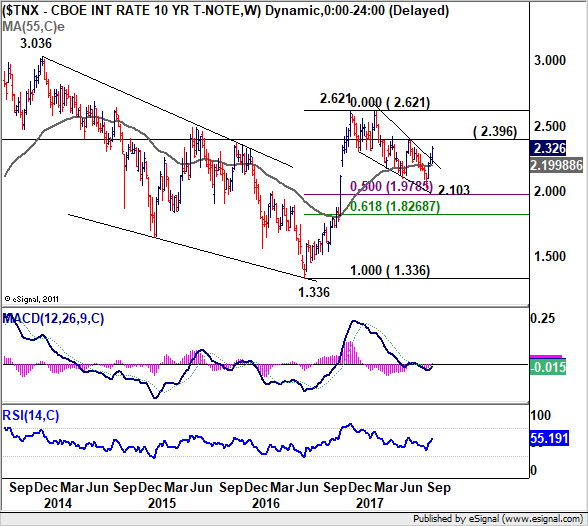
10 year yield (TNX) also staged a strong rally last week and the break of the medium term trend line resistance suggests that corrective pull back from 2.621 is already completed at 2.103 already. Further rise is now expected in near term to 2.396 resistance. Firm break there will affirm this bullish case and target a test on 2.621 high. And in that case, the long term rise from 1.336 will likely be resuming for next key level at 3.036.
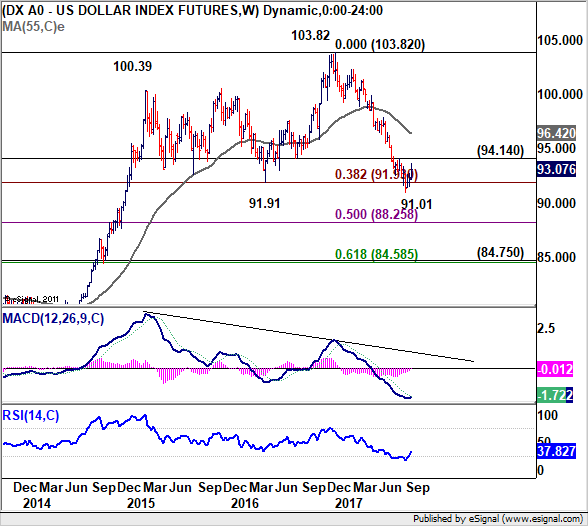
The case for Dollar index (DXY) reversal is building up with last week's strong rally. But it's not there to confirm it yet. We maintain that 91.91 is a key cluster support level, with 38.2% retracement of 72.69 (2011 low) to 103.82 (2017 high) at 91.93. Firm break of 94.14 resistance will confirm medium term bottoming at 91.01 and bring stronger rebound back to 55 week EMA (now at 96.42) and above. But before that, the fall from 103.82 could still extend to 50% retracement at 88.25.
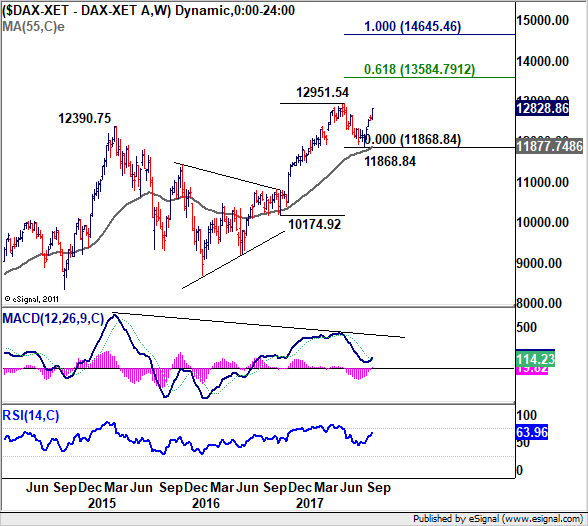
There are still much uncertainty to resolve after last week's German election. But development in the stock markets argue that investors are not very concerned. DAX extended recent rebound from 11868.84 to close strongly at 12828.86. And, the development affirms the bullish case that pull back from 12951. has completed at 11868.84 already, held comfortably above 55 week EMA. Long term up trend is likely resuming for new record high too. Near term outlook will remain bullish as long as last week's low at 12551.87 holds. Retest of 12951.54 should be seen next. Break will target 61.8% projection of 10174.92 to 12951.54 from 11868.84 at 13584.79.
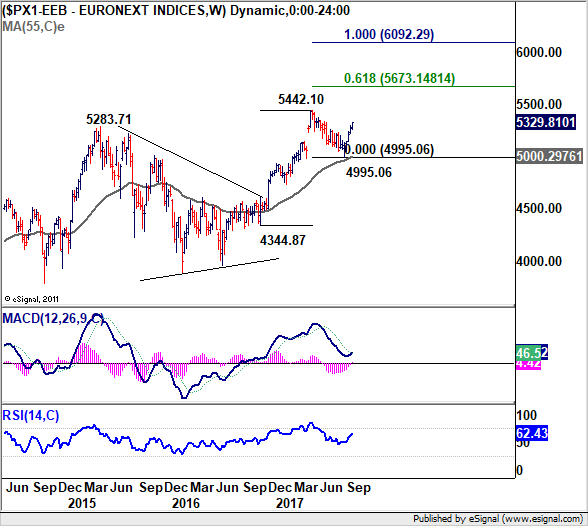
French investors also showed much confidence too as CAC 40 extended the rise from 4995.06 to close strongly at 5329.81. Pull back from 5442.1 should have completed at 4995.05, kept above 55 week EMA. Further rise should be seen to retest 5442.1 in near term. Break will extend the long term up trend to 61.8% projection of 4344.87 to 5442.10 from 4995.06 at 5673.14 next.
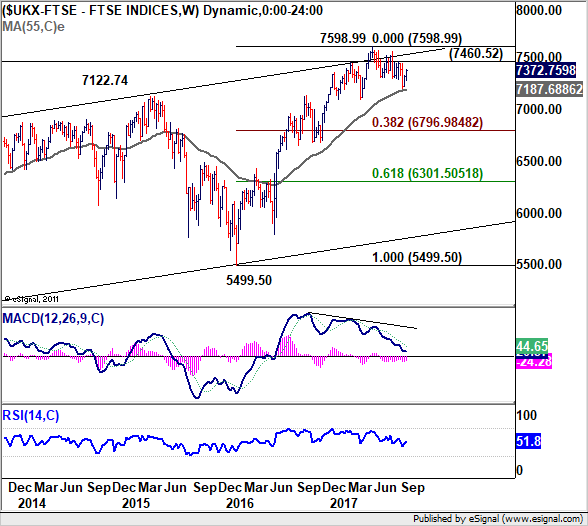
However about FTSE 100 in UK? The index performed well last week too even though there was no progress in Brexit negotiation. And BoE now looks quite firm to hike in November. The index extended recent rebound to close strongly at 7372.75. Pull back from 7598.99 high was also held above 55 week EMA. It's not as bullish as DAX and CAC. But further rise is mildly in favor in near term to 7460.52 resistance. Break will likely resume the long term up trend through 7598.99 high.
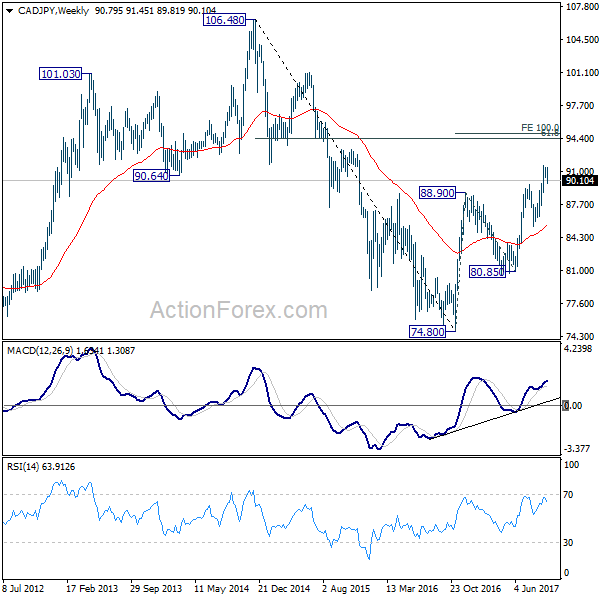
Regarding trading strategy, we bought CAD/JPY at 89.90 last week as it dipped to 89.81. Price actions from 91.62 are seen as a consolidation pattern. While Canadian Dollar retreated on BoC head's comments, there is no change in the central bank's tightening path. It's just a matter of how frequent rates hike would be. Also, based on strong risk appetite, we'd expect Yen to be back under pressure after it's recovery completes. Hence, we'll stay long in CAD/JPY, with stop put at 88.50. We'd expect another rise to 61.8% retracement of 106.48 to 74.80 at 94.37 as first target.
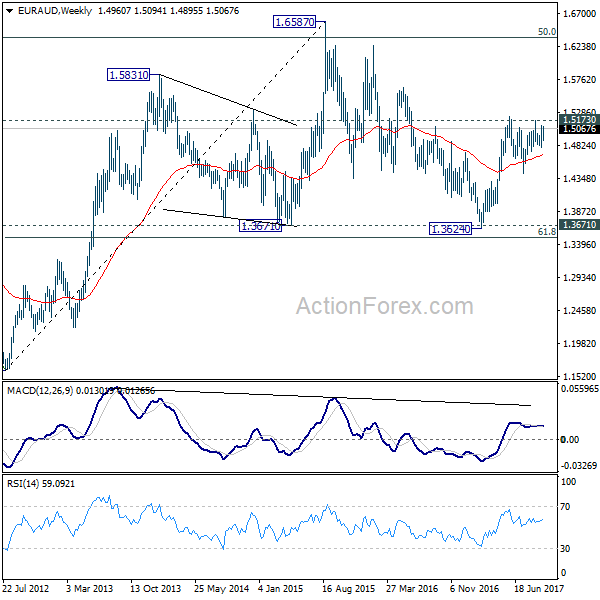
The story for Aussie is totally different as RBA is not expected to hike another time soon. There is also worries over China's debt problem in the background. And Asian stocks clearly lagged behind European and American. Therefore, we'd look for opportunity to sell Aussie. At this point, while the case for a Dollar reversal is building up, there is no confirmation yet. And Euro is still expected to rally again after its pull back completes. Therefore, we'll try to buy EUR/AUD on break of 1.5173 resistance. with 1.6587 as target.
USD/CHF Weekly Outlook
USD/CHF edged higher to 0.9769 last week but failed to take out 0.9772 key near term resistance. Also, upside was limited below 55 week EMA (now at 0.9777). Initial bias remains neutral this week first. On the upside, decisive break of 0.9772 will suggest that whole down trend form 1.0342 has completed after defending 0.9443 key support again. That would also complete a double bottom pattern (0.9437, 9420). In that case, near term outlook will be turned bullish for 0.9860/1.0099 resistance zone first. Nonetheless, with 0.9772 resistance intact, outlook remains bearish. Below 0.9587 minor support will turn bias back to the downside for retesting 0.9420 low.
In the bigger picture, focus remains on whether 0.9443 key support (2016 low) would be taken out firmly as down trend from 1.0342 extends. There are various interpretation of the price actions. But in any case, medium term outlook will stay bearish as long as 0.9772 resistance holds. Current down trend could extend to 38.2% retracement of 0.7065 (2011 low) to 1.0342 (2016 high) at 0.9090. However, break of 0.9772 will indicate that USD/CHF has successfully defended 0.9443 again and turn outlook bullish for 1.0099 resistance.