Sample Category Title
European Open Briefing: Asia-Pacific Equity Markets Opened Higher On Monday
Global Markets:
- Asian stock markets: Nikkei up 0.15 %, Shanghai Composite rose 0.28 %, Hang Seng gained 0.48 %, ASX 200 rose 0.1 %
- Commodities: Gold at $1277.85 (-0.54 %), Silver at $16.62 (-0.33 %), WTI Oil at $51.52 (-0.27 %), Brent Oil at $56.56 (-0.41 %)
- Rates: US 10-year yield at 2.35, UK 10-year yield at 1.36, German 10-year yield at 0.46
News & Data:
- (JPY) Tankan Manufacturing Index 22 vs 18 expected
- (JPY) Tankan Non-Manufacturing Index 23 vs 24 expected
- (CNY) Manufacturing PMI 52.4 vs 51.5 expected
- (CNY) Non- Manufacturing PMI 55.5 vs 53.4 previous
- (CNY) Caixin Manufacturing PMI 51.0 vs 51.5 expected
- (EUR) German Retail Sales m/m -0.4 % vs 0.5% expected
- (GBP) Current Account -23.2 B vs -15.8 B expected
- (GBP) Final GDP q/q 0.3 % vs 0.3 % expected
- (EUR) CPI Flash Estimate y/y 1.5 % vs 1.6 % expected
- (EUR) Core CPI Flash Estimate y/y 1.1 % vs 1.2 % expected
- (CAD) GDP m/m 0.0 % vs 0.1 % expected
- (USD) Chicago PMI 65.2 vs 58.6 expected
- (USD) Revised UoM Consumer Sentiment 95.1 vs 95.3 expected
- Oil prices lower after strong third quarter as Sept. OPEC output rises- RTRS
CFTC Positioning Data:
- EUR long 88K vs 62K long last week. Longs increased by 26K
- GBP long 5K vs 10K short last week. Position moves to long from short. Last time it was positve was October 2015
- JPY short 71K vs 51K short last week. Shorts increased by 20K.
- CHF short 1.8K vs 1.5K short last week. Shorts increased by 0.3K
- CAD long 75K vs 59K long. Longs increased by 16K.
- AUD long 77k vs 72k last week. Longs increase by 5K.
- NZD long 8K vs 7K long last week. Longs increased by 1K.
Markets Update:
Asia-Pacific equity markets opened higher on Monday in spite of few major markets in the region being shut for holidays, the optimism was backed by surprisingly strong economic news out of China and Japan in addition to the broadly upbeat sentiment and gains in the U.S. dollar. However, the euro took a knock in Asia on Monday as investors kept an anxious eye on an independence vote in Spain’s Catalonia
USDJPY is currently seen Trading at 112.83 as the Yen was marginally weak against the US Dollar earlier on Monday. Propelled by the weaker Yen, Japan’s Nikkei Stock Average Nikkei 225 was up 0.15%. The gains in Asian Markets were in line with analysts’ bullish expectations for the fourth quarter amid ample market liquidity.
EURUSD had a very active session early on Monday with Euro dropping to lows around 1.1780 against the USD in the NZ session before retracing to around 1.1815 only to drop again over 50 pips in value once Asian liquidity came in, currently the pair is seen trading around 1.1775. The dollar index, which tracks the greenback against a basket of six major currencies, added 0.3 percent and is currently valued at 93.33.
AUDUSD is currently seen Trading at 0.7824 down from its session highs of around 0.7850. Notably, Australia’s main index S&P/ASX 200 was up earlier jumping 1.1% percent helping support export stocks as the Australian Dollar was weak against the US Dollar. Likewise, The New Zealand Dollar dropped from its session highs of 0.7225 and is currently seen trading closer to it’s opening price of around 0.7200 against the US Dollar.
Upcoming Events:
- 07:15 GMT – (EUR) Retail Sales y/y
- 07:15 GMT – (EUR) Spanish Manufacturing PMI
- 08:30 GMT – (GBP) Manufacturing PMI
- 09:00 GMT – (EUR) Unemployment Rate
- 14:00 GMT – (USD) ISM Manufacturing PMI
- 18:00 GMT – (USD) FOMC Member Kaplan Speaks
The Week Ahead:
Tuesday, October 3rd
- All Day – (EUR) German Bank Holiday
- Tentative – (NZD) GDT Price Index
- 00:30 GMT – (AUD) Building Approvals m/m
- 03:30 GMT – (AUD) Cash Rate
- 03:30 GMT – (AUD) RBA Rate Statement
- 07:00 GMT – (EUR) Spanish Unemployment Change
- 08:30 GMT – (GBP) Construction PMI
- 12:30 GMT – (USD) FOMC Member Powell Speaks
Wednesday, October 4th
- All Day – (CNY) Chinese Bank Holiday
- 08:30 GMT – (GBP) Services PMI
- 12:15 GMT – (USD) ADP Non-Farm Employment Change
- 14:00 GMT – (USD) ISM Non-Manufacturing PMI
- 14:30 GMT – (USD) Crude Oil Inventories
- 17:15 GMT – (EUR) ECB President Draghi Speaks
- 19:15 GMT – (USD) Fed Chair Yellen Speaks
Thursday, October 5th
- All Day – (CNY) Chinese Bank Holiday
- 00:30 GMT – (AUD) Retail Sales m/m
- 00:30 GMT – (AUD) Trade Balance
- 11:30 GMT – (EUR) ECB Monetary Policy Meeting Accounts
- 12:30 GMT – (CAD) Trade Balance
- 12:30 GMT – (USD) Unemployment Claims
- 12:30 GMT – (USD) Trade Balance
- 13:10 GMT – (USD) FOMC Member Powell Speaks
- 14:00 GMT – (USD) FOMC Member Harker Speaks
- 14:00 GMT – (USD) Factory Orders m/m
- 16:00 GMT – (GBP) MPC Member McCafferty Speaks
- 17:30 GMT – (GBP) MPC Member Haldane Speaks
Friday, October 6th
- All Day – (CNY) Chinese Bank Holiday
- 07:30 GMT – (GBP) Halifax HPI m/m
- 12:00 GMT – (GBP) MPC Member Haldane Speaks
- 12:30 GMT – (CAD) Employment Change
- 12:30 GMT – (CAD) Unemployment Rate
- 12:30 GMT – (USD) Average Hourly Earnings m/m
- 12:30 GMT – (USD) Non-Farm Employment Change
- 12:30 GMT – (USD) Unemployment Rate
- 14:00 GMT – (CAD) Ivey PMI
- 16:15 GMT – (USD) FOMC Member Dudley Speaks
- 16:45 GMT – (USD) FOMC Member Kaplan Speaks
China, South Korea, Hong Kong, India And Australia Markets Closed For Public Holidays, Liquidity Expected To Be Thin On...
Dollar Closes September Strong but Possible Correction Ahead. September was a strong month for the U.S. dollar, but as we look ahead to October, the greenback's momentum is fading and the odds of a correction outweigh the chance of continuation. October is when we will begin to see the negative impact of hurricanes Harvey and Irma on the U.S. economy, for example US payrolls on Friday were expected to have been weak.
Outlook for Eurozone is Positive On Fundamental Basis. The euro has finally stabilized as investors realize that at the end of the day Angela Merkel will still be leading the country and it won't be long before a coalition government is formed. EUR/USD traders could celebrate the announcement by driving the currency higher on the elimination of election uncertainty. No major Eurozone economic reports are scheduled for release in the coming week.
The Euro Fell on Monday After the Violence-Marred Vote. The euro edged down 0.1 percent to $1.1796, as investors nervously watched the situation in Spain, where police used batons and rubber bullets to thwart the Catalan vote on Sunday in a show of force that left hundreds injured. The euro fell around a third of a U.S. cent to as low as $1.1776 in early Asian trade but soon steadied at $1.1800.
Important Week for Sterling as All 3 of The U.K.'s PMI Reports Are Due for Release. PMI reports due this week will be exceptionally important. If manufacturing, service and construction sector activity accelerate, it would validate the BoE's calls for tightening and reinvigorate the rise in pound sterling.
However, if manufacturing and/or service sector activity slows, it would cast doubt on the central bank's plans and cause the currency to give up some of the gains that it enjoyed in September against the dollar and the euro.
Dollar Rose 0.2 Percent to 112.71 Against The Yen. Data released earlier on Monday showed Japan's big manufacturers were the most confident about the business outlook in a decade in the last quarter, a sign the country's economic recovery may be gathering steam thanks to robust global demand. The figures could also help premier Shinzo Abe as he tries to convince voters in an Oct. 22 election that his “Abenomics” stimulus policies have improved their livelihoods, analys. There are two main directional scenarios for the yen following the election, though, dollar/yen is still dominated by U.S. factors.
Kiwi Little Changed After Mixed US Data. The New Zealand dollar, which has shed about 1.5 percent since the Sept. 23 election, was little changed after mixed US data gave few clues to the pace of Federal Reserve monetary policy changes. Also, NZ First leader Winston Peters says he won't begin talks on forming a coalition government until Oct. 7, after special votes are counted, leaving the media to speculate on which way he will turn.
Gold Heads for Worst Month in 2017. Gold prices have edged lower as slightly weaker US inflation and consumer spending data did little to dampen expectations of an interest rate hike in December. Spot gold dipped 0.3 per cent at $US1,274.61 per ounce.
Oil Prices Edge Lower After Strong Third-Quarter. Oil prices edged lower on Monday in early Asian trading, pausing for breath after posting gains of as much as 20 percent in the third quarter, after a survey pointed to a slight increase in OPEC production in September. U.S. crude was down 2 cents at $51.65 a barrel, Brent crude for December delivery, was down 6 cents at $56.73 a barrel.
Watch Out Today for:
08:30 am GMT: GBP Manufacturing PMI
14:00 pm GMT: USD ISM Manufacturing PMI
Oil And Gold Unmoved In Asia
Oil and Gold both continued to fade into the week's end with a China holiday seeing a quiet start for Asia.
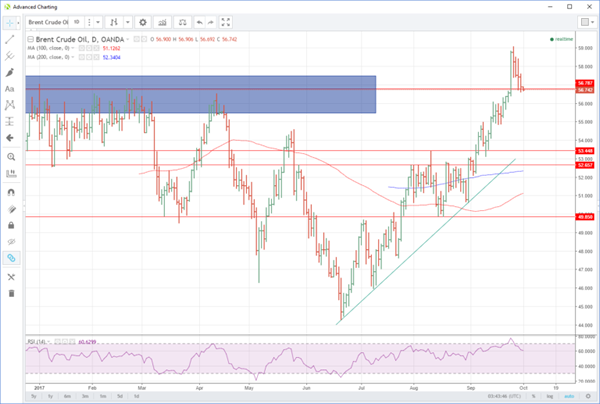
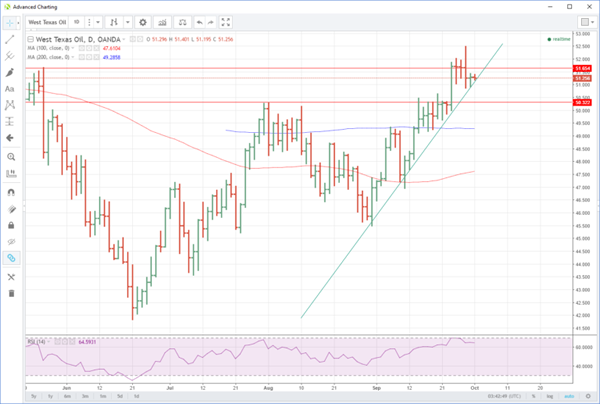
WTI finished unchanged at 51.35 on Friday as the selling pressure continued to be seen in the Brent contract, which closed one percent lower at 56.90 as traders lightened longs further into the weekend. With Brent being the month's outperformer and the technically more overbought of the two, it was no real surprise as news that Iraq and Libya have increased production, that the weight of the selling would fall there.
Both contracts continue to trade consolidative, slowly unwinding the extreme overbought technical picture caused by the pace of the rally in September. We would expect quiet start to Asia trading today with little news of note to move markets over the weekend and China on holiday. That said, a deeper correction cannot be ruled out as both Brent and WTI are resting on support zones as the week gets underway.
Brent spot looks set to test its long-term breakout zone between 56.50 and 57.00 to start the week. A move through this level could see the contract drop back to the 55.00 area initially. Resistance sits above at 57.50 to start followed by the September highs of 59.10.
WTI spot is trading at 51.35 this morning, just above its ascending support line at 51.10. It has held all pullbacks throughout the September rally, and a break now could signal a deeper correction to 50.30 and then 49.00. Resistance appears above at 52.50 before its long-term resistance region between 53.50 and 54.50.
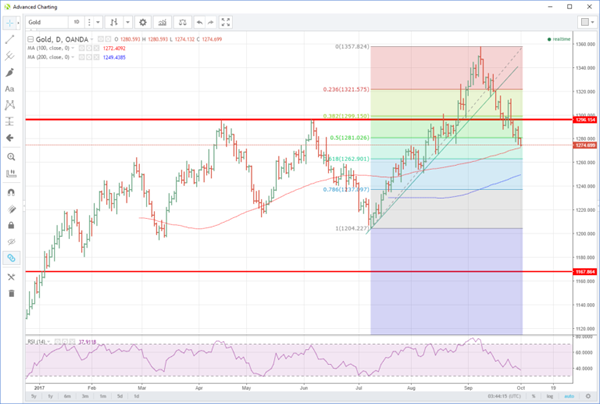
GOLD
Gold gets off to a quiet start to the week, with the bearish bias continuing from Friday's session where it fell seven dollars to close at 1280.50. Gold has sagged another four dollars this morning to 1276.50, showing no reaction to the Catalan elections in Spain in what was otherwise a quiet weekend on the news front. With China on holiday this week, physical buying will be muted in early Asia.
U.S. yields and the dollar are clearly the primary drivers of the gold prices at the moment and with both rising gold has wilted closing below its 50% retracement zone at 1281.00 on Friday. Bullish traders will now be nervously eyeing the 100-day moving average just below at 1272.45 for some relief. A break here opening a move lower to the August lows and the 200-day moving average at 1250.00. Resistance now rests at 1281.00 and 1285.00 to start, followed by the 1286.00 area.
Weekly Technical Outlook And Review: EUR/USD, GBP/USD, AUD/USD, USD/JPY, USD/CAD, USD/CHF, DOW 30, GOLD
A note on lower timeframe confirming price action...
Waiting for lower timeframe confirmation is our main tool to confirm strength within higher timeframe zones, and has really been the key to our trading success. It takes a little time to understand the subtle nuances, however, as each trade is never the same, but once you master the rhythm so to speak, you will be saved from countless unnecessary losing trades. The following is a list of what we look for:
- A break/retest of supply or demand dependent on which way you're trading.
- A trendline break/retest.
- Buying/selling tails ... essentially we look for a cluster of very obvious spikes off of lower timeframe support and resistance levels within the higher timeframe zone.
- Candlestick patterns. We tend to only stick with pin bars and engulfing bars as these have proven to be the most effective.
We typically search for lower-timeframe confirmation between the M15 and H1 timeframes, since most of our higher-timeframe areas begin with the H4. Stops are usually placed 1-3 pips beyond confirming structures.
EUR/USD
Weekly gain/loss: – 136 pips
Weekly closing price: 1.1811
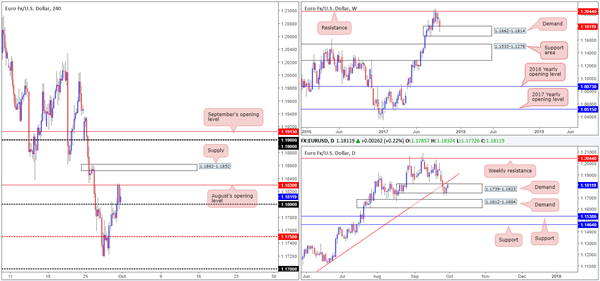
After crossing swords with weekly resistance at 1.2044 five weeks ago, the major finally confronted the nearby weekly demand at 1.1662-1.1814 last week. Also of particular interest is the fact that the weekly USDX candles are currently testing supply noted at 12012-11907. Should bids fail to support EUR demand this week, watch for a revisit of the large weekly support area seen below it at 1.1533-1.1278.
Turning our attention to the daily timeframe, last week's action shows demand at 1.1739-1.1823 remained in play despite suffering a minor break to the downside. This – coupled with the USDX daily candles presently shaking hands with supply at 11969-11938, could lead to price action overwhelming the nearby trendline resistance extended from the low 1.0839.
A quick recap of Friday's segment on the H4 timeframe shows price managed to conquer the 1.18 handle amid London's morning trade. This immediately saw the single currency gravitate towards August's opening level at 1.1830, which, as you can see, held ground into the close.
Suggestions: Let's just run through what we have here:
Weekly demand (EUR/USD) – weekly supply (USDX).
Daily demand/daily trendline resistance (EUR/USD) – daily supply (USDX).
H4 currently capped by the 1.18 handle and August's opening level.
On account of the above, our team believes the EUR may probe higher this week. Unfortunately though, we do not see any immediate buying opportunities on the H4 timeframe. It would take a break through both the noted monthly open level and nearby H4 supply at 1.1862-1.1852, before we see any space for the bulls to stretch their legs up to the 1.19 neighborhood.
Data points to consider: US ISM Manufacturing PMI at 2.45pm, followed by FOMC member Kaplan speaking at 7pm GMT+1.
Levels to watch/live orders:
- Buys: Watch for H4 price to close above 1.1862-1.1852 and then look to trade any retest seen thereafter ([waiting for lower-timeframe confirmation to form following the retest is advised [see the top of this report] stop loss: dependent on where one confirms the area).
- Sells: Flat (stop loss: N/A).
GBP/USD:
Weekly gain/loss: – 96 pips
Weekly closing price: 1.3395
Pound sterling sustained further losses for a second straight week in recent dealings, erasing close to 100 pips of value and bringing the unit down to a broken weekly Quasimodo line pegged at 1.3371. While a small end-of-week correction was seen from this level, there's a possibility that price may push lower to test the weekly channel resistance-turned support extended from the high1.2706, shadowed closely by a daily support area coming in at 1.3268-1.3203.
Over the last week, as you can see, H4 structure has largely been dominated by psychological support and resistance levels. The mid-level support 1.3350, bolstered by a minor demand at 1.3344-1.3371, has so far withstood two bearish attacks and is therefore likely a focal point for many traders right now. As the top edge of the current H4 demand zone also represents the noted weekly support, there is a good chance that higher prices may materialize from here.
Suggestions: Given the GBP's underlying trend pointing northbound at the moment, along with current weekly support, the team remains biased to the upside. However, to long this market, two things need to happen, in our opinion:
H4 price needs to close above 1.34.
A retest of 1.34 as support is required.
Given that the first take-profit target will likely be the H4 mid-level resistance 1.3450, entering on the lower timeframes following the retest may be the better path to take here (see the top of this report for ideas on how to use lower-timeframe action to enter the market). This would help reduce the stop-loss distance and therefore increase risk/reward.
Data points to consider: UK Manufacturing PMI at 9.30am. US ISM Manufacturing PMI at 2.45pm, followed by FOMC member Kaplan speaking at 7pm GMT+1.
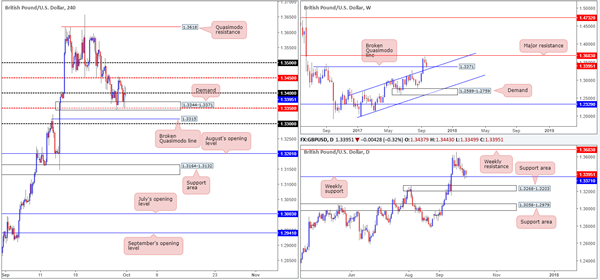
Levels to watch/live orders:
- Buys: Watch for H4 price to close above 1.34 and then look to trade any retest seen thereafter ([waiting for lower-timeframe confirmation to form following the retest is advised] stop loss: dependent on where one confirms the area).
- Sells: Flat (stop loss: N/A).
AUD/USD:
Weekly gain/loss: – 127 pips
Weekly closing price: 0.7828
The Australian dollar, as you can see, continued to spiral south last week, resulting in weekly price aggressively piling into a support area penciled in at 0.7849-0.7752. This zone has a strong history and held well as support during the month of August, thus there's a good chance that we may see history repeat itself here.
In support of the current weekly zone, a strong daily demand base logged at 0.7786-0.7838 is seen planted within its boundaries. While as of current price the market is bid from this daily barrier, traders might want to note that should this area give way, the next port of call will likely be a nearby broken daily Quasimodo line seen at 0.7740.
A brief look at recent dealings on the H4 timeframe shows the unit defended the mid-level resistance at 0.7850 on Friday, and concluded trade forming a near-full-bodied bearish candle. Given the two H4 buying tails printed before the closing candle (0.7821/0.7816), which appear to have consumed any demand residing around the 0.7827 mark, downside looks relatively free to the 0.78 handle.
Suggestions: In spite of the fact that both weekly and daily structures show potential buying may be on the cards, H4 action looks poised to retest 0.78. While H4 price may indeed drive lower in opening trade, there's little evidence to suggest that price will exceed 0.78.
As stop-loss orders are still likely active beneath 0.78, a whipsaw through this number in the shape of a H4 buying tail (pin bar) would be attractive. Once/if this is seen, our team would look to become buyers on the candle close, targeting 0.7850 and 0.79, followed closely by the H4 broken Quasimodo line at 0.7917.
Data points to consider: US ISM Manufacturing PMI at 2.45pm, followed by FOMC member Kaplan speaking at 7pm GMT+1.
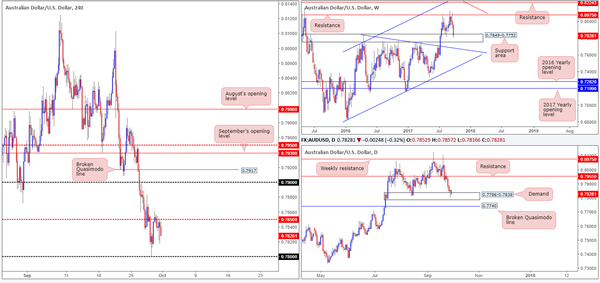
Levels to watch/live orders:
- Buys: 0.78 region ([watch for a H4 pin-bar candle to whipsaw through this number before pulling the trigger] stop loss: ideally beyond the pin bar's tail).
- Sells: Flat (stop loss: N/A).
USD/JPY:
Weekly gain/loss: + 47 pips
Weekly closing price: 112.46
Over the course of last week's segment, dollar bulls pushed to fresh highs of 113.25 and registered its third consecutive bullish close. As a result, the odds of price shaking hands with nearby supply at 115.50-113.85 are still high, in our humble opinion.
In conjunction with weekly flow, we can also see daily price respecting support at 111.91 and showing space for the unit to move north up to at least the trendline resistance extended from the high 115.50 (intersects with the aforementioned weekly supply zone).
Consequent to a rather lackluster performance on Friday, H4 price spent the day trading from local support found at 112.64. Despite this, the road to 112 remains in view and is still, as highlighted in Friday's report, an incredibly appealing level at the moment. Here's why:
Positioned directly above daily support at 111.91.
Located just below July's opening level at 112.09.
Nearby a 61.8% H4 Fib support at 112.16 taken from the low 111.47.
Boasts a 127.2% H4 Fib ext. point at 112.12 extended from the high 113.25.
Suggestions: With space seen for both weekly and daily action to push higher, coupled with the 112 handle's surrounding confluence mentioned above, a long from the green H4 buy zone is worthy of attention. As psychological levels are prone to fakeouts, however, the team has decided to wait for H4 price to confirm buyer intent before pulling the trigger. For us, this would simply be a full or near-full-bodied bullish candle formed within the green zone, which would, in our view, provide enough evidence to hold the position up to at least 113/H4 supply at 113.57-113.38.
Data points to consider: US ISM Manufacturing PMI at 2.45pm, followed by FOMC member Kaplan speaking at 7pm GMT+1.
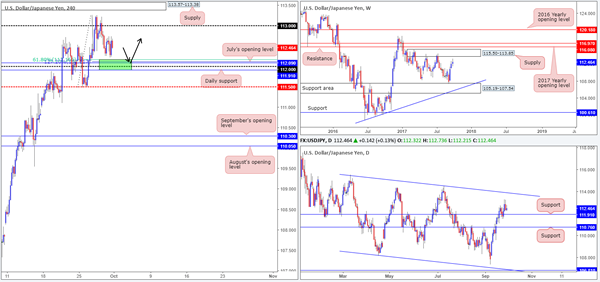
Levels to watch/live orders:
- Buys: 111.91/112.16 ([waiting for a reasonably sized H4 bullish candle to form – preferably a full, or near-full-bodied candle – is advised] stop loss: ideally beyond the candle's tail).
- Sells: Flat (stop loss: N/A).
USD/CAD:
Weekly gain/loss: + 135 pips
Weekly closing price: 1.2463
Trade update: sell stopped out at breakeven (1.2479).
The USD/CAD enjoyed another relatively successful session last week, increasing its stock by a further 135 pips into the closing bell. Perhaps the most compelling factor here, however, is weekly price also crossed paths with a trendline resistance taken from the low 0.9633, and printed a minor end-of-week correction. Along similar lines, daily activity also collided into a strong-looking supply base at 1.2663-1.2511 on Thursday and chalked up two back-to-back selling wicks.
On Friday, we saw H4 bulls press forward following a lower-than-expected Canadian GDP print. This, as you can see, forced price to whipsaw through multiple H4 resistances, tap a fresh high of 1.2530, and eventually end the day closing lower in the shape of a near-full-bodied H4 bearish candle.
Suggestions: In view of the unit's position on both the weekly and daily charts, along with the pair trading within a clear downtrend at the moment, we feel price is extremely overbought. In addition to this, we also have a confluent psychological resistance at 1.25 based on the H4 timeframe, which boasts September/August's opening levels at 1.2497/1.2481 and a 61.8% H4 resistance (green line) taken from high 1.2778.
Given the collective confluence, this, from where we're standing, is clearly a sellers' market right now. Shorting at the open is certainly an option here, targeting the 1.24 neighborhood as an initial take-profit zone.
Data points to consider: US ISM Manufacturing PMI at 2.45pm, followed by FOMC member Kaplan speaking at 7pm GMT+1.
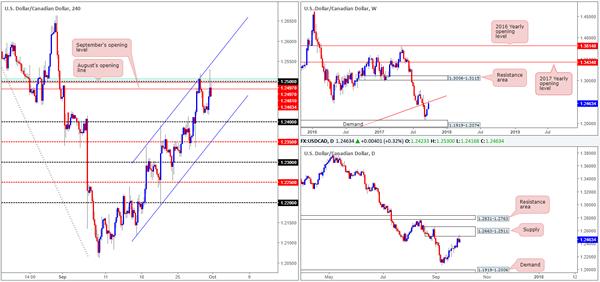
Levels to watch/live orders:
- Buys: Flat (stop loss: N/A).
- Sells: Sells at current price appear attractive (stop loss: aggressive – 1.2502/conservative: 1.2532).
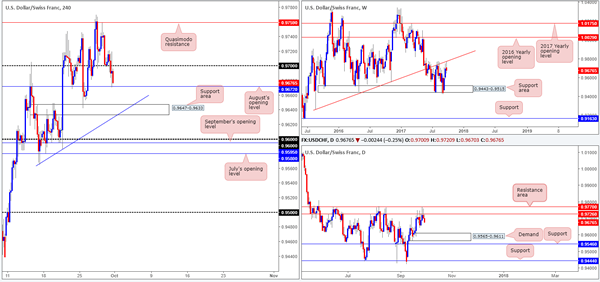
USD/CHF:
Weekly gain/loss: – 16 pips
Weekly closing price: 0.9676
Despite the pair printing fresh highs of 0.9770 last week, price concluded the day trading marginally lower into the close. From a technical standpoint, this was likely due to weekly price bumping heads with a trendline resistance extended from the low 0.9257. What's also interesting from this scale is the weekly USDX candles are currently testing supply noted at 12012-11907.
Alongside weekly flow, we can also see daily price trading from a resistance area pegged at 0.9770/0.9726, as well as USDX daily candles presently shaking hands with supply at 11969-11938. Should the dollar continue to depreciate in value, the next downside target can be seen at demand coming in at 0.9565-0.9611, followed closely by support at 0.9546.
Across on the H4 chart, Friday's movement shows that price finally conquered the 0.97 handle and went on to confront August's opening level at 0.9672. Though both the weekly and daily timeframes signal further selling could be on the cards, a sell on the H4 timeframe is somewhat tricky. Not only do we have to contend with potential buying from the current monthly opening level, there's also the nearby support area seen pegged below at 0.9647-0.9633 (converges with trendline support taken from the low 0.9565).
Suggestions: Owing to the current supports on the H4 timeframe, we've decided to pass on selling this market today. It's just far too restricted for our liking!
Data points to consider: US ISM Manufacturing PMI at 2.45pm, followed by FOMC member Kaplan speaking at 7pm GMT+1.
Levels to watch/live orders:
- Buys: Flat (stop loss: N/A).
- Sells: Flat (stop loss: N/A).
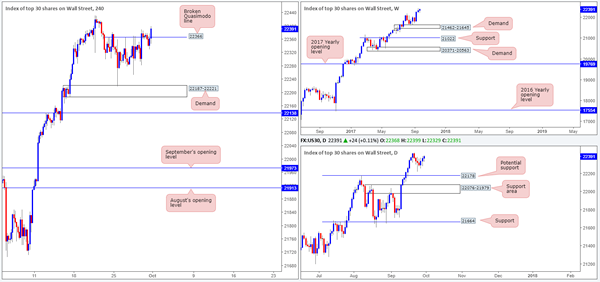
DOW 30:
Weekly gain/loss: + 53 points
Weekly closing price: 22391
US equities closed higher for a third consecutive week in recent trade, forming a nice-looking weekly buying tail in the process. With the index now trading at fresh record highs of 22450, the team is looking to join the current uptrend.
Given price is firmly trading above the H4 Quasimodo resistance level at 22366, this line could be a fantastic barrier to consider buying from should the market dip lower.
Suggestions: To trade long from the current H4 level though, we've agreed that waiting for a reasonably strong H4 bull candle to take shape in the form of a full or near-full-bodied candle would be the better path to take. This is to simply avoid any fakeout that may take place. Should a trade come to fruition from this angle, a break to fresh record highs would be our cue to reduce risk to breakeven and look for fresh support to form.
Data points to consider: US ISM Manufacturing PMI at 2.45pm, followed by FOMC member Kaplan speaking at 7pm GMT+1.
Levels to watch/live orders:
- Buys: 22366 ([waiting for a H4 bullish rotation candle to form is advised] stop loss: ideally beyond the candle's tail).
- Sells: Flat (stop loss: N/A).
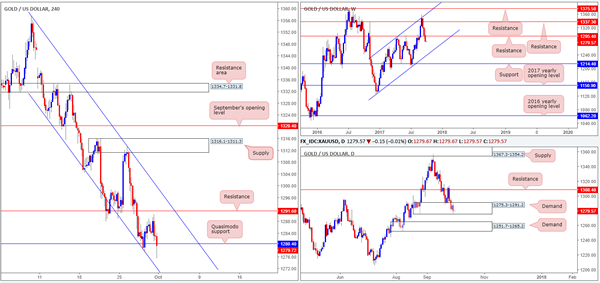
GOLD:
Weekly gain/loss: – $17.4
Weekly closing price: 1279.7
As can be seen from the weekly timeframe, the yellow metal has suffered a string of consecutive losses after connecting with resistance coming in at 1337.3. A continued move to the downside from here would likely bring gold into contact with a channel support extended from the low 1122.8.
Sliding down to the daily timeframe, we can see price ended the week forming a bearish engulfing candle within the walls of a demand base at 1275.3-1291.2. In the event that this encourages further selling, the piece will likely trickle south down to demand registered at 1251.7-1265.2.
Leaving the H4 resistance at 1291.6 unchallenged on Friday, H4 price ended the day marginally closing beneath a Quasimodo support level at 1280.4. This could, in our opinion, spark further selling in early trading, bringing price down to as far as August's opening level at 1269.3 (not seen on the screen), which happens to converge with a channel support taken from the low 1323.0.
Suggestions: Taking all of the above into consideration, we feel price is heading lower today. Watch for H4 price to print an additional close lower and then look to trade any retest seen at the underside of the aforesaid H4 Quasimodo support. Should a H4 bearish candle take shape following the retest in the form of a full or near-full-bodied candle, a short down to August's opening level at 1269.3, followed closely by the top edge of daily demand mentioned above at 1251.7-1265.2, is an option.
Levels to watch/live orders:
- Buys: Flat (stop loss: N/A).
- Sells: Watch for H4 price to engulf the Quasimodo support at 1280.4 and then look to trade any retest seen thereafter ([waiting for a H4 bearish candle to form following the retest is advised] stop loss: ideally beyond the candle's wick).
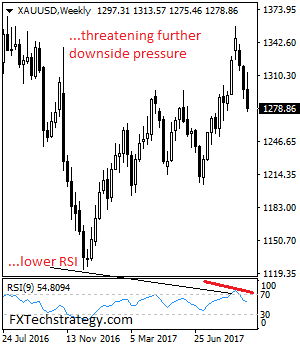
GOLD – Weakens Further, Remains Vulnerable
GOLD - The commodity closed lower the past week leaving risk lower. However, we may see a recovery higher. On the downside, support comes in at the 1,270.00 level where a break will turn attention to the 1,260.00 level. Further down, a cut through here will open the door for a move lower towards the 1,250.00 level. Below here if seen could trigger further downside pressure targeting the 1,240.00 level. Conversely, resistance resides at the 1,290.00 level where a break will aim at the 1,300.00 level. A turn above there will expose the 1,310.00 level. Further out, resistance stands at the 1,320.00 level. All in all, GOLD looks to weaken further on bear pressure.
EURUSD – Closes Lower For The Week But With Caution
EURUSD - With the pair closing lower the past week, more weakness should follow. However, we may see a recovery higher following its Friday recovery (see daily chart). Resistance comes in at 1.1850 level with a cut through here opening the door for more upside towards the 1.1900 level. Further up, resistance lies at the 1.1950 level where a break will expose the 1.2000 level. Conversely, support lies at the 1.1750 level where a violation will aim at the 1.1700 level. A break of here will aim at the 1.1650 level. Below here will open the door for more weakness towards the 1.1600. All in all, EURUSD continues to face further corrective weakness threats but with caution
Climacteric Catalonia
Climacteric Catalonia
In addition to consternation in Catalonia, the start of Q4 brings a deluge of central bank speakers along with the main sentiment and inflation prints. Forex markets will continue to be sensitive to headline risk so we should expect conditions to remain whippy.
But traders will continue to be vigilant as they search the news tickers for headline clues as to who the next Fed Chair will be, and how the tax reform process is going.
President Trump advised that he expects to decide on the next Fed Chair in the next two to three weeks. Newswires were abuzz that former Governor Kevin Warsh was Trump’s frontrunner.
Rabid price action closed the door to a significant Q 3, a quarter greately influenced by political and geopolitical concerns topped off by shifting central bank narratives.
Both the S&P and NASDAQ rocketed higher with the latter pulverising its record close staged on September 15, this despite US bond yields recording an outside month with interest rates climbing aggressively on the inflationary prospects from US tax reform. Unquestionably the US administrations Tax Plan has breathed some life into January’s Trumpflation trade.
In addition, Friday’s bond flows were influenced by the future course of US monetary policy after reports surfaced that former Fed Governor Kevin Warsh will be steering the Fed ship come 2018. Warsh is viewed hawkish by the markets, critical of QE and an advocate for a faster pace of policy normalisation.But with Dr Yellen sounding ever so hawkish these days, regardless of who is at the Fed helm, a significant policy shift could be in store.
As for Monetary Policy, equity markets continue to take an entirely different view than Bond Markets as stock market euphoria rages on propelled by tax cuts and perhaps a misguided belief that history will repeat itself as equity markets have risen seven times in the last eight years between October and December. But given the changing dynamics at the Federal Reserve and with a shift to a faster rate of policy normalising all but certain, something will come out in the “Warsh.” sooner than later
While the controversial Catalan referendum in Spain dominated weekend headlines, the markets still believe the risk of Catalonia leaving Spain remains low, and the Euro has completely sidestepped this political risk in early APAC trading.
Japanese Yen
JPY is wedged between different triggers as the market ebbs and flows in the mid to high 112 The Japan elections this month present significant market risk, and trading JPY will remain extremely tricky. It’s more likely that interbank players will reduce risk with Abe approval rating declining so this may not be the easiest game in town.
Australian Dollar
The AUD/USD is unchanged from Friday’s closing level choosing to ignore the Chinese PMI reports released over the weekend which came in better than expected. But I would expect this China data to temper AUD selling at current levels.
The markets remain focused on the next Fed Chair and US Tax reform which should be the main triggers for the USD this week. I expect traders will keep eyes peeled and ears to the ground for shifting headline risk.
Asian FX
Asian FX is coming off its worst move of the year arguably driven by short covering on mostly oversold USD positioning with US Tax Reform and Fed Chair banter providing both the fiscal and monetary catalyst. Now with positioning risk much cleaner. Investors may take advantage of pockets of opportunity in the MYR, KRW and THB currencies as these exporting economies should continue to do well on the back of the global growth narrative despite higher US yields. However, the top yield appeal in the IDR and INR may wane until both US dollar Tax Reform driven appeal abates.
As a reminder, CNY is out for the whole week due to Golden Week, so we should expect diminished liquidity conditions during Asia Hours
EURO
The Euro remains in broad ranges but the markets bullish medium-term bias remains unfettered
EUR/USD Weekly Outlook
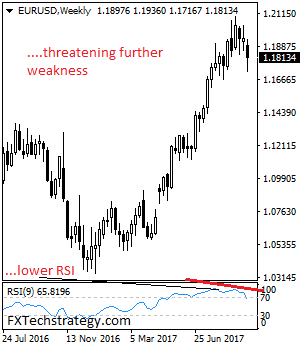
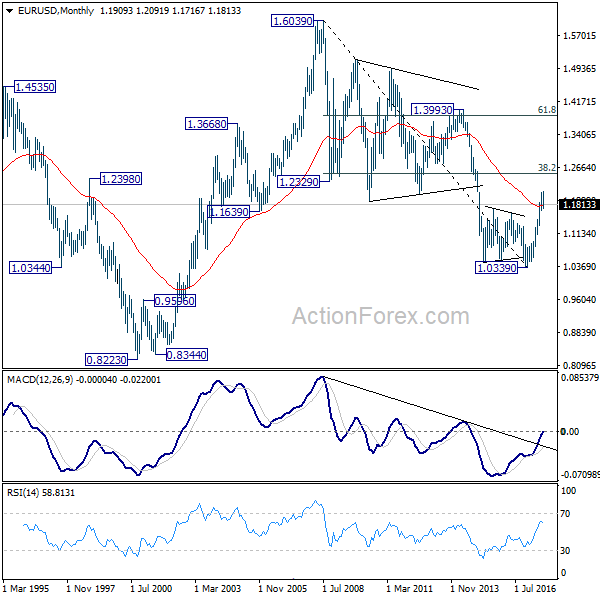
EUR/USD dropped sharply to 1.1716 last week before forming a temporary low there and recovered. Initial bias is neutral this week first. Current development suggests that decline from 1.2091 is correcting whole rise from 1.0569. Deeper fall is expected as long as 1.22029 resistance holds. Below 1.1716 will target 38.2% retracement of 1.0569 to 1.2091 at 1.1510, where we're expecting support to bring rebound.
In the bigger picture, rise from medium term bottom at 1.0339 is not finished yet. It's expected to continue after pull back from 1.2091 completes. And, next target will be 38.2% retracement of 1.6039 (2008 high) to 1.0339 (2017 low) at 1.2516. However, it should be noted that there is no confirmation of trend reversal yet. That is, such rebound from 1.0399 could be a correction. And the long term fall from 1.6039 (2008 high) could resume. Hence, we'd be cautious on strong resistance from 1.2516 to limit upside.
In the long term picture, 1.0339 is now seen as an important bottom as the down trend from 1.6039 (2008 high) could have completed. It's still early to decide whether price action form 1.0339 is developing into a corrective or impulsive move. But in either case, further rally would be seen to 38.2% retracement of 1.6039 to 1.0339 at 1.2516
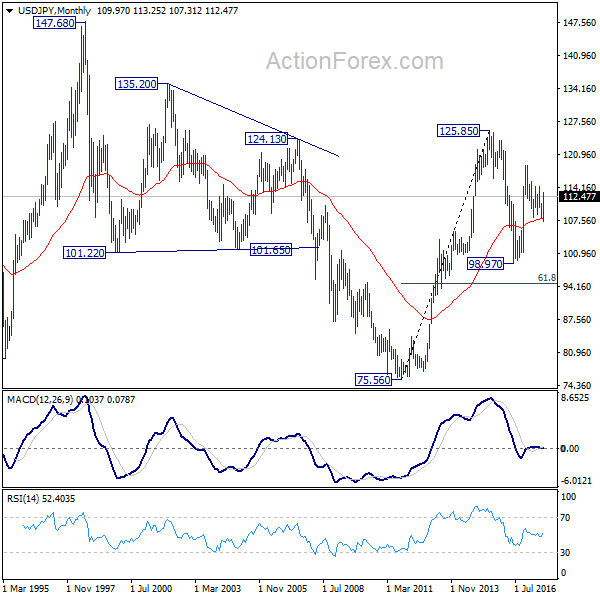
USD/JPY Weekly Outlook
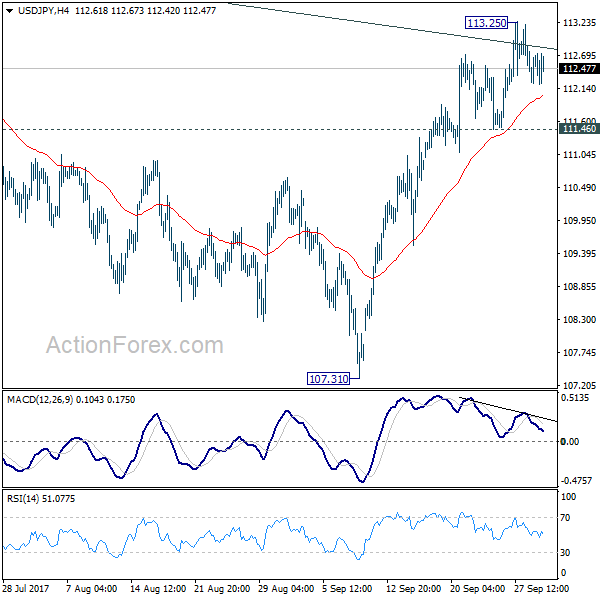
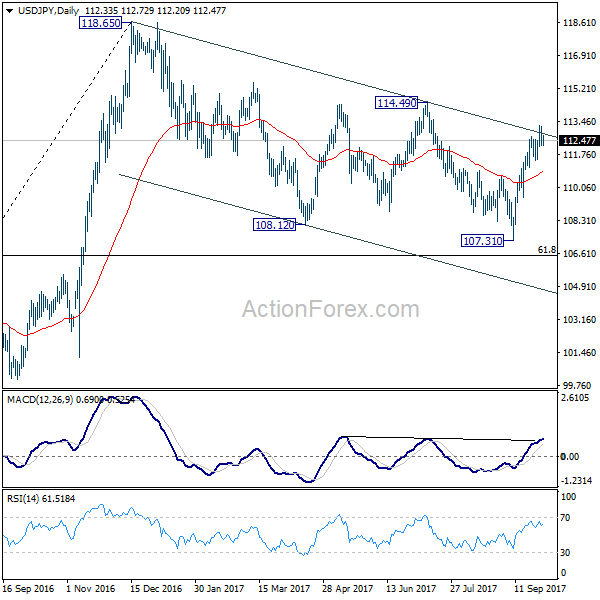
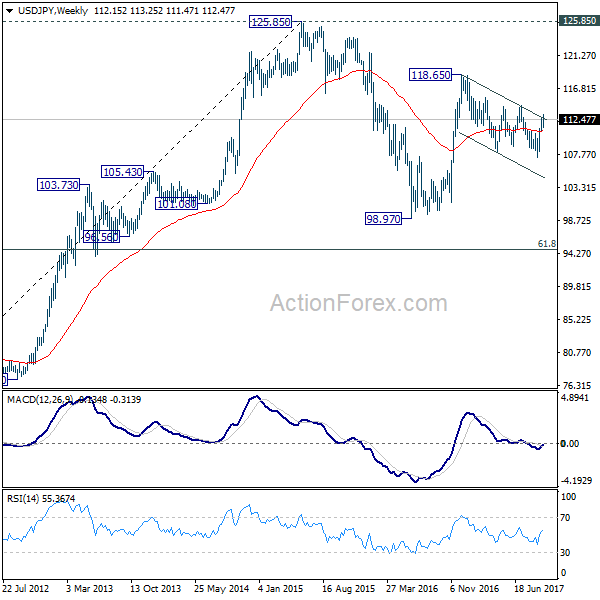
USD/JPY edged higher to 113.25 last week but failed to sustain above medium term channel resistance. Initial bias is neutral this week first. With 111.46 minor support intact, further rise is in favor. Sustained break of medium term channel resistance will argue that correction from 118.65 is already completed with three waves down to 107.31. Break of 114.49 will confirm this bullish case and target a test on 118.65 next. On the downside, considering bearish divergence condition in 4 hour MACD, break of 111.46 will suggest rejection from the channel resistance and turn bias back to the downside.
In the bigger picture, rise from 98.97 (2016 low) is seen as the second leg of the corrective pattern from 125.85 (2015 high). It's unclear whether this this second leg has completed at 118.65 or not. But medium term outlook will be mildly bearish as long as 114.49 resistance holds. And, there is prospect of breaking 98.97 ahead. Meanwhile, break of 114.49 will bring retest of 125.85 high. But even in that case, we don't expect a break there on first attempt.
In the long term picture, the rise from 75.56 (2011 low) long term bottom to 125.85 top is viewed as an impulsive move, no change in this view. Price actions from 125.85 are seen as a corrective move which could still extend. In case of deeper fall, downside should be contained by 61.8% retracement of 75.56 to 125.85 at 94.77. Up trend from 75.56 is expected to resume at a later stage for above 135.20/147.68 resistance zone.
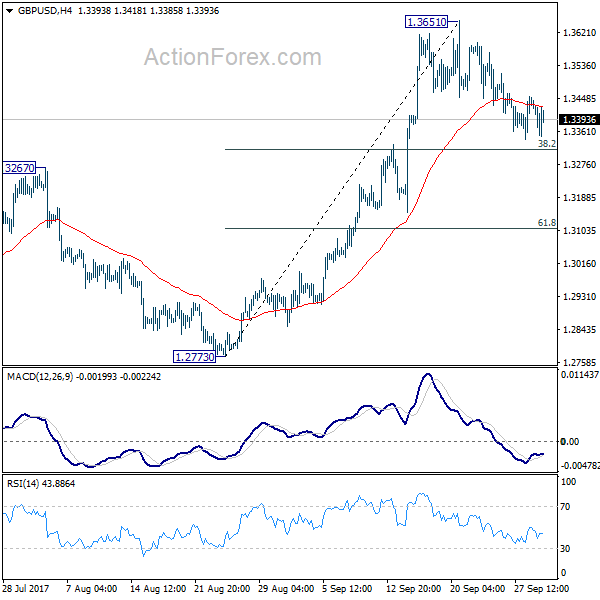
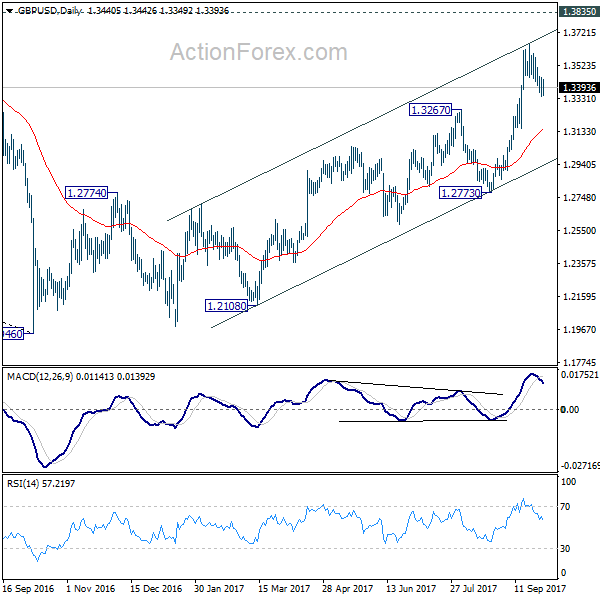
GBP/USD Weekly Outlook
GBP/USD's correction from 1.3651 continued last week but overall outlook is unchanged. Initial bias stays neutral this week first. Downside of retreat should be contained by 38.2% retracement of 1.2773 to 1.3651 at 1.3316 and bring rise resumption. Break of 1.3651 will extend the larger rally for 1.3835 support turned resistance next.
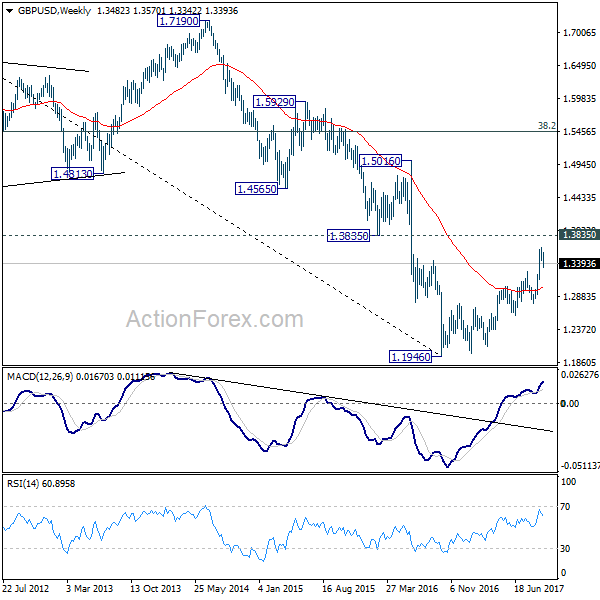
In the bigger picture, current development argues that the long term trend in GBP/USD has reversed. That is, a key bottom was formed back in 1.1946 on bullish convergence condition in monthly MACD. Current rise from 1.1946 will target 38.2% retracement of 2.1161 (2007 high) to 1.1946 (2016 low) at 1.5466 next. In any case, medium term outlook will now stay bullish as long as 1.2773 support holds.
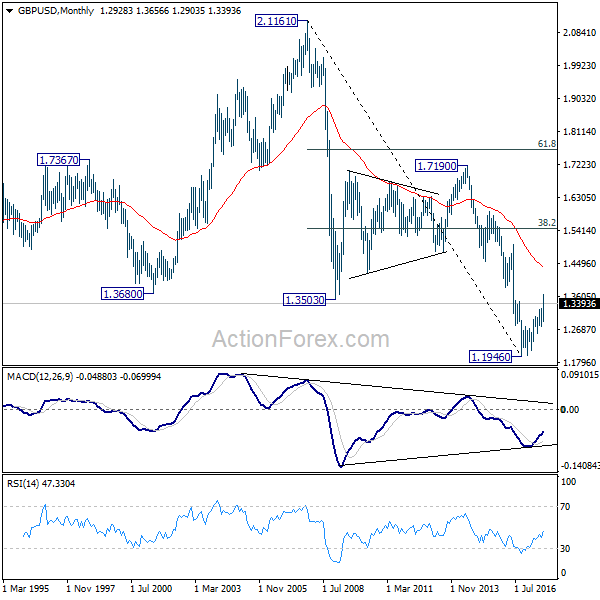
In the longer term picture, current development argues that whole down trend from 2.1161 (2007 high) is completed at 1.1946 already (2016 low). It's too early to tell if GBP/USD is starting a long term up trend. But in any case, further rise is in favor to 38.2% retracement of 2.1161 to 1.1946 at 1.5466 next. We'll monitor the structure of the current rally from 1.1946 to decide if it's an impulsive move.