Sample Category Title
USD/CHF Daily Outlook
Daily Pivots: (S1) 0.9679; (P) 0.9718; (R1) 0.9740; More....
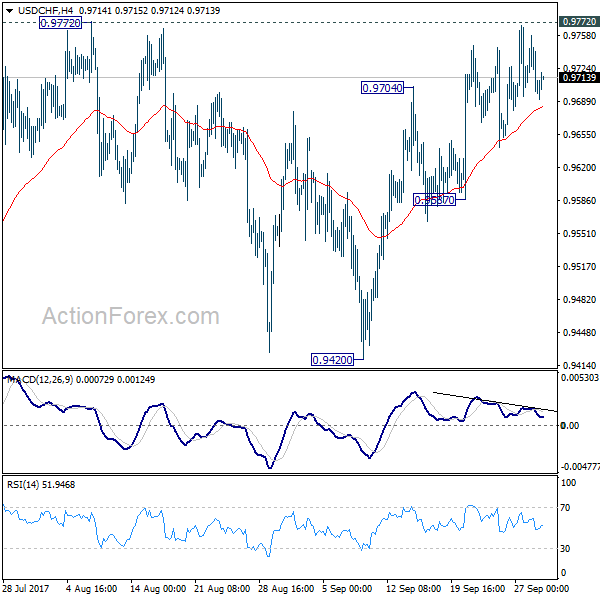
Outlook in USD/CHF remains unchanged with focus staying on 0.9772 key resistance. Decisive break there will suggest that whole down trend form 1.0342 has completed. In that case, near term outlook will be turned bullish for 0.9860/1.0099 resistance zone. Nonetheless, with 0.9772 resistance intact, outlook remains bearish. Below 0.9587 minor support will turn bias back to the downside for retesting 0.9420 low.
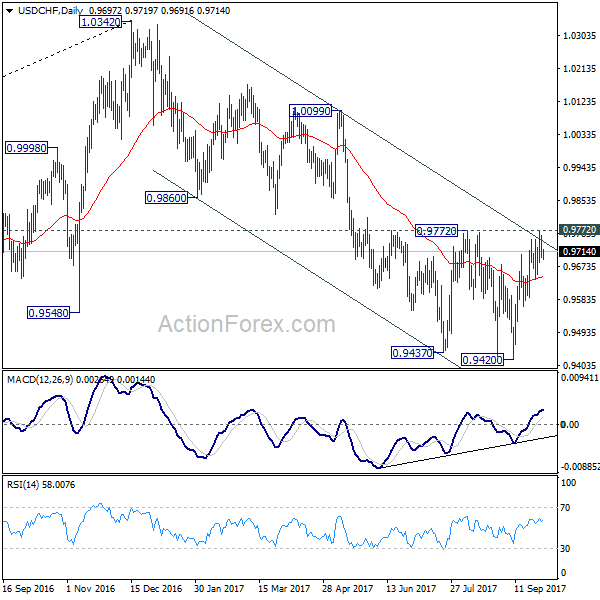
In the bigger picture, focus remains on whether 0.9443 key support (2016 low) could be taken out firmly as down trend from 1.0342 extends. There are various interpretation of the price actions. But in any case, medium term outlook will stay bearish as long as 0.9772 resistance holds. Current down trend could extend to 38.2% retracement of 0.7065 (2011 low) to 1.0342 (2016 high) at 0.9090. However, break of 0.9772 will indicate that USD/CHF has successfully defended 0.9443 again and turn outlook bullish for 1.0099 resistance.
USD/JPY Daily Outlook
Daily Pivots: (S1) 111.99; (P) 112.59; (R1) 112.94; More...
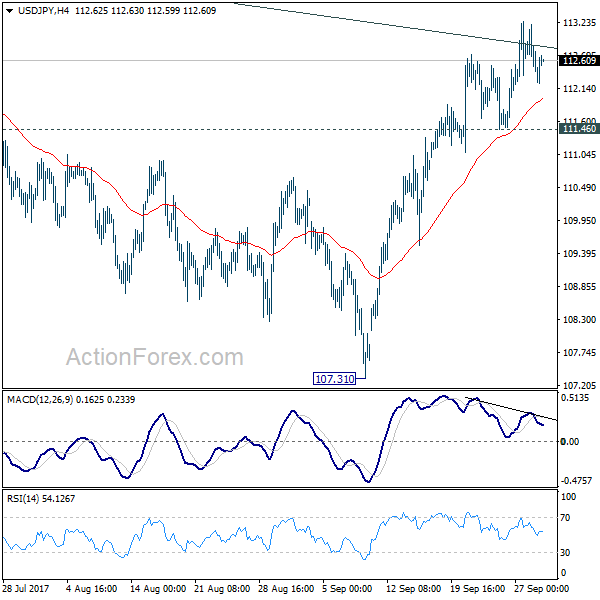
USD/JPY continues to lose upside momentum. But still, with 111.46 minor support intact, further rise is expected. Sustained break of medium term channel resistance will argue that correction from 118.65 is already completed with three waves down to 107.31. Break of 114.49 will confirm this bullish case and target a test on 118.65 next. On the downside, however, break of 111.46 will suggest rejection from the channel resistance and turn bias back to the downside.
In the bigger picture, rise from 98.97 (2016 low) is seen as the second leg of the corrective pattern from 125.85 (2015 high). It's unclear whether this this second leg has completed at 118.65 or not. But medium term outlook will be mildly bearish as long as 114.49 resistance holds. And, there is prospect of breaking 98.97 ahead. Meanwhile, break of 114.49 will bring retest of 125.85 high. But even in that case, we don't expect a break there on first attempt.

Daily Technical Outlook And Review: EUR/USD, GBP/USD, AUD/USD, USD/JPY, USD/CAD, USD/CHF, DOW 30, GOLD
A note on lower timeframe confirming price action...
Waiting for lower timeframe confirmation is our main tool to confirm strength within higher timeframe zones, and has really been the key to our trading success. It takes a little time to understand the subtle nuances, however, as each trade is never the same, but once you master the rhythm so to speak, you will be saved from countless unnecessary losing trades. The following is a list of what we look for:
- A break/retest of supply or demand dependent on which way you're trading.
- A trendline break/retest.
- Buying/selling tails ... essentially we look for a cluster of very obvious spikes off of lower timeframe support and resistance levels within the higher timeframe zone.
- Candlestick patterns. We tend to only stick with pin bars and engulfing bars as these have proven to be the most effective.
We typically search for lower-timeframe confirmation between the M15 and H1 timeframes, since most of our higher-timeframe areas begin with the H4. Stops are usually placed 1-3 pips beyond confirming structures.
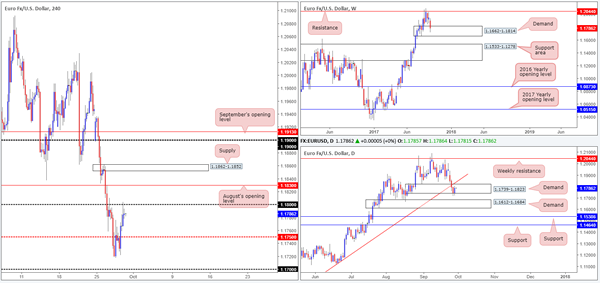
EUR/USD
Across the board, we can see that the US dollar sold off against the majority of its trading peers on Thursday. USDX action shows price tapped the underside of H4 resistance at 11962 and also shook hands with daily supply coming in at 11969-11938. Consequent to this, the EUR was able to muster enough strength to breach the H4 mid-level resistance at 1.1750 and touch gloves with the 1.18 handle going into the closing bell.
Technically speaking, the single currency has been entrenched within a strong uptrend since the beginning of the year. Couple this with the current weekly demand pegged at 1.1662-1.1814, higher prices may be on the cards today/next week. On the daily timeframe, demand at 1.1739-1.1823, although recently suffered a minor breach, managed to remain in the game yesterday. The only grumble from this angle is the nearby trendline resistance extended from the low 1.0839 which could potentially halt further buying.
Suggestions: To our way of seeing things, neither a long nor short is attractive this morning as the market appears restricted from both ends right now.
To the upside, buyers have to contend with not only the 1.18 handle and August's opening level at 1.1830, there's also the daily trendline resistance to consider as well. Selling from 1.18 is just as tricky since a short would effectively place one against potential weekly and daily buyers (see above).
Data points to consider: German Retail sales m/m at 7am; EUR CPI flash estimate y/y at 10am. US Core PCE at 1.30pm; FOMC member Harker speaks at 4pm GMT+1.
Levels to watch/live orders:
- Buys: Flat (stop loss: N/A).
- Sells: Flat (stop loss: N/A).
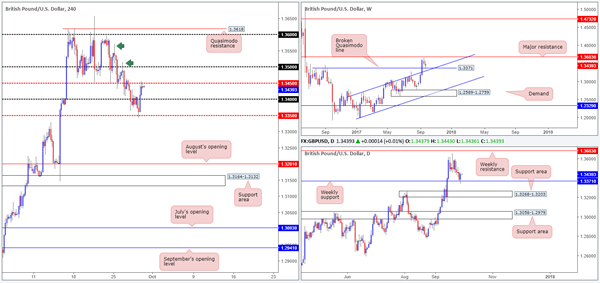
GBP/USD
Looking at the weekly timeframe this morning, it's clear to see the major establishing support from a broken Quasimodo line at 1.3371. Providing that the bulls remain in the driving seat here, the next resistance on tap can be seen at 1.3683.
Weekly buying, as you can see on the H4 timeframe, forced the British pound above the 1.34 handle on Thursday and eventually up to the mid-level resistance at 1.3450 by the day's end. The pair is likely to find temporary resistance around this mid-way point with it having been a reasonably conspicuous point of support last week.
Suggestions: Given the GBP's underlying trend at the moment, along with current weekly support, the team is biased to the upside. However, it will only be once price has crossed above 1.3450 will the desk look to become buyers in this market. A retest of 1.3450 as support, coupled with a reasonably sized H4 bull candle, preferably in the shape of a full or near-full-bodied candle, would be ideal buying conditions.
Should this trade come to fruition, the ultimate target is the 1.36 neighborhood. We've chosen this level due to the H4 consumption wicks seen marked with green arrows at 1.3514/1.3570. These two candles, in our technical view, likely cleared a high percentage of unfilled orders in the market, thus once price returns to the areas the unit should not have too much of a hard time pressing higher.
Data points to consider: UK Current account and final GDP q/q figures at 9.30am; BoE Gov. Carney speaks at 3pm. US Core PCE at 1.30pm; FOMC member Harker speaks at 4pm GMT+1.
Levels to watch/live orders:
- Buys: Watch for H4 price to close above 1.3450 and then look to trade any retest seen thereafter ([waiting for a H4 bullish rotation candle to form following the retest is advised] stop loss: ideally beyond the candle's tail).
- Sells: Flat (stop loss: N/A).
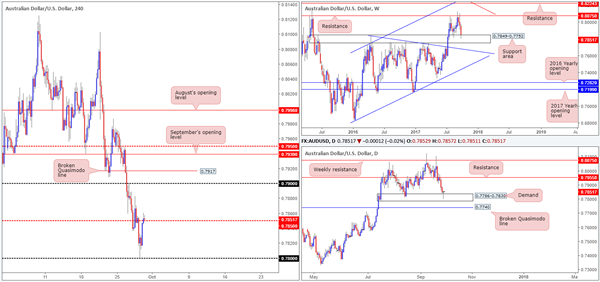
AUD/USD
Trade update: taken out at breakeven – 0.7839.
As the USDX H4 timeframe crossed swords with resistance at 11962 yesterday, the commodity currency simultaneously shook hands with the 0.78 psychological band. Strengthening the bulls from here, nevertheless, is both weekly and daily structure. On the weekly timeframe, the unit is currently seen retesting a support area at 0.7849-0.7752 that stretches as far back as mid-2015. Down on the daily timeframe, price is also trading from a strong-looking demand at 0.7786-0.7838 (housed within the walls of the noted weekly support area), which, as you can see, forced candle action to chalk up a reasonably attractive buying tail yesterday.
So, the question is, where do we go from here? From a technical standpoint, we're expecting the Aussie to extend gains today/next week up to at least the 0.79 handle/H4 broken Quasimodo line at 0.7917. Seeing as the H4 candles recently cleared the 0.7850 mid-way resistance line, a long on the retest of this base could be an option.
Suggestions: Drill down to the lower timeframes and try to pin down a long entry off 0.7850. For ideas on how to use lower-timeframe action as a means of entry, check out the top of this report.
Data points to consider: Chinese Caixin manufacturing PMI at 2.45am. US Core PCE at 1.30pm; FOMC member Harker speaks at 4pm GMT+1.
Levels to watch/live orders:
- Buys: 0.7850 region ([waiting for lower-timeframe confirmation here is advised] stop loss: dependent on where one confirms this area).
- Sells: Flat (stop loss: N/A).
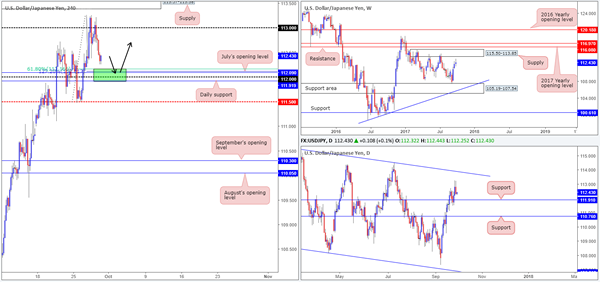
USD/JPY
The USD/JPY experienced a somewhat aggressive downside move on Thursday after whipsawing through the underside of the 113 handle. Influenced by overall dollar losses (USDX traded from H4 resistance at 11962), the pair ended the day closing 30 or so pips ahead of the 112 handle.
Although intraday movement shows bids coming into the market as we write, the 112 handle is, in our technical view, an incredibly appealing level at the moment. Here's why:
Positioned directly above daily support at 111.91.
Located just below July's opening level at 112.09.
Nearby a 61.8% Fib support at 112.16 taken from the low 111.47.
Boasts a 127.2% Fib ext. point at 112.12 extended from the high 113.25.
Suggestions: With space seen for both weekly and daily action to push higher, coupled with the 112 handle's surrounding confluence mentioned above, longs from the green H4 buy zone are worthy of attention. As psychological levels are prone to fakeouts, however, the team has decided to wait for H4 price to confirm buyer intent before pulling the trigger. For us, this would simply be a full or near-full-bodied bullish candle formed within the green zone, which would give us the confidence to hold up to at least 113/H4 supply at 113.57-113.38.
Data points to consider: US Core PCE at 1.30pm; FOMC member Harker speaks at 4pm GMT+1.
Levels to watch/live orders:
- Buys: 111.91/112.16 ([waiting for a reasonably sized H4 bullish candle to form – preferably a full, or near-full-bodied candle – is advised] stop loss: ideally beyond the candle's tail).
- Sells: Flat (stop loss: N/A).
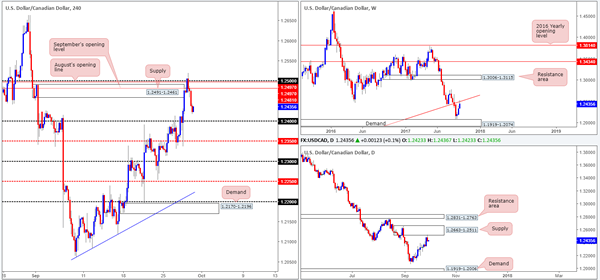
USD/CAD
For those who read Thursday's tech report you may recall our team highlighting the possibility of H4 price faking above supply at 1.2491-1.2461. As you can see, the unit did not only fake above this supply, it also pierced above August's opening level at 1.2497/1.25 handle. This was to be expected. Not only because psychological levels are prone to fakeouts, but also due to what was lurking above these H4 structures – a daily supply at 1.2663-1.2511 that fused with a long-term weekly trendline resistance etched from the low 0.9633.
We also went on mention that if you were looking to take advantage of any potential move lower from this region, it'd be best to wait for additional candle confirmation in the form of a full or near-full-bodied bearish candle. As can be clearly seen on the H4 chart, following the fakeout a nice-looking near-full-bodied candle came to fruition and thereby allowed us to short at 1.2479 with a stop pegged just above the candle's wick at 1.2521. Well done to any of our readers who managed to jump aboard this move!
Suggestions: We recently reduced risk to breakeven on our current short. The first take-profit target for us is 1.24. Here we'll look to take 50% off the table and then begin eyeing the 1.2350 base as a second line of interest.
Apart from our current short call, we do not see much else to hang our hat on at the moment.
Data points to consider: US Core PCE at 1.30pm; FOMC member Harker speaks at 4pm. Canadian growth figures at 1.30pm GMT+1.
Levels to watch/live orders:
- Buys: Flat (stop loss: N/A).
- Sells: 1.2479 ([live] stop loss: breakeven).
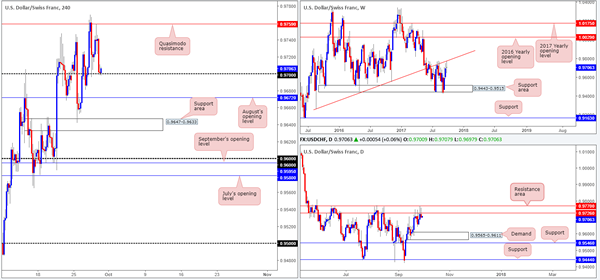
USD/CHF:
The USD/CHF corrected sharply lower after H4 price revisited the Quasimodo resistance at 0.9759 during trade yesterday, consequently forcing the Swissy back down to the 0.97 neighborhood. Despite this psychological number holding firm on Wednesday, there's a good chance that we're going to see this level give way soon. Our rationale behind this approach stems from higher-timeframe structure. Weekly price is seen trading from a trendline resistance extended from the low 0.9257. Alongside this, we can also see that daily price trading from a resistance area pegged at 0.9770/0.9726 in the shape of a nice-looking selling wick.
Suggestions: A break below 0.97, although both the weekly and daily timeframes indicate further selling could be on the cards, is unfortunately a challenging sell. This is because of August's opening level plotted just below at 0.9672, followed closely by a H4 support area at 0.9647-0.9633. Therefore, opting to stand on the sidelines today may be the better bet today.
Data points to consider: US Core PCE at 1.30pm; FOMC member Harker speaks at 4pm GMT+1.
Levels to watch/live orders:
- Buys: Flat (stop loss: N/A).
- Sells: Flat (stop loss: N/A).
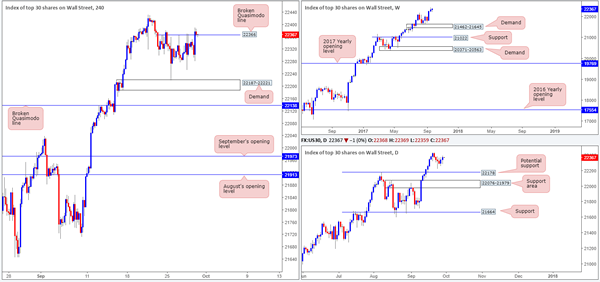
DOW 30:
US equities extended higher for a second consecutive day yesterday, forcing H4 price to marginally close beyond the Quasimodo resistance line at 22366. With this line now acting as possible support, there's a chance that the index could gravitate higher from here today. Why? Well, the key thing to remember here is this market remains entrenched within a strong uptrend, and is trading from record highs. This – coupled with offers likely cleared from the noted H4 barrier, along with little to no resistance seen on the higher timeframes, further upside is the favored approach, in our humble opinion.
Suggestions: To trade long from the current H4 level though, the desk has agreed that waiting for a reasonably strong H4 bull candle to take shape in the form of a full or near-full-bodied candle would be the better path to take. Should a trade come to fruition from this angle, a break to fresh record highs would be our cue to reduce risk to breakeven and look for fresh support to form.
Data points to consider: US Core PCE at 1.30pm; FOMC member Harker speaks at 4pm GMT+1
Levels to watch/live orders:
- Buys: 22366 ([waiting for a H4 bullish rotation candle to form is advised] stop loss: ideally beyond the candle's tail).
- Sells: Flat (stop loss: N/A).
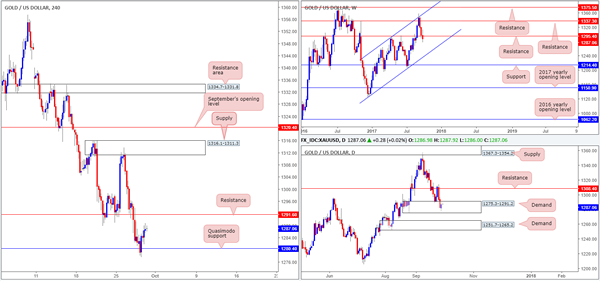
GOLD
Breaking a two-day bearish phase, the bulls recovered nicely from a H4 Quasimodo support at 1280.4 yesterday, placing H4 price within striking distance of resistance coming in at 1291.6. Bolstering yesterday's upside move, however, was daily price which is seen trading from within the walls of a demand base penciled in at 1275.3-1291.2. Further upside from this vicinity could lead to the yellow metal shaking hands with resistance at 1308.4. On the other side of the coin, we can see that weekly price remains beneath resistance at 1295.4. A continued move to the downside from here would likely bring gold into contact with a channel support extended from the low 1122.8.
Suggestions: In view of the unit's close proximity to H4 resistance, as well as weekly action trading below a major resistance barrier, buying this market on the basis of price occupying the current daily demand is not something we'd stamp as a high-probability move. Having said that, selling would be just as risky, in our opinion, as although you'd effectively be trading in-line with weekly/H4 flow, you'd simultaneously be selling into potential daily buying!
Considering the above, the team has concluded that remaining flat is the safer route to take today.
Levels to watch/live orders:
- Buys: Flat (stop loss: N/A).
- Sells: Flat (stop loss: N/A).
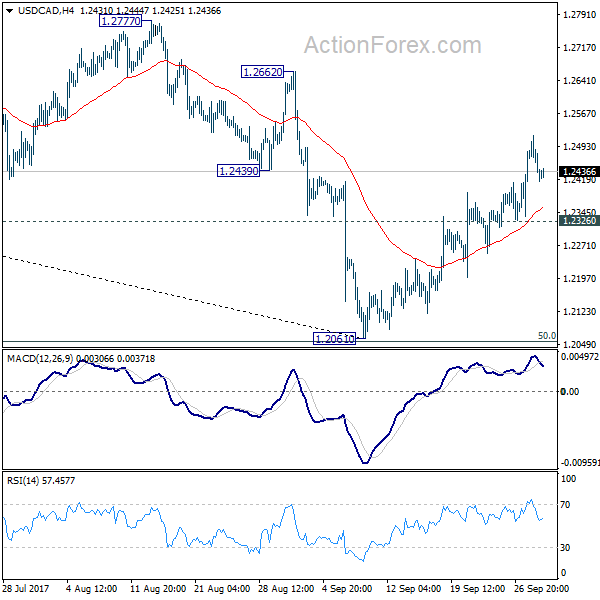
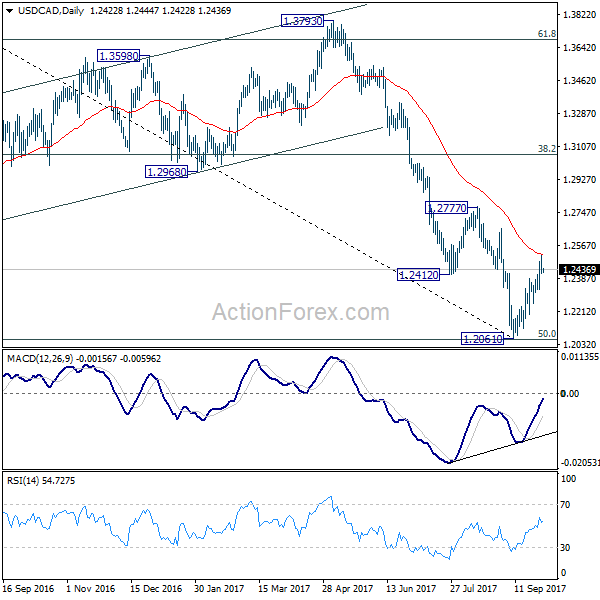
USD/CAD Daily Outlook
Daily Pivots: (S1) 1.2388; (P) 1.2453; (R1) 1.2492; More....
With 1.2326 minor support intact, further rally is expected in USD/CAD. The pair should have successfully defended key long term fibonacci level at 2.1048. Rise from 1.2061 should extend to 1.2777 resistance first. Decisive break there will target 38.2% retracement of 1.4689 to 1.2061 at 1.3065 next. However, break of 1.2326 will dampen this bullish view and turn bias back to the downside for 1.2061 instead.
In the bigger picture, focus remains on 50% retracement of 0.9406 (2011 low) to 1.4869 (2016 high) at 1.2048. As long as this level holds, we'd still favor that case that fall from 1.4689 is a correction. Rebound from 1.2048 could extend the larger up trend from 0.9406. However, firm break of 1.2048 will indicate that fall from 1.4689 is at least a medium term down trend and should target 61.8% retracement at 1.1424 and below.
Dollar Losing Momentum as Markets Reassess US Tax Plan, Busy Day ahead
Dollar is losing some momentum but it's still likely to end the week as the strongest one. The initial reactions for US President Donald Trump's tax plan were positive. But markets quickly turned into cautious mode as they reassess the situation. DOW gained 0.18% to 22381.20 overnight, but stayed below 22419.51 record high made last week. S&P 500 ended at new record at 2510.06 by was kept below Thursday's high as 2511.75. 10 Year yield opened sharply higher and jumped to as high as 2.344, but pared back all gains to close flat at 2.309. In the currency markets, commodity currencies are set to end as the weakest ones. Euro, Yen and Sterling could end the week mixed.
Markets hesitate with no follow through buying
Based on the developments so far, the markets seem to be not totally convinced by Trump's tax plan. There was lift to sentiments, but back then, the markets could have long given up. And, another change to 0% chance of Trump reflation trade is a boost. But there was no follow through buying seen so far as many questions remained unanswered. From trading/investing point of view, the key questions are whether the plan could go through Congress, and in speedy way. And, how much would the tax plan really help the economy?
Based on initially responses, there are already heavy criticisms on raising the lowest tax rate on individuals from 10% to 12%. And, at the same time, tax rate on high earners is lowered from 39.6% to 35% and corporates from 35% to 20%. That creates the impression that the plan is helping the riches rather than the poors and Democrats are in clear objection to it. Also, Trump's ex-chief strategies Steve Bannon has been calling for raising the top tax rate to 44% and he pledged to batter the "establishment" Republicans on behalf of blue-collars. Trump could be facing a tough battle with his former ally. At the same time, the questions on funding the loss in tax revenue is unanswered yet, at least not satisfactorily answered. And there are questions on whether a cut in tax revenue would eventually lead to constraints in infrastructure spending.
More time is needed for the markets to digest these questions before taking a more decisive stance.
One BoJ member called for expanding stimulus
Summary of opinions in the September BoJ meeting showed that one policymaker called for expanding monetary stimulus. Meanwhile, all other nine-members were in consensus to maintain the current program. The dovish member was quoted saying that "it's necessary to stimulate demand further with additional monetary easing to achieve and stabilize inflation at the BOJ's target, given a scheduled sales tax hike in October 2019." The dissenting member was not named in the summary, but it's rather clear that the meeting statement showed newcomer Goushi Kataoka dissented last time. And Kataoka is widely known as a dove that advocates aggressive easing. The summary also showed concerns over escalating tensions between US and North Korea. One member was quoted saying that "if geopolitical risks heighten further, the BOJ must be ready to consider taking necessary policy adjustments to prevent deflationary mindset from re-emerging."
Abe formally announced snap election on October 22
Yesterday, Japan's Prime Minister Shinzo Abe formally announced to dissolve the parliament before the snap election on October 22. He believed the high popularity of his Liberal Democratic Party (LDP) would secure him another term. However, the results are being far from certain. Polls showed that Tokyo Governor Yuriko Koike's Party of Hope, only formally launched on Wednesday, has gained support of 18%, compared to LDP's 29%. A merge between Party of Hope and Japan's major opposition Democratic Party (Democratic Party has announced to run its candidates under Koike's Party of Hope) would make this new party a real challenge to the incumbent.
On the data front
Released from Japan, National CPI core accelerated to 0.7% yoy in August, up from 0.5% yoy. Tokyo CPI core rose to 0.5% yoy, up from 0.4% yoy. Unemployment rate was unchanged at 2.8%, household spending rose 0.6% yoy, retail sales rose 1.7% yoy, industrial production rose 2.1% mom. New Zealand building permits rose 10.2% mom in August. UK Gfk consumer confidence improved to -9 in September.
The calendar in very busy today. Eurozone CPI will be a major focus in European session. Germany will release unemployment and retail sales. Swiss will release KOF leading indicator. UK will release Q2 GDP final, M4, mortgage approvals, current account.
Later in the day, US will release personal income and spending, as well as Chicago PMI. Canada will release GDP and IPPI/RMPI.
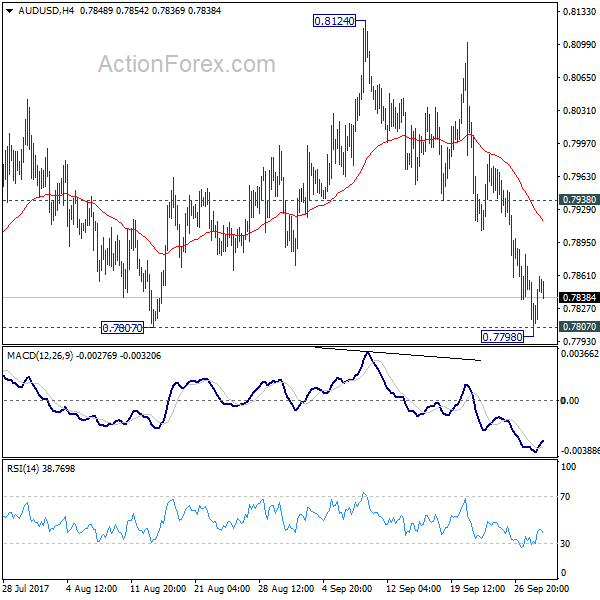
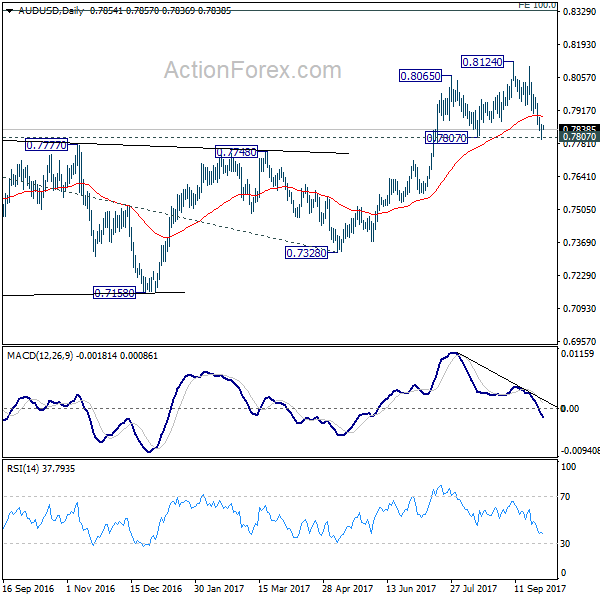
AUD/USD Daily Outlook
Daily Pivots: (S1) 0.7817; (P) 0.7839; (R1) 0.7878; More...
AUD/USD dipped to as low as 0.7798 but quickly drew support from 0.7807 key support level and recovered. Intraday bias is turned neutral first. Considering bearish divergence condition in daily MACD, firm break of 0.7807 will indicate near term reversal. Outlook will then be turned bearish for 55 week EMA (now at 0.7670) first. Meanwhile, rebound from 0.7807 will retain bullishness. Above 0.7938 minor resistance will turn bias back to the upside for retesting 0.8124 high.
In the bigger picture, rise from 0.6826 medium term bottom is still in progress. At this point, there is no confirmation of trend reversal yet and we'll continue to treat such rebound as a corrective pattern. But in any case, break of 55 month EMA (now at 0.8090) will target 38.2% retracement of 1.1079 to 0.6826 at 0.8451. Break of 0.7807 support is needed to to be the first sign of completion of the rebound. Otherwise, further rise is now in favor.
Economic Indicators Update
| GMT | Ccy | Events | Actual | Forecast | Previous | Revised |
|---|---|---|---|---|---|---|
| 21:45 | NZD | Building Permits M/M Aug | 10.20% | -0.70% | -1.70% | |
| 23:01 | GBP | GfK Consumer Confidence Sep | -9 | -11 | -10 | |
| 23:30 | JPY | Unemployment Rate Aug | 2.80% | 2.80% | 2.80% | |
| 23:30 | JPY | Household Spending Y/Y Aug | 0.60% | 0.90% | -0.20% | |
| 23:30 | JPY | National CPI Core Y/Y Aug | 0.70% | 0.70% | 0.50% | |
| 23:30 | JPY | Tokyo CPI Core Y/Y Sep | 0.50% | 0.50% | 0.40% | |
| 23:50 | JPY | BOJ Summary of Opinions Sept.20-21 Meeting | ||||
| 23:50 | JPY | Retail Trade Y/Y Aug | 1.70% | 2.40% | 1.90% | 1.80% |
| 23:50 | JPY | Industrial Production M/M Aug P | 2.10% | 1.80% | -0.80% | |
| 5:00 | JPY | Housing Starts Y/Y Aug | 0.60% | -2.30% | ||
| 6:00 | EUR | German Retail Sales M/M Aug | 0.50% | -1.20% | ||
| 7:00 | CHF | KOF Leading Indicator Sep | 105.5 | 104.1 | ||
| 7:55 | EUR | German Unemployment Change Sep | -5K | -5K | ||
| 7:55 | EUR | German Unemployment Rate Sep | 5.70% | 5.70% | ||
| 8:30 | GBP | Current Account (GBP) Q2 | -15.8B | -16.9B | ||
| 8:30 | GBP | Mortgage Approvals Aug | 67K | 69K | ||
| 8:30 | GBP | M4 Money Supply M/M Aug | 0.20% | 0.50% | ||
| 8:30 | GBP | GDP Q/Q Q2 F | 0.30% | 0.30% | ||
| 8:30 | GBP | GDP Y/Y Q2 F | 1.70% | 1.70% | ||
| 8:30 | GBP | Index of Services 3M/3M Jul | 0.70% | 0.50% | ||
| 9:00 | EUR | Eurozone CPI Estimate Y/Y Sep | 1.60% | 1.50% | ||
| 9:00 | EUR | Eurozone CPI - Core Y/Y Sep A | 1.20% | 1.20% | ||
| 12:30 | CAD | GDP M/M Jul | 0.10% | 0.30% | ||
| 12:30 | CAD | Industrial Product Price M/M Aug | -1.50% | |||
| 12:30 | CAD | Raw Materials Price Index M/M Aug | -0.60% | |||
| 12:30 | USD | Personal Income Aug | 0.20% | 0.40% | ||
| 12:30 | USD | Personal Spending Aug | 0.10% | 0.30% | ||
| 12:30 | USD | PCE Deflator M/M Aug | 0.30% | 0.10% | ||
| 12:30 | USD | PCE Deflator Y/Y Aug | 1.50% | 1.40% | ||
| 12:30 | USD | PCE Core M/M Aug | 0.20% | 0.10% | ||
| 12:30 | USD | PCE Core Y/Y Aug | 1.40% | 1.40% | ||
| 13:45 | USD | Chicago PMI Sep | 58.7 | 58.9 | ||
| 14:00 | USD | U. of Michigan Confidence Sep F | 95.3 | 95.3 |
AUD/USD Daily Outlook
Daily Pivots: (S1) 0.7817; (P) 0.7839; (R1) 0.7878; More...
AUD/USD dipped to as low as 0.7798 but quickly drew support from 0.7807 key support level and recovered. Intraday bias is turned neutral first. Considering bearish divergence condition in daily MACD, firm break of 0.7807 will indicate near term reversal. Outlook will then be turned bearish for 55 week EMA (now at 0.7670) first. Meanwhile, rebound from 0.7807 will retain bullishness. Above 0.7938 minor resistance will turn bias back to the upside for retesting 0.8124 high.
In the bigger picture, rise from 0.6826 medium term bottom is still in progress. At this point, there is no confirmation of trend reversal yet and we'll continue to treat such rebound as a corrective pattern. But in any case, break of 55 month EMA (now at 0.8090) will target 38.2% retracement of 1.1079 to 0.6826 at 0.8451. Break of 0.7807 support is needed to to be the first sign of completion of the rebound. Otherwise, further rise is now in favor.
Market Morning Briefing: The Dollar Index Failed To Rise To 94.00 Yesterday
STOCKS
Dow (22381.20, +0.18%) has been stable above 22200 since the last 3-sessions and while that holds, some chances of a rise towards 22400 or higher cannot be negated. A break below 22200 could take it lower to 22000; else a rise above 22400 could take it towards 22600 in the near term. Equal chances of either direction is possible just now with slight preference for an upmove.
Dax (12704.65, +0.37%) has broken above 12675 contrary to our expectation of a rejection from these levels. While above 12675-12700 levels, the index could move up towards previous highs of 12900-12951 seen in June’17. Also note a decent resistance near 12800 which if holds could prevent a further rise towards 12900 and push the index back towards 12700-12600 in the near term.
Nikkei (20294.11, -0.34%) is trapped within 20500-20200 levels and is unable to decide which way to go just now. If Dollar Yen remains below 113.30 and moves lower towards 112, Nikkei could come down too; else some more sideways consolidation is possible until there is more clarity on near term direction. We may also look at the US-Japan 10YR differential for directional indication as the differential is testing resistance near current levels. If the resistance holds and the differential comes down, it could pull off both Nikkei and Dollar Yen to lower levels.
Shanghai (3349.33, +0.29%) could remain within 3360-3325 region in the coming sessions. No major movement expected just now.
Nifty (9768.95, +0.34%) bounced back yesterday from 9687, in line with our expectation of a pause near 9680/85 mentioned in the earlier edition. Nifty is expected to remain in the recovery mode today also and could move up towards 9850. Levels near 9680 is not expected to break just now.
COMMODITIES
Gold (1284.20) is stable above the immediate support at 1280. While that holds, there could be some sideways consolidation and an attempt to move back towards 1300. But a break below 1280, if seen would be an important indication of bearishness for the coming weeks.
Silver (16.8150) is likely to remain below 17. There is some possibility of testing 16.50 in the coming sessions.
Brent (57.65) is trading above immediate support near 56.65 and is likely to trade sideways for a few sessions. WTI (51.56) on the other hand looks bearish and could fall towards 50.50 in the near term.
Copper (2.9715) rose sharply yesterday but may not sustain above 3 in the near term. Some range-bound movement within 3.0-2.9 region is expected in the coming sessions.
FOREX
The Dollar Index (93.23) failed to rise to 94.00 yesterday, dipping from a high of 93.67. Today might be quiet between 93.00-93.50. Similarly, the Euro (1.1780), which saw a high near 1.1804 yesterday, may range between 1.1740-1820 today. For a few days the market will debate whether it wants to push the Euro lower to 1.1665 or not.
Dollar-Yen (112.67) came off well from an intra-day high of 113.21 yesterday, which might establish 113.50 as a decent Range Resistance. An intra-day fall and Close below 112.40-30 will encourage this possibility.
The Euro-Yen (132.70) has consolidated yesterday as expected. We continue to look for a fall towards 131 next week.
As expected, the Pound (1.3410) ran into some selling when it rallied to 1.3455 yesterday. Today is likely to be quiet between 1.3440-3365. In the bigger picture, the upmove since 1.1985 (Jan '17) may have ended.
The Aussie (0.7841) saw a low of 0.7800 yesterday, but did not carry on further down to our target of 0.7750. Like the other currencies, today might be quiet between 0.7875-15.
Dollar-Yuan (6.6760) has continued to rise but may find some Resistance/ run into profit-taking near 6.70. Dollar-Rupee (65.5050) came of well yesterday and may be ranged between 65.30-70 today, with accent on the downside.
INTEREST RATES
US Yields stabilised a bit yesterday, but may have potential to climb higher, especially at the farther end of the Curve. The 10Yr (2.32%) may rise towards 2.50%, while the 30Yr (2.87%) may rise towards 3.00%, as mentioned yesterday.
Further Curve steepening likely in US yields, also mentioned yesterday.
Good Resistance near current levels on the US-Japan 10Yr Yield Spread (2.24%), which is likely to hold and help push Dollar-Yen (112.67) lower. At the same time, the Japanese 10Yr (0.067%) itself seems to have Resistance near current level and near 0.10%. So, this is a bit of a conundrum, which has to be watched over the next couple of days.
Daily Technical Analysis: EURUSD, GBPUSD, USDJPY, USDCHF
EURUSD
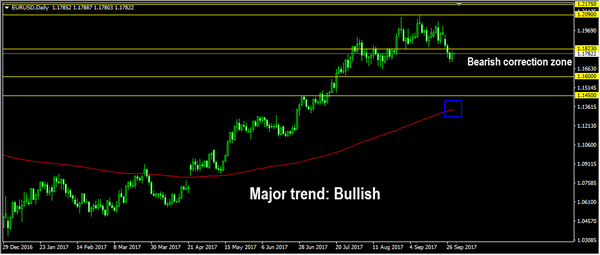
The EURUSD had a moderate bullish momentum yesterday topped at 1.1804. The bias is neutral in nearest term but overall price is still in a bearish correction phase. Immediate support is seen around 1.1720. A clear break below that area could trigger further bearish pressure testing 1.1650/00 region. Immediate resistance is seen around 1.1823/50 area. A clear break above that area could trigger further bullish pressure testing 1.1935 area which need to be clearly broken to the upside to potentially end the current bearish correction phase and continue the major bullish scenario.
GBPUSD
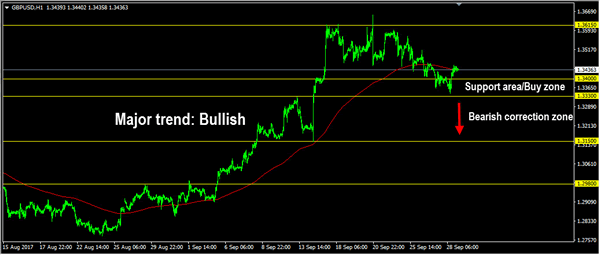
The GBPUSD had a moderate bullish momentum yesterday topped at 1.3455. The bias is neutral in nearest term probably with a little bullish bias testing 1.3500 – 1.3550 region. On the downside, 1.3400 – 1.3330 area remains a key support and good place to buy with a tight stop loss below 1.3330 as a clear break below that area would take price to a bearish correction zone testing 1.3150 support area. On the upside, a clear break above 1.3550 would expose 1.3615 key resistance which need to be clearly broken to the upside to continue the major bullish scenario.
USDJPY
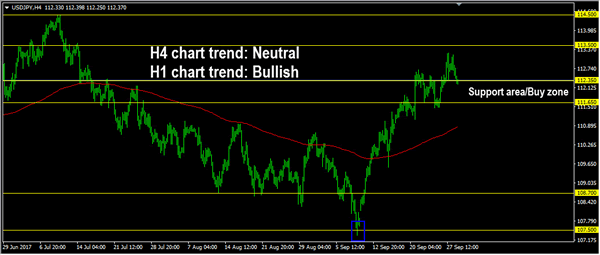
The USDJPY was corrected lower yesterday bottomed at 112.25. The bias is bearish in nearest term but 112.35 – 111.65 region remains a key support and good place to buy with a tight stop loss below 111.65. Immediate resistance is seen around 112.75. A clear break above that area could lead price to neutral zone in nearest term testing 113.50 region. On the downside, a clear break below 111.65 would change my H1 chart bias to a neutral condition. Overall I remain neutral.
USDCHF
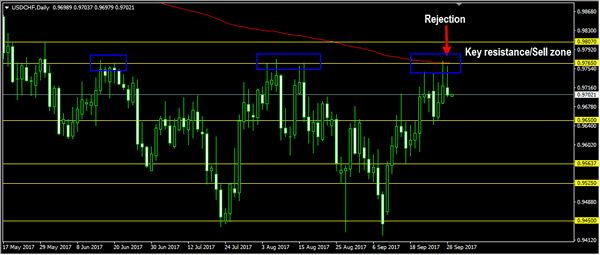
The USDCHF attempted to push higher yesterday topped at 0.9758 but closed lower at 0.9700 after another rejection to break above the daily EMA 200 and 0.9765 key resistance area, printed a bearish pin bar formation on daily chart. The bias is neutral in nearest term probably with a little bearish bias testing 0.9650 support area. On the upside, 0.9765 – 0.9807 remains a key resistance and good place to sell. Overall I remain neutral.
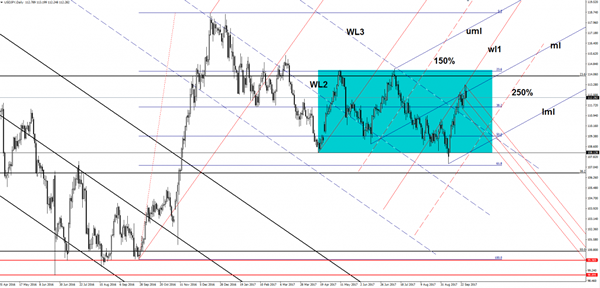
USD/JPY Another Leg Lower
USD/JPY has found strong resistance and now seems poised to drop in the upcoming days. Has retested the warning line (wl1) and turned to the downside as the USD was punished by the USDX’s drop. Technically, it should drop further after the failure to close on the warning line (wl1) and after the false breakout above the median line (ml) of the minor blue ascending pitchfork.
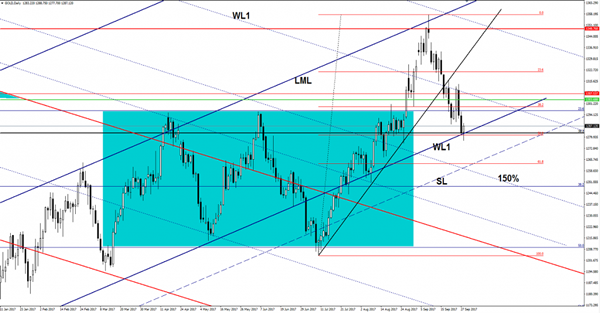
Gold False Breakdown?
Price has dropped much below the confluence area formed between the warning line (WL1) and the long term 38.2% Fibonacci line, but failed to stay there and now is trading much above this support. Technically, the false breakdown will send the price very fast towards new highs. We'll see what will happen tomorrow because the fundamental factors will take the lead.