Sample Category Title
USD/JPY Gaps Down as North Korea Successfully Tests Hydrogen Bomb on Weekend
Good morning traders,
Another weekend goes by and another test by North Korea. This one however is a little more concerning… More from Bloomberg here:
"The yen and the Swiss franc posted the biggest gains among major currencies in early Asian trading after North Korea said it successfully tested a hydrogen bomb with "unprecedentedly big power"."
The words North Korea, Hydrogen Bomb and Success isn't something that you want to hear strung together when you're enjoying a lazy weekend, but we can't always get what we want and markets reacted accordingly on the open:
USD/JPY 5 Minute:
As you can see on the intraday chart, USD/JPY gapped down hard on the open, but immediately found support at Friday's NFP inspired swing low.
Remember when nothing would overshadow an NFP Friday?
Crazy times!
The gap fill level is marked and this level will be our barometer as to how seriously markets take this further escalation when it comes to North Korea and the threat of war.
Just keep your daily charts open for some perspective:
USD/JPY Daily:
Even with that 75 pip gap down, USD/JPY is still trading away from swing low support and actually in a range-bound upswing.
Just don't lose sight of the bigger technical picture in the emotion of headlines.
Best of probabilities to you!
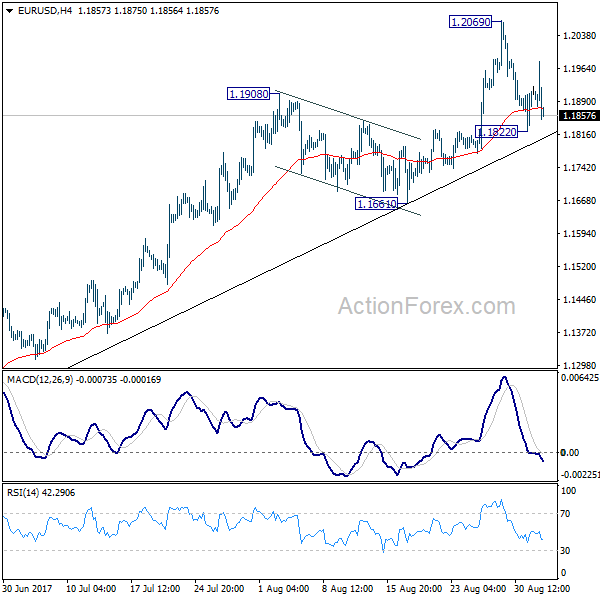
EUR/USD Weekly Outlook
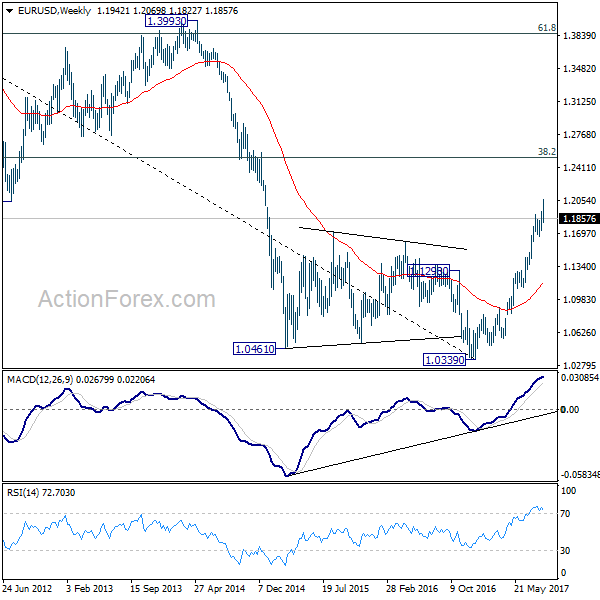
EUR/USD jumped to 1.2069 last week but retreated sharply since then. The rebound from 1.1822 was short lived as the pair turned southward again. Initial bias is neutral this week first as consolidation from 1.2069 could extend. Below 1.1822 will bring deeper fall. But after all, there is no clear sign of trend reversal yet. Outlook will remain bullish as long as 1.1661 holds. Break of 1.2069 will extend larger rise from 1.0339 to next key fibonacci level at 1.2516. Nonetheless, break of 1.1661 will bring much lengthier consolidation first.
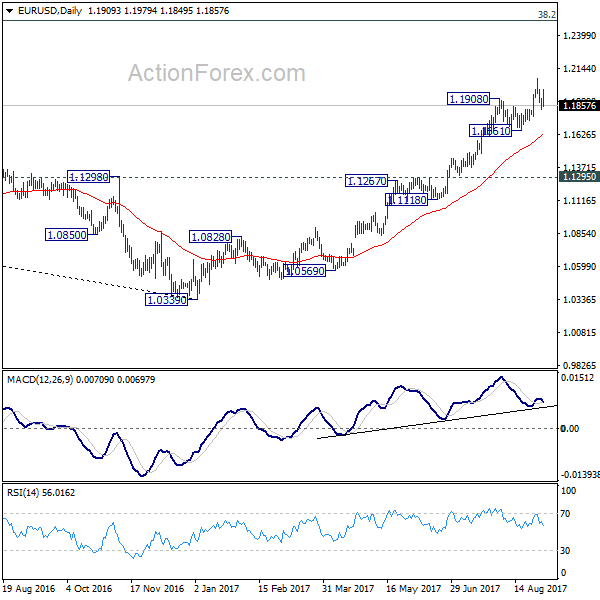
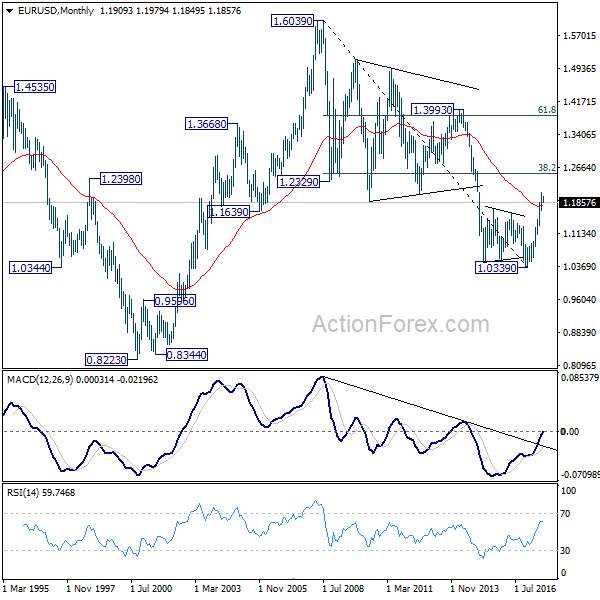
In the bigger picture, an important bottom was formed at 1.0339 on bullish convergence condition in weekly MACD. Sustained trading above 55 month EMA (now at 1.1774) will pave the way to key fibonacci level at 38.2% retracement of 1.6039 (2008 high) to 1.0339 (2017 low) at 1.2516. While rise from 1.0339 is strong, there is no confirmation that it's developing into a long term up trend yet. Hence, we'll be cautious on strong resistance from 1.2516 to limit upside. For now, medium term outlook will remain bullish as long as 1.1295 support holds, in case of pull back.
In the long term picture, 1.0339 is now seen as an important bottom as the down trend from 1.6039 (2008 high) could have completed. It's still early to decide whether price action form 1.0339 is developing into a corrective or impulsive move. But in either case, further rally would be seen to 38.2% retracement of 1.6039 to 1.0339 at 1.2516
USD/JPY Weekly Outlook
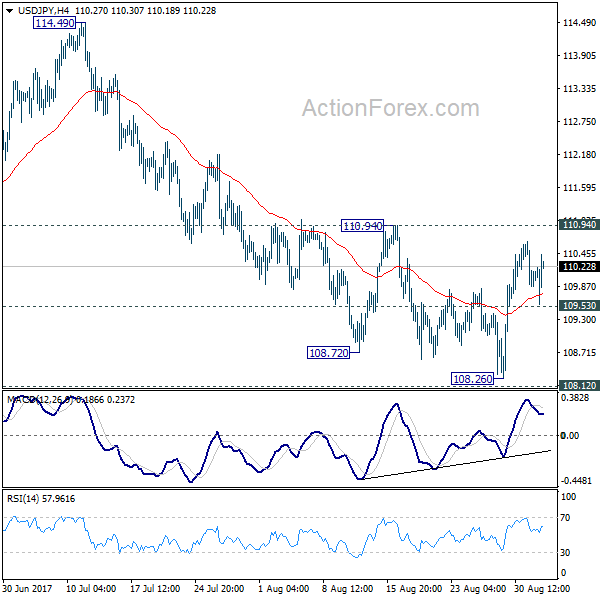
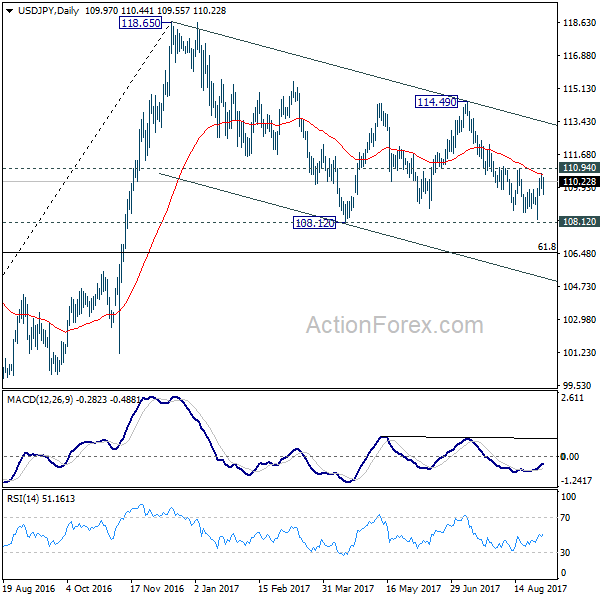
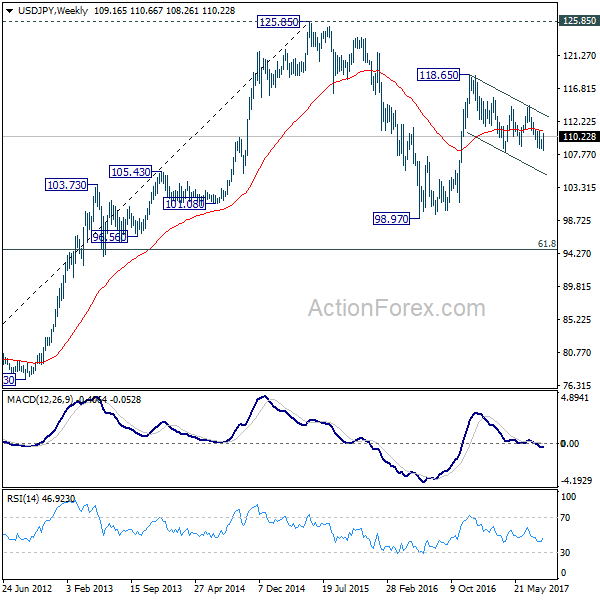
USD/JPY dropped to 108.26 last week but recovered ahead of 108.12 support. As the pair is staying below 110.94 resistance, near term outlook remains bearish. Initial bias stays neutral this week first. On the downside, below 109.53 minor support will turn bias to the downside for 108.12 support first. Firm break of 108.12 support will resume the whole corrective decline from 118.65. In that case, USD/JPY will target 61.8% retracement of 98.97 to 118.65 at 106.48. Nonetheless, considering bullish convergence condition in 4 hour MACD, break of 110.94 will indicate near term reversal and bring stronger rebound back towards 114.49 resistance.
In the bigger picture, the corrective structure of the fall from 118.65 suggests that rise from 98.97 is not completed yet. Break of 118.65 will target a test on 125.85 high. At this point, it's uncertain whether rise from 98.97 is resuming the long term up trend from 75.56, or it's a leg in the consolidation from 125.85. Hence, we'll be cautious on topping as it approaches 125.85. If fall from 118.65 extends lower, downside should be contained by 61.8% retracement of 98.97 to 118.65 at 106.48 and bring rebound.
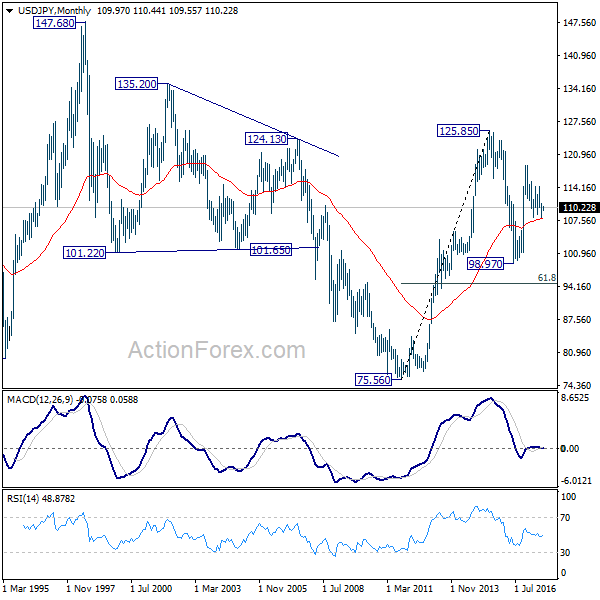
In the long term picture, the rise from 75.56 long term bottom to 125.85 top is viewed as an impulsive move. Price actions from 125.85 are seen as a corrective move which could still extend. But, up trend from 75.56 is expected to resume at a later stage for above 135.20/147.68 resistance zone.
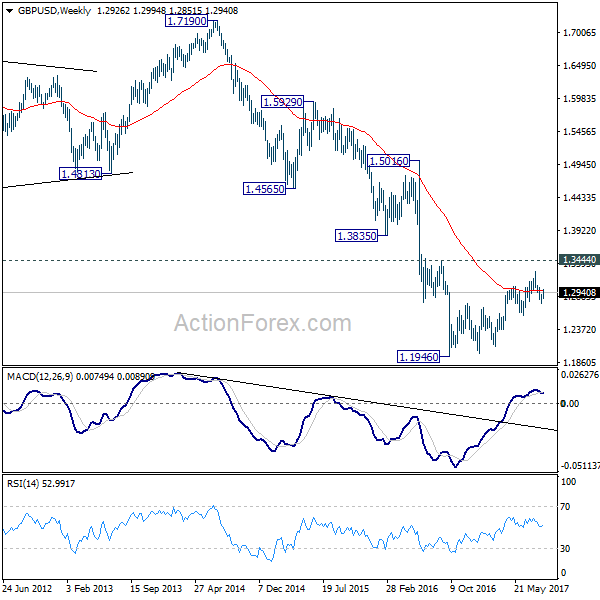
GBP/USD Weekly Outlook
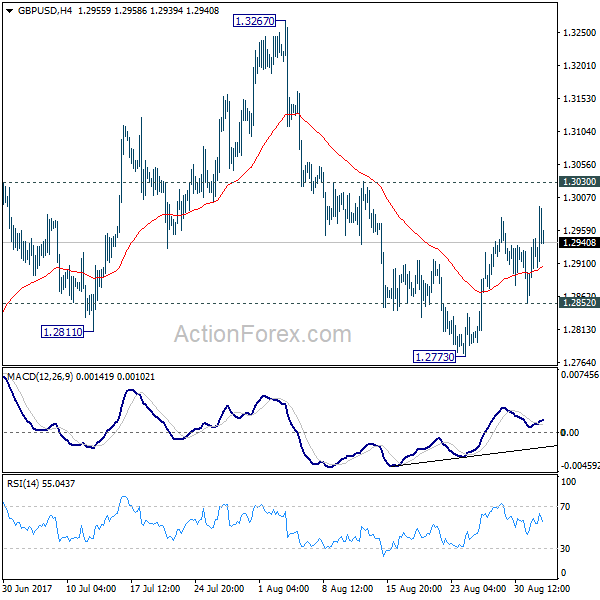
GBP/USD's corrective rise from 1.2773 extended higher last week but stayed below 1.3030 resistance. Outlook remains unchanged and initial bias remains neutral first. We're favoring the case that correction from 1.1946 is completed at 1.3267. Below 1.2852 minor support will turn intraday bias back to the downside for 1.2588 key near term support first. Decisive break of 1.2588 will confirm our view and target a test on 1.1946 low. Though, break of 1.3030 will dampen this bearish view and turn bias back to the upside for retesting 1.3267.
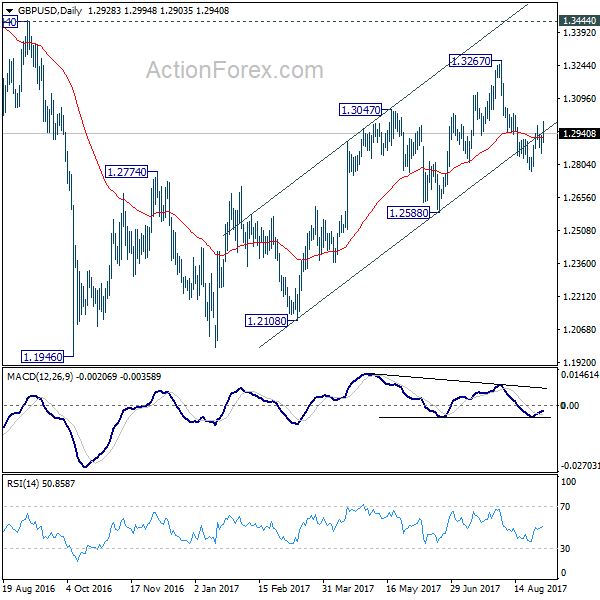
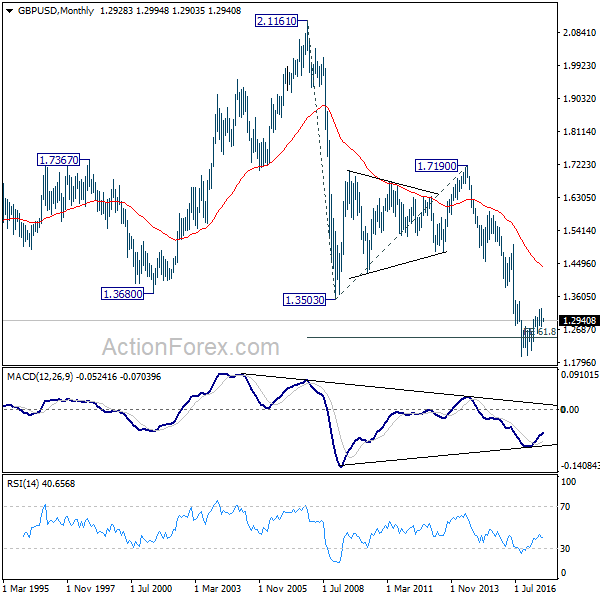
In the bigger picture, overall, price actions from 1.1946 medium term low are seen as a corrective pattern. While further rise cannot be ruled out, larger outlook remains bearish as long as 1.3444 key resistance holds. Down trend from 1.7190 (2014 high) is expected to resume later after the correction completes. And break of 1.2588 will indicate that such down trend is resuming.
In the longer term picture, no change in the view that down trend from 2.1161 (2007 high) is still in progress. On resumption, such decline would extend deeper to 100% projection of 2.1161 to 1.3503 from 1.7190 at 0.9532. However, firm break of 1.3444 should confirm reversal and turn outlook bullish.
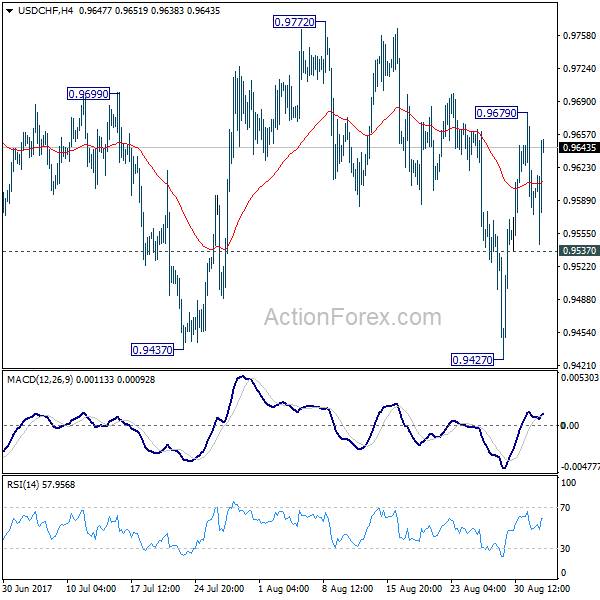
USD/CHF Weekly Outlook
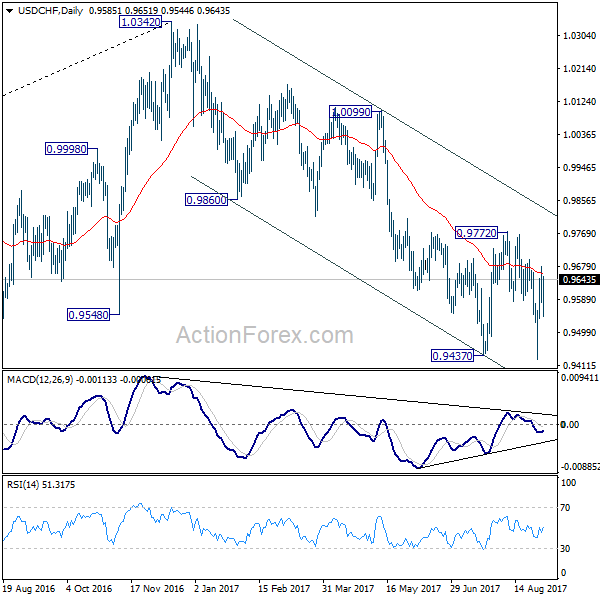
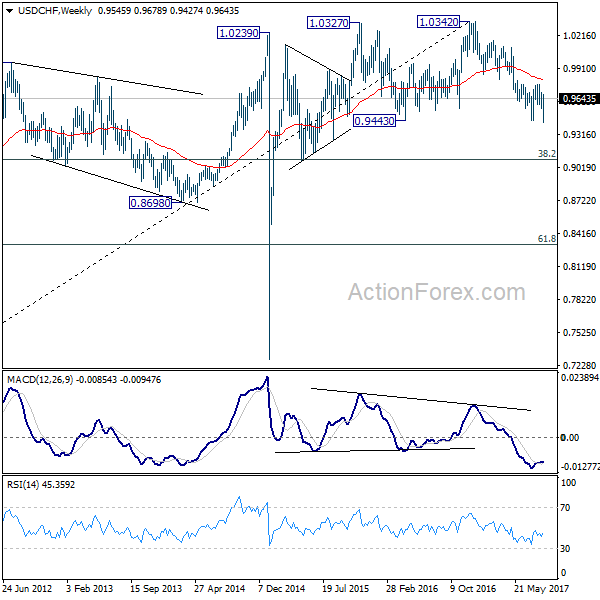
USD/CHF dived lower to 0.9427 last week but failed to sustain below 0.9443 key support and rebound. Initial bias stays neutral this week first. Considering it's close to to 0.9443 key support, consolidation from 0.9427 might extend further. But still, break of 0.9772 resistance is needed to confirm near term reversal. Otherwise, outlook stays bearish for another decline. Below 0.9537 minor support will turn bias back to the downside for retesting 0.9427 first. Break of 0.9427 will resume whole decline from 1.3042.
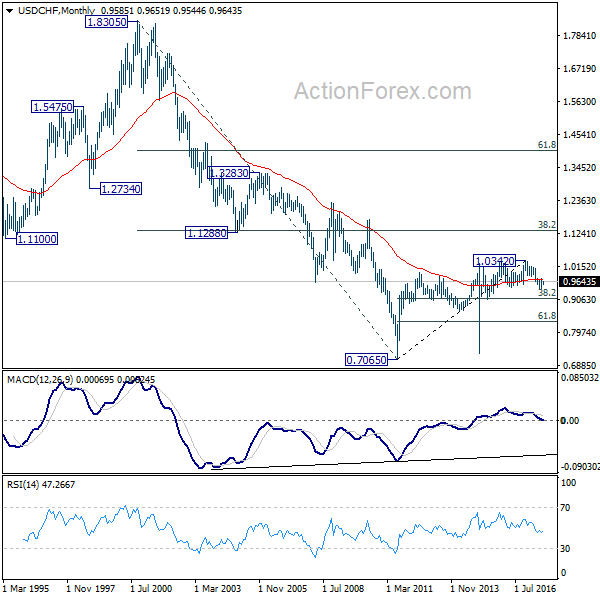
In the bigger picture, current development suggests that 0.9443 key support (2016 low) could be taken out firmly as down trend form 1.0342 extends. There are various interpretation of the price actions. But in any case, medium term outlook will stay bearish as long as 0.9772 resistance holds. Current down trend could extend to 38.2% retracement of 0.7065 (2011 low) to 1.0342 (2016 high) at 0.9090. However, break of 0.9772 will indicate that USD/CHF has successfully defended 0.9443 again and turn outlook bullish for 1.0099 resistance.
AUD/USD Weekly Outlook
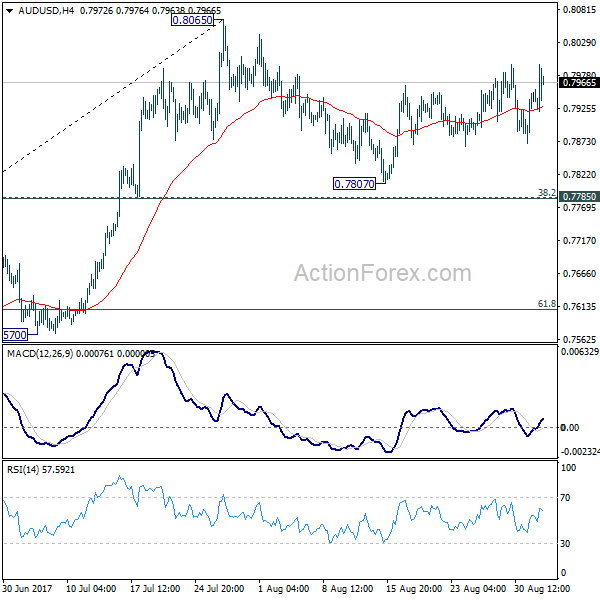
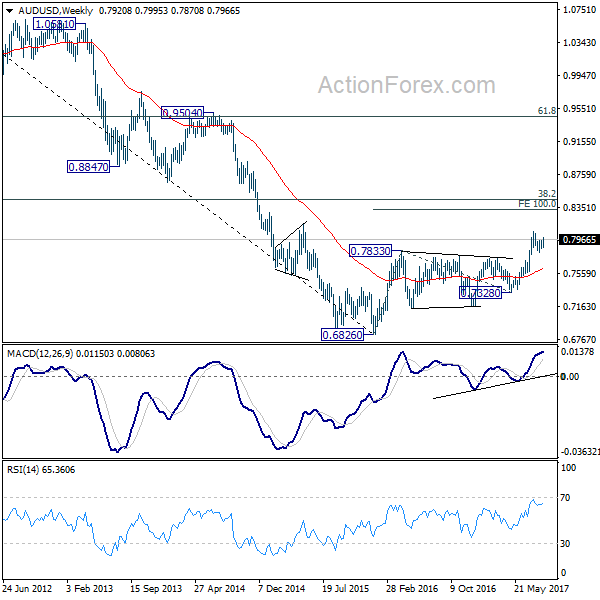
AUD/USD stayed in consolidation below 0.8065 last week and outlook is unchanged. Initial bias remains neutral this week first. In case of another fall, downside should be contained by 0.7785 cluster support (38.2% retracement of 0.7328 to 0.8065 at 0.7783) to bring rebound. On the upside, break of 0.8065 will resume the medium term rise and target 100% projection of 0.6826 to 0.7833 from 0.7328 at 0.8335.
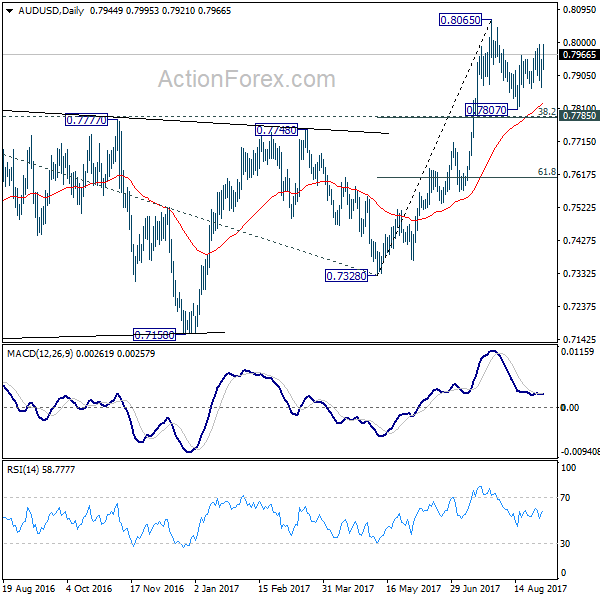
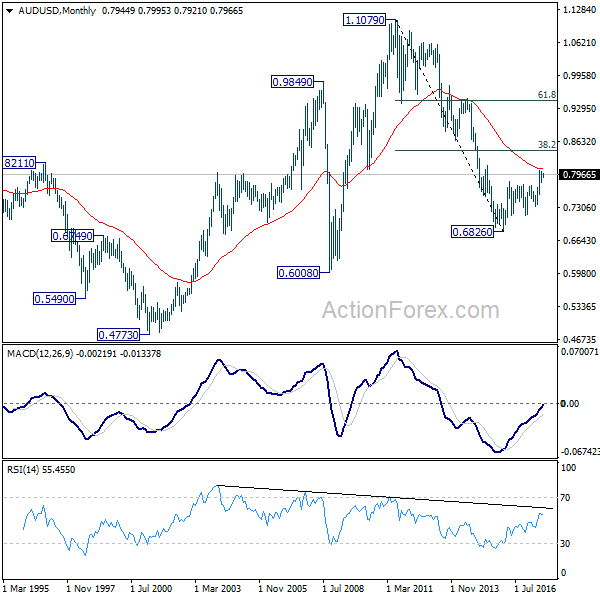
In the bigger picture, rise from 0.6826 medium term bottom is still in progress. At this point, there is no confirmation of trend reversal yet and we'll continue to treat such rebound as a corrective pattern. But in any case, break of 55 month EMA (now at 0.8087) will target 38.2% retracement of 1.1079 to 0.6826 at 0.8451. Break of 0.7328 support is needed to confirm completion of the rebound. Otherwise, further rise is now in favor.
In the longer term picture, 0.6826 is seen as a long term bottom. Rise from there could either reverse the down trend from 1.1079, or just develop into a corrective pattern. At this point, we're favoring the latter. And, as long as 38.2% retracement of 1.1079 to 0.6826 at 0.8451 holds, we'd anticipate another decline through 0.6826 at a later stage.
USD/CAD Weekly Outlook
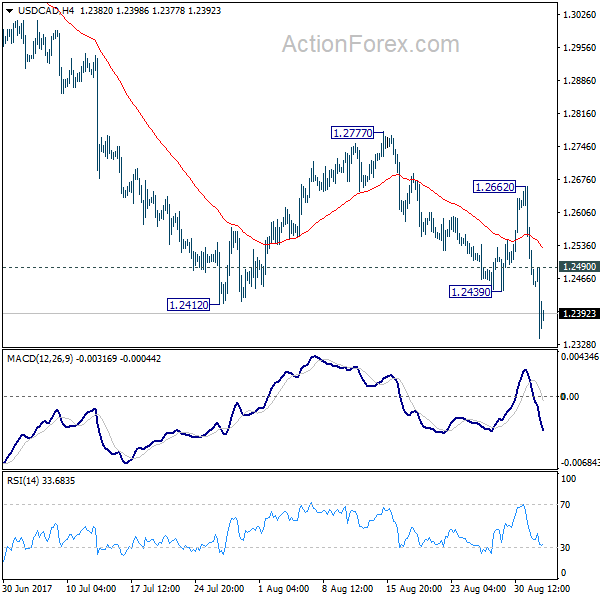
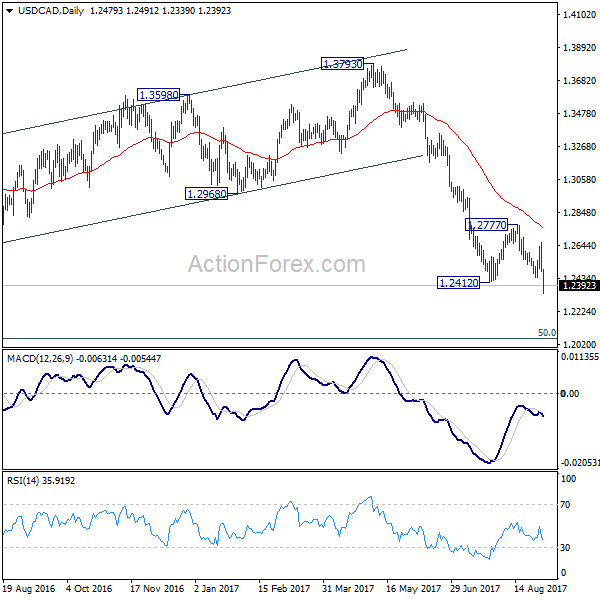
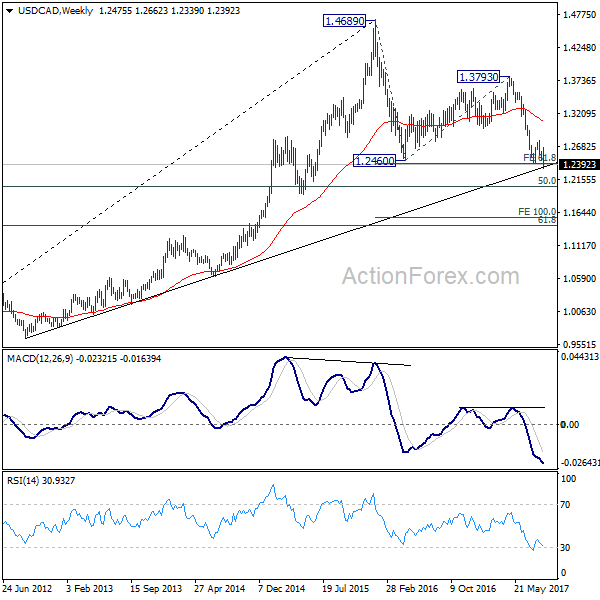
USD/CAD's decline from 1.3793 resumed last week by taking out 1.2412 low. Initial bias stays on the downside this week for next long term fibonacci level at 1.2048. On the upside, above 1.2490 minor resistance will turn intraday bias neutral again. But outlook will remain bearish as long as 1.2662 resistance holds.
In the bigger picture, price actions from 1.4689 medium term top are seen as a correction pattern. Such corrective fall is expected to extend to 50% retracement of 0.9406 to 1.4869 at 1.2048. At this point, we'd look for strong support from there to contain downside and bring rebound. Break of 1.2777 resistance will indicate reversal and turn outlook bullish for 1.3793 key resistance. However, sustained break of 1.2048 will carry larger bearish implications and bring deeper decline.
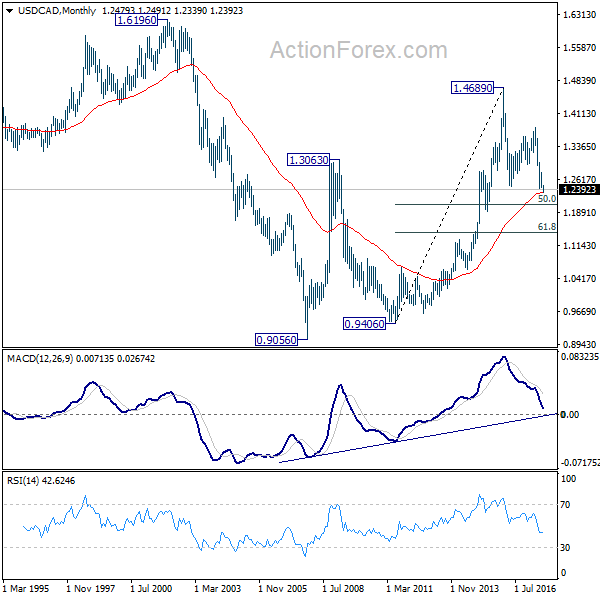
In the longer term picture, rise from 0.9056 (2007 low) is viewed as a long term up trend. It turned into correction after hitting 1.4689. But such rise is expected to resume later to test 1.6196 down the road. But firm break of 50% retracement of 0.9406 to 1.4869 at 1.2048 will raise doubt over this view. In that case, the long term trend could have reversed.
GBP/JPY Weekly Outlook
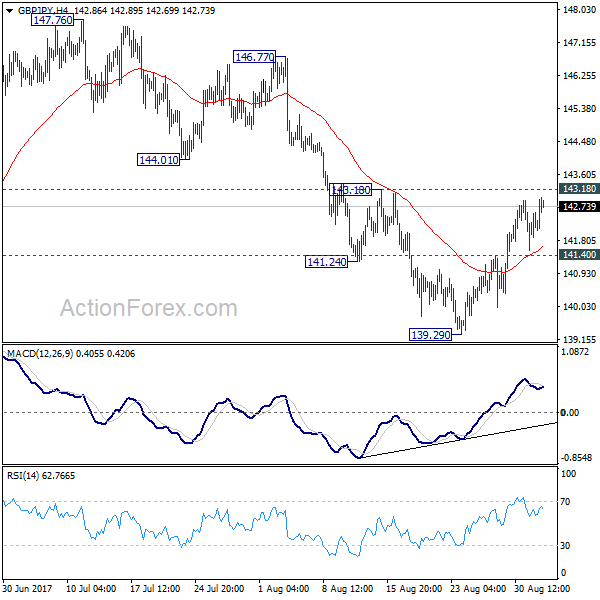
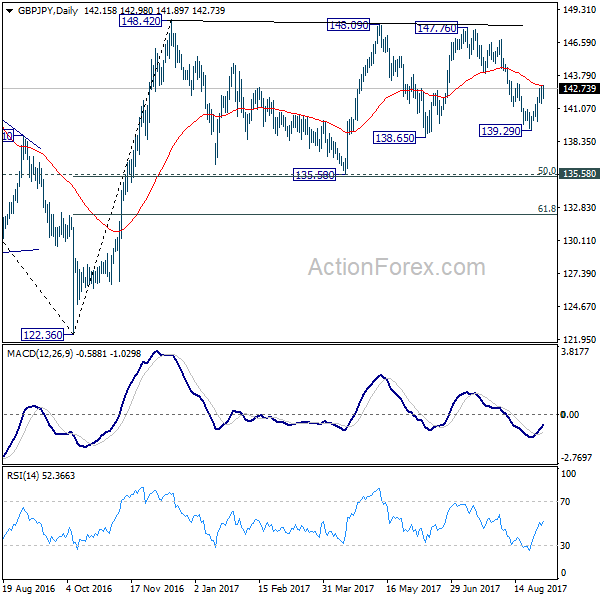
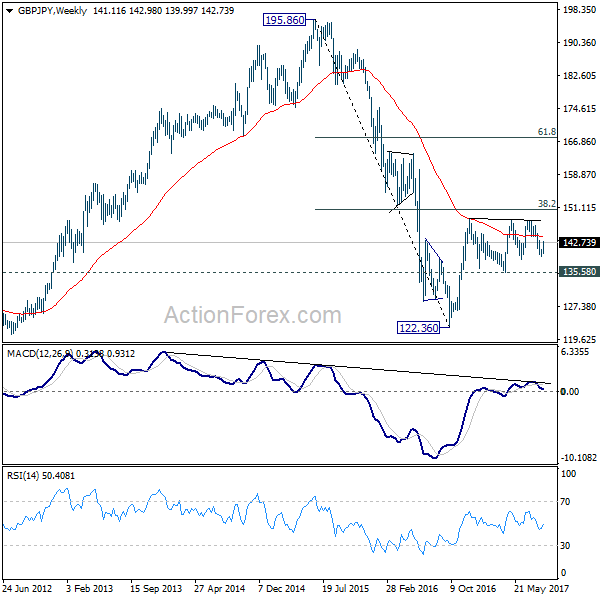
GBP/JPY's rebound from 139.29 extended last week but stayed below 143.18 resistance. Initial bias remains neutral this week will bearish outlook. Below 141.40 minor support will turn bias back to the downside first. Break of 139.29 will target 135.58 key support level. At this point, price actions from 148.42 are seen as a sideway consolidation pattern. Hence, we'll expect strong support from 135.58 to contain downside and bring rebound. Meanwhile, break of 143.18 will indicate short term reversal and turn bias back to the upside.
In the bigger picture, the sideway pattern from 148.42 is still unfolding. In case of deeper fall, we'd expect strong support from 135.58 and 50% retracement of 122.36 to 148.42 at 135.39 to contain downside. Medium term rise from 122.36 is expected to resume later. And break of 38.2% retracement of 196.85 to 122.36 at 150.43 will carry long term bullish implications. However, firm break of 135.58/39 will dampen the bullish view and turn focus back to 122.36 low.
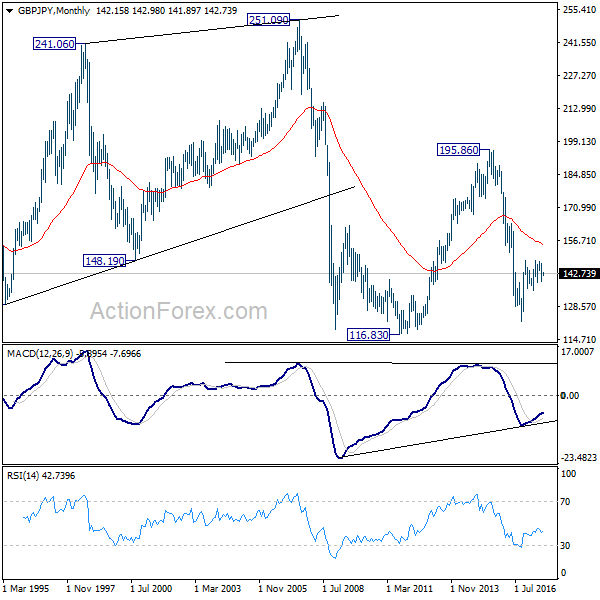
In the longer term picture, it remains to be confirmed if whole down trend from 195.86 has completed at 122.36 already and there is no confirmation yet. But in any case, firm break of 38.2% retracement of 195.86 to 122.36 at 150.43 would pave the way to 61.8% retracement at 167.78. And with that, the 55 month EMA will be firmly taken out which suggests that price actions from 116.83 is indeed a sideway pattern that could last more than a decade.
EUR/JPY Weekly Outlook
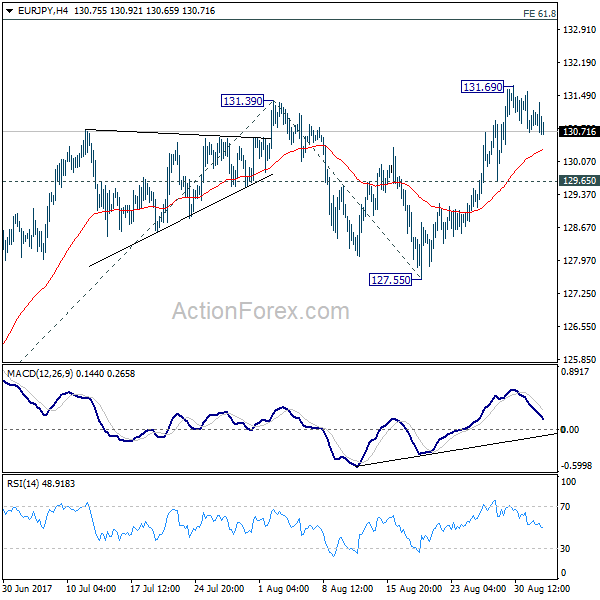
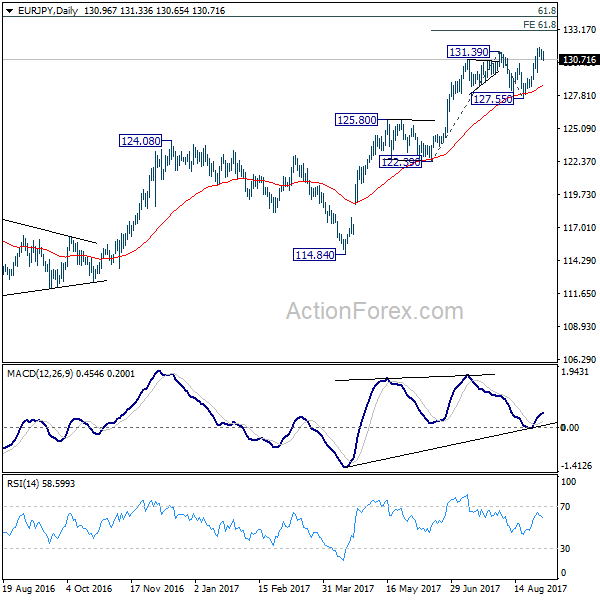
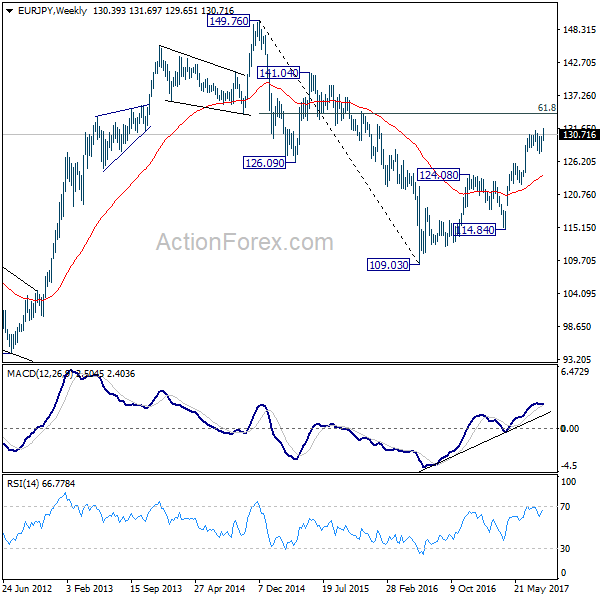
EUR/JPY jumped to 131.69 last week but retreated since then. Initial bias is neutral this week first. Another rise is expected as long as 129.65 minor support holds. Above 131.69 will extend the larger up trend to 61.8% projection of 122.39 to 131.39 from 127.55 at 133.11 next. However, break of 129.65 will dampen the bullish case and turn bias back to the downside for 127.55 support instead.
In the bigger picture, the down trend from 149.76 (2014 high) is completed at 109.03 (2016 low). Current rally from 109.03 should be at the same degree as the fall from 149.76 to 109.03. Further rise is expected to 61.8% retracement of 149.76 to 109.03 at 134.20. Sustained break there will pave the way to key long term resistance zone at 141.04/149.76. Medium term outlook will remain bullish as long as 124.08 resistance turned support holds. However, firm break of 124.08 will argue that rise from 109.03 is completed and turn outlook bearish.
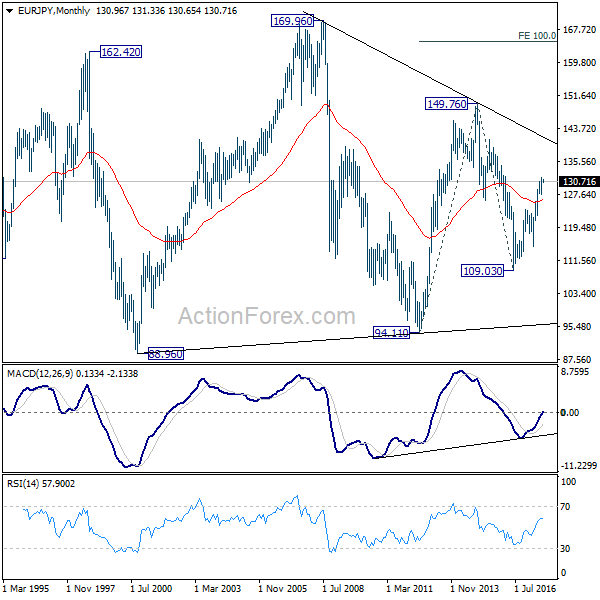
In the long term picture, at this point, there is no clear indication that rise from 109.03 is resuming that from 94.11. Hence, we'd be cautious on topping below 149.76 to extend range trading. Nonetheless, firm break of 149.76 will indicates strong underlying buying. In such case, EUR/JPY will target 100% projection of 94.11 to 149.76 from 109.03 at 164.68.
EUR/GBP Weekly Outlook
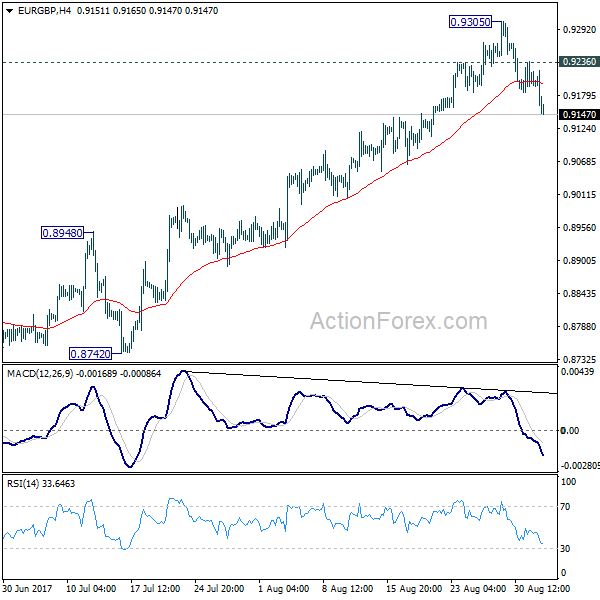
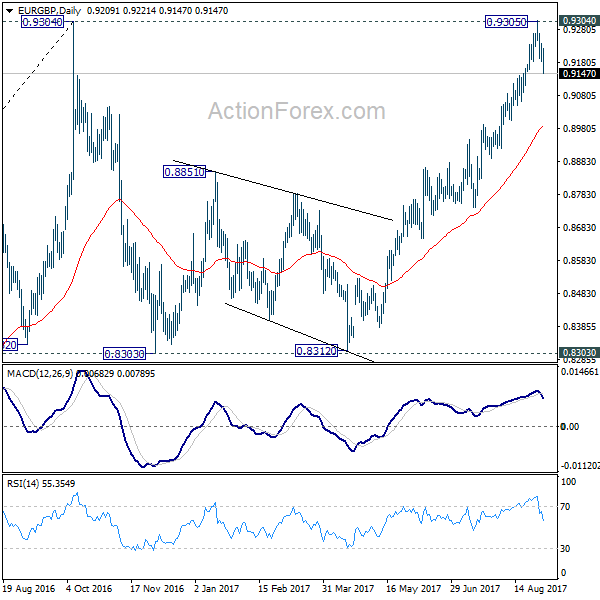
EUR/GBP edged higher to 0.9305 last week but failed to sustain above 0.9304 key resistance. The development argues that a short term top is already formed. Initial bias is back on the downside this week for 55 day EMA (now at 0.8986). Sustained trading below there will likely start the third leg of the consolidation from 0.9304 and target 0.8303 key support again. On the upside, above 0.9236 minor resistance will turn bias back to the upside for 0.9305 instead.
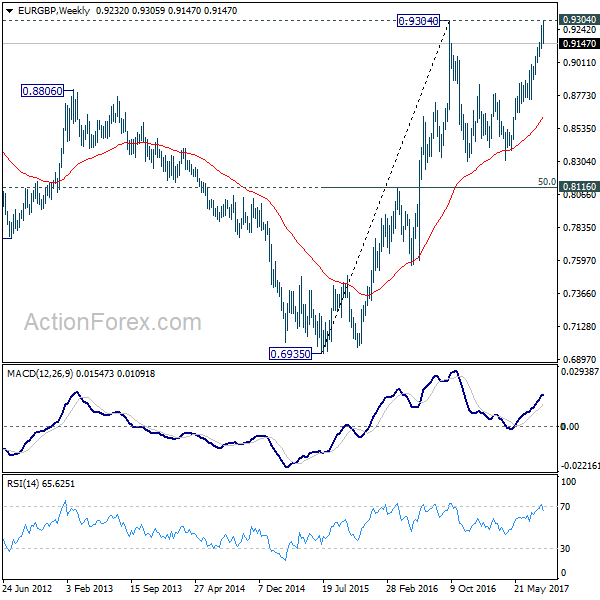
In the bigger picture, price actions from 0.9304 are viewed as a medium term corrective pattern. It's uncertain whether it is finished yet. But in case of another fall, we'd expect strong support from 0.8116 cluster support (50% retracement of 0.6935 to 0.9304 at 0.8120) to contain downside and bring rebound. Whole up trend from 0.6935 is expected to resume after consolidation from 0.9304 completes. Firm break of 0.9799 high will target 61.8% projection of 0.5680 to 0.9799 from 0.6935 at 1.1054.
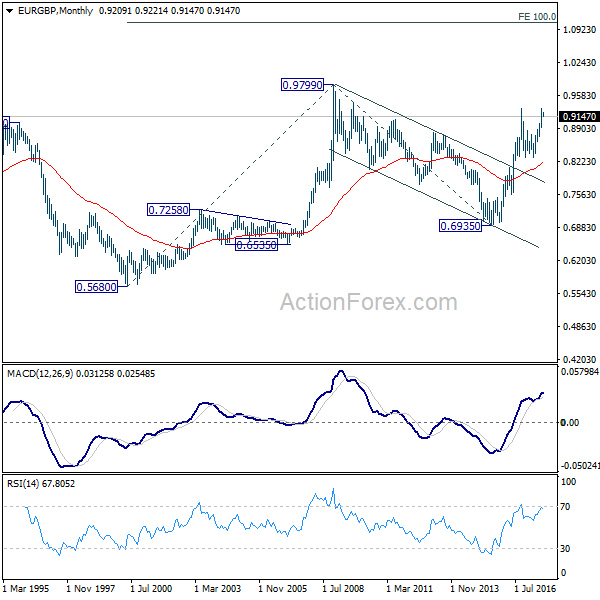
In the long term picture, firstly, price action from 0.9799 (2008 high) is seen as a long term corrective pattern and should have completed at 0.6935 (2015 low). Secondly, rise from 0.6935 is likely resuming up trend from 0.5680 (2000 low). Thirdly, this is supported by the impulsive structure of the rise from 0.6935 to 0.9304. Hence, after the correction from 0.9304 completes, we'd expect another medium term up trend through 0.9799 to 61.8% projection of 0.5680 to 0.9799 from 0.6935 at 1.1054.