Sample Category Title
EUR/AUD Weekly Outlook
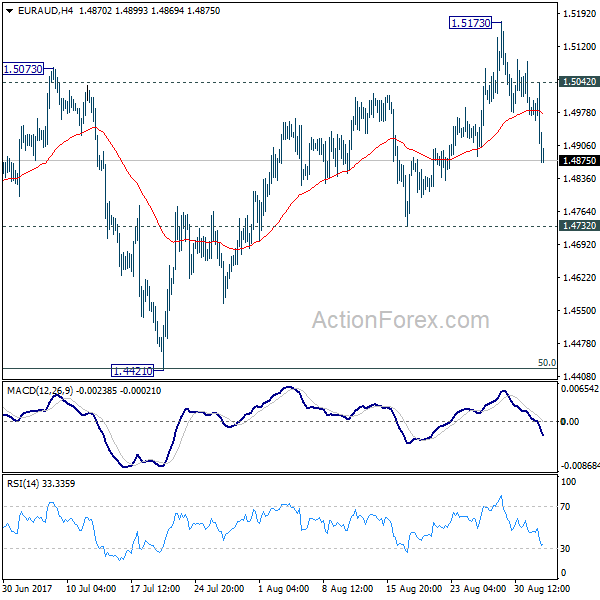
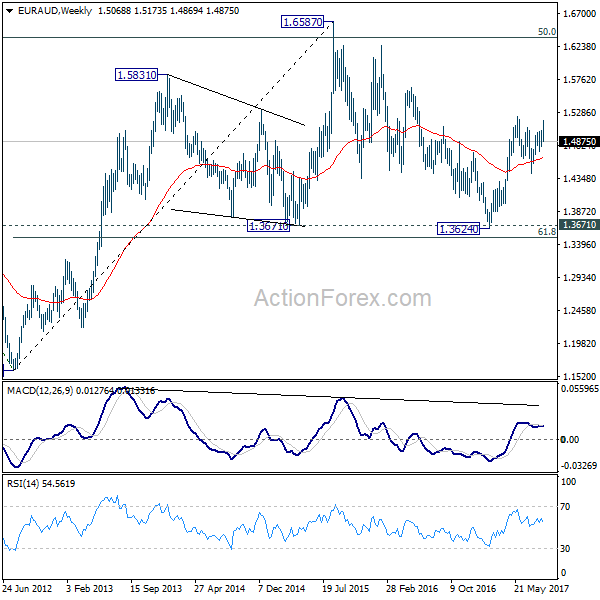
EUR/AUD surged to 1.5173 last week but reversed since then. Current development argues that the cross has failed 1.5226 resistance and rebound from 1.4421 is likely finished. Fall from 1.5173 is viewed as the third leg of the consolidation pattern from 1.5226. Initial bias is mildly on the downside for 1.4372 support first. Break will target 1.4421 again. But we'd expect strong support from there to contain downside and bring rebound. On the upside, above 1.5042 minor resistance will turn bias back to the upside for 1.5173 resistance instead.
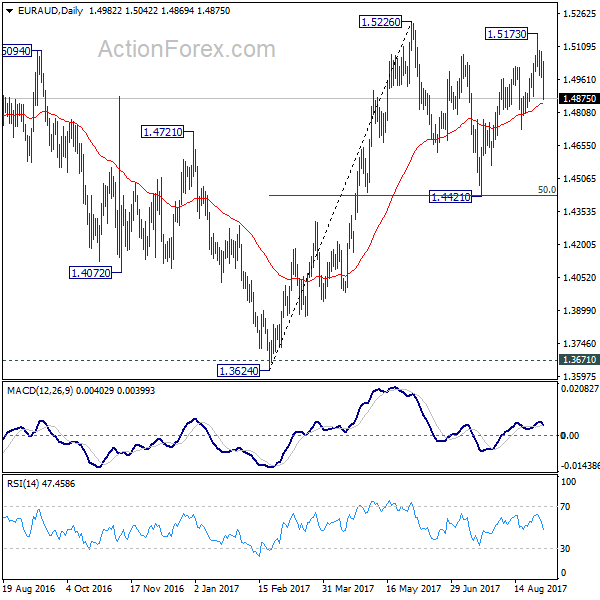
In the bigger picture, we're holding on to the view that corrective decline from 1.6587 medium term has completed at 1.3624. Rise from 1.3624 is expected to extend to retest 1.6587. The corrective structure of the price actions from 1.5226 is affirming this view. Above 1.5226 will target a test on 1.6587 key resistance. However, break of 1.4421 will dampen our view and would drag EUR/AUD lower to retest key support zone around 1.3624.
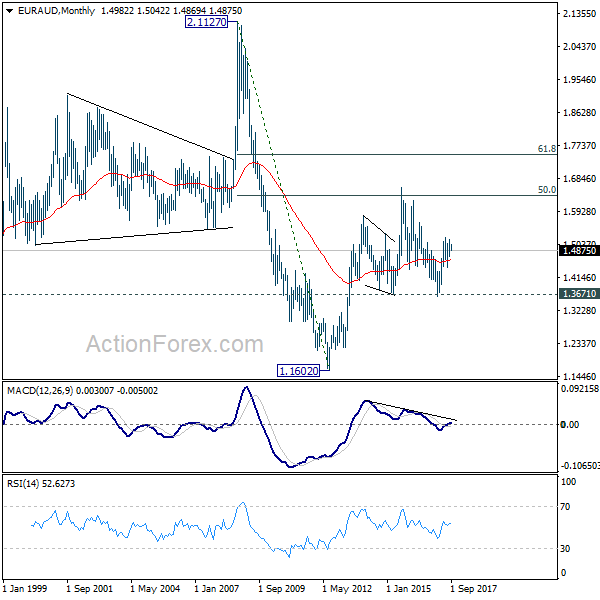
In the longer term picture, the rise from 1.1602 long term bottom isn't over yet. We'll keep monitoring the development but there is prospect of extending the rise to 61.8% retracement of 2.1127 to 1.1602 at 1.7488 and above. However, sustained trading below 1.3671 should confirm trend reversal and target 1.1602 long term bottom again.
EUR/CHF Weekly Outlook
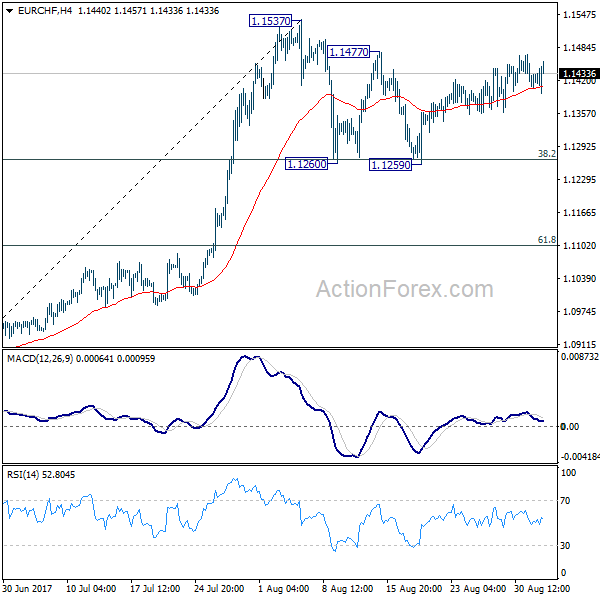
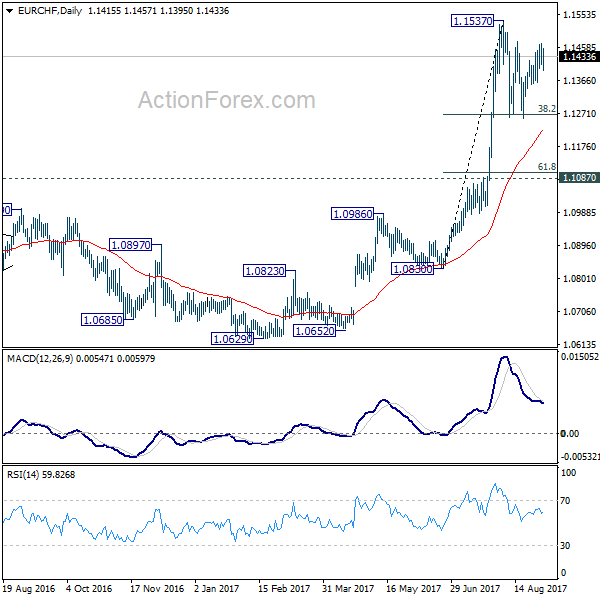
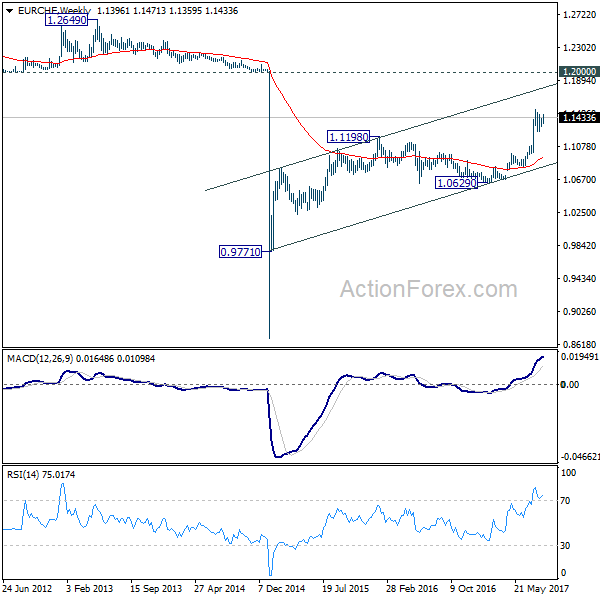
EUR/CHF continued to stay in consolidation from 1.1537 last week and outlook is unchanged. Initial bias remains neutral this week first. On the upside, break of 1.1537 resistance will confirm resumption of larger rally from 1.0629. In that case, EUR/CHF should target 1.2 key resistance level next. On the downside, firm break of 38.2% retracement of 1.0830 to 1.1537 at 1.1267 will extend the correction to 61.8% retracement at 1.1100 before completion.
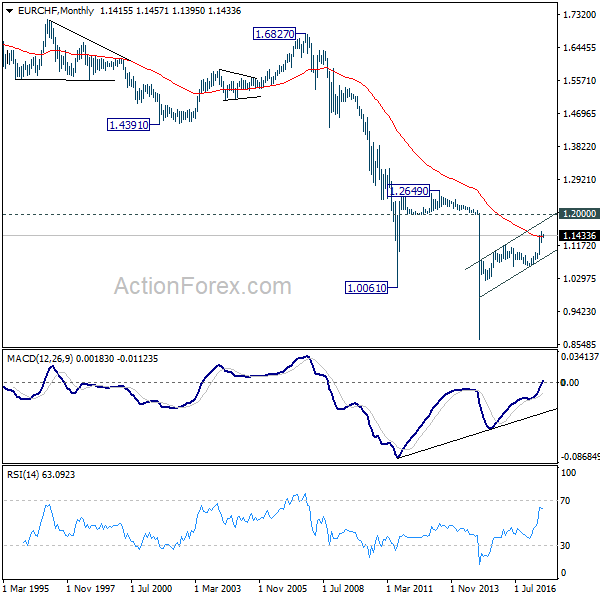
In the bigger picture, long term rise from SNB spike low back in 2015 is still in progress. EUR/CHF should now be heading back to prior SNB imposed floor at 1.2000. For now, this will be the favored case as long as 1.1087 resistance turned support holds.
Dollar Survived Negative Factors to End Mixed; ECB, BoC and RBA Watched
Dollar survived the geopolitical risks in Korea peninsula, damage of hurricane Harvey, and a set of disappointing non-farm payroll data, to end the week "mixed". While the pull back in EUR/USD caught much attention, we'd like the point out that Dollar ended the week lower against Canadian Dollar, Australian Dollar and Sterling. Indeed, the pound ended as the third strongest major currency, next to Canadian Dollar, even though the third round of Brexit negotiations ended with no concrete progress but more verbal exchanges between EU and UK officials. On the other hand, as risk aversion came and went quickly, Yen and Swiss Franc ended as the weakest ones, just next to Kiwi. Traders could take a brief rest on Monday as US and Canada will be on holiday. But three central bank meetings, RBA, BoC and ECB promise much volatility ahead.
Arguments for Dollar reversing
The case for a reversal in Dollar is starting to build up. But it's not quite there yet. There are arguments for bottoming in the greenback. Fundamentally, the reactions to negative news last week showed much resilience in dollar. Also, markets are generally confident that Fed will continue with the announcement of balance sheet normalization this month. While the markets are still uncertain on whether Fed will hike in December, fed fund futures are pricing in more than 40% chance on it, slightly up from a week ago.
Technically, USD/CHF seems to be getting strong support from 0.9443 key level again. USD/JPY also refused to give up 108.12 key support level. And, dollar index staged a quick rebound after breaching 91.91/3 to 91.62. At the same time, 10 year yield is also holding on well to key cluster support zone at 2.103, close to 38.2% retracement of 1.336 to 2.621 at 2.130.
Arguments for Dollar staying bearish
However, there are also arguments to maintain bearish outlook. For example, EUR/USD is holding well above 1.1661 key support level. USD/CHF is kept well below equivalent resistance at 0.9772. USD/JPY is held below 100.94 near term resistance. AUD/USD is extending the rebound from 0.7808, despite weak momentum. And USD/CAD even resumed medium term down trend through 1.2412 low. Dollar index is kept well below 94.14 structure resistance. And the fall from 103.82 is still mildly in favor to continue.
At the same time gold has indeed closed higher on Friday in spite of Dollar's rebound. Gold on track to extend the rally from 1124.3 to test 1377.5 (2016 high). Much more is still needed to confirm a reversal in Dollar.
Euro dives as ECB could wait till December before announcing tapering
At this point, we'd slightly prefer to attribute the rebound in Dollar to the sharp turn in Euro last week. There were firstly report by Reuters that some unnamed ECB officials are concerned with the strength in Euro. And thus, the central bank might opt to "muddle" through September meeting this week. It's originally believed, as we also argue in our report (ECB Policy Stance Not to be Affected by Strong Euro) ECB will announce the tapering plan in October. However, selling in Euro have intensified on Friday after Bloomberg reported that ECB could wait until December 14 meeting before finalizing the tapering plan.
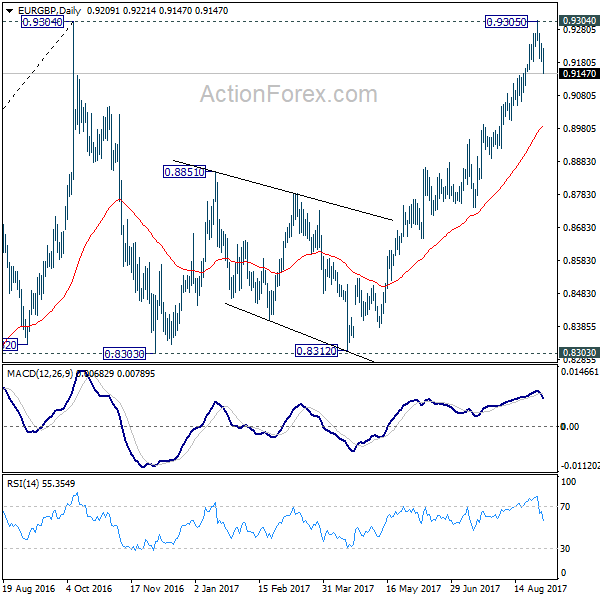
Technically, the most notable turn in Euro's fortune is against Sterling in EUR/GBP. As we also pointed out in our technical report before, we have been cautious on strong resistance from 0.9304 high to bring reversal. The rejection from this level last week argues that a short term top is formed. It's too early to confirm is fall from 0.9305 is starting as the third leg of that consolidation from 0.9304 that could bring another test on 0.8303 support. But at least a dip back to 55 day EMA (now at 0.8992) is likely in near term.
The fate of Euro will very much depends on the outcome of this week's ECB press conference. There will likely be some support to bring Euro back to life if President Mario Draghi starts signing that a change in coming. At the end, ECB might still decide to conclude the tapering plan in December. But Euro bulls would like to hear is the confirmed intention, as well as the non-concern over Euro's strength.
BoC still more likely to stand pat, may signal October move
The strong GDP data from Canada lifted the chance of a rate hike by BoC this week to 50%, according to overnight index swaps market pricing. BoC has been clear in its communications that it's looking through temporary slow down in inflation. And it's normalization interest rates for the 12 months ahead. Solid growth in Canada clears much worry for the central bank for sure. However, considering that BoC has just raised interest rate by 25bps to 0.75% back in July, September seems to be too early for another move. Nevertheless, Canadian Dollar would likely stay firm at the initial part of the week. And buying will jump in again if BoC signals in the statement that it's ready to move again in October.
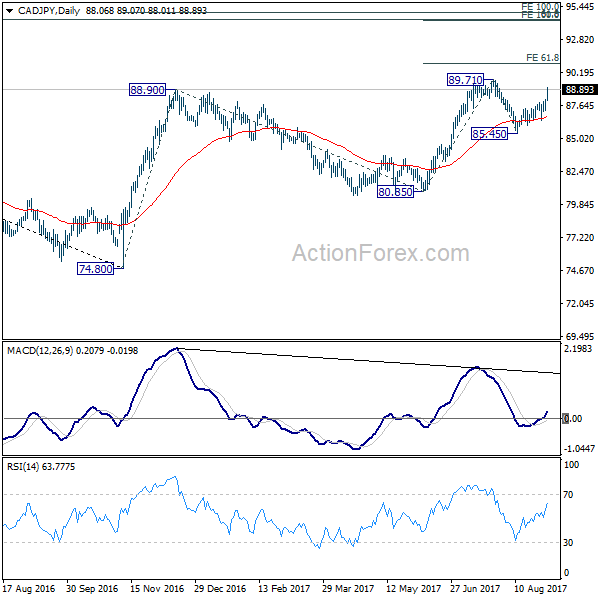
The strong rally in CAD/JPY last week confirmed that pull back from 89.71 has completed at 85.45 after breaching 55 day EMA. Further rise should now be seen through 89.71 to 61.8% projection of 80.85 to 89.71 from 85.45 at 89.92. Break will extend the whole medium term rise fro 74.80 to key cluster zone at 94.31/95 (100% projection of 80.85 to 89.71 from 85.45 at 94.31. 100% projection of 74.80 to 88.90 from 80.85 at 94.95, 61.8% retracement of 106.48 to 74.80 at 94.37.)
RBA to stand pat, but neutral stance enough to outperform Kiwi
There is very little chance for RBA to change monetary policy this week. It's clearly that the central bank is happy with development in the job markets but worried about housing. Governor Philip Lowe has also made it clear that the next move will be up rather than down. In the absence of pick up in wage growth and inflation, there is little reason for the central bank to hike interest rates yet though. And there should be much surprise from this week's statement.
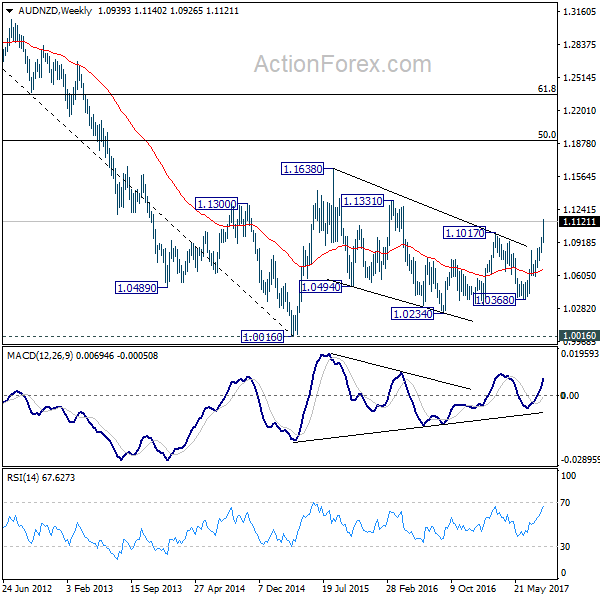
Such neutrality in RBA has already been in sharp contrast to the dovishness of RBNZ. RBNZ governor Graeme Wheeler has repeated his rhetoric to talk down the Kiwi last week. And, the surge in AUD/NZD and break of 1.1017 resistance now suggests completion of the medium term consolidation from 1.1638. And the whole rise from 1.0016 is likely resuming. Further rise should now be seen in near term to 1.1331 resistance. Firm break there will likely pave the way to long term fibonacci level at 50% retracement of 1.3793 (2011 high) to 1.0016 (2015 low) at 1.1905.
Trading strategy: Close EUR/USD long, buy CAD/JPY
Regarding trading strategy, we held on to EUR/USD long (bought at 1.1846) last week. The pair did jump to as high as 1.2069 but retreated sharply since then. Despite a string of Dollar negative news, there was no follow through buying in the pair. And risk of a deeper pull back is increasing considering EUR/GBP was rejected from 0.9304 key resistance. Therefore, we will just close the position at market this week first.
On the other hand, we'll try to ride on the another bullish wave in Canadian Dollar and buy CAD/JPY at market. Stop will be placed at 87.90. Above mentioned 94.31/95 resistance zone will be our target.
EUR/USD Weekly Outlook
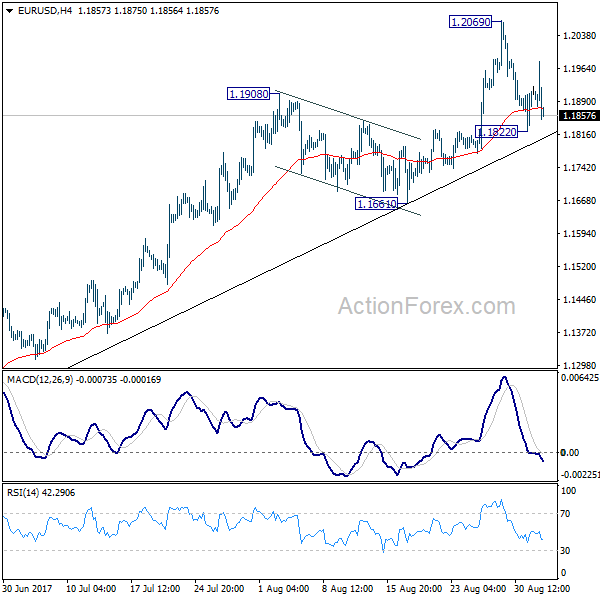
EUR/USD jumped to 1.2069 last week but retreated sharply since then. The rebound from 1.1822 was short lived as the pair turned southward again. Initial bias is neutral this week first as consolidation from 1.2069 could extend. Below 1.1822 will bring deeper fall. But after all, there is no clear sign of trend reversal yet. Outlook will remain bullish as long as 1.1661 holds. Break of 1.2069 will extend larger rise from 1.0339 to next key fibonacci level at 1.2516. Nonetheless, break of 1.1661 will bring much lengthier consolidation first.
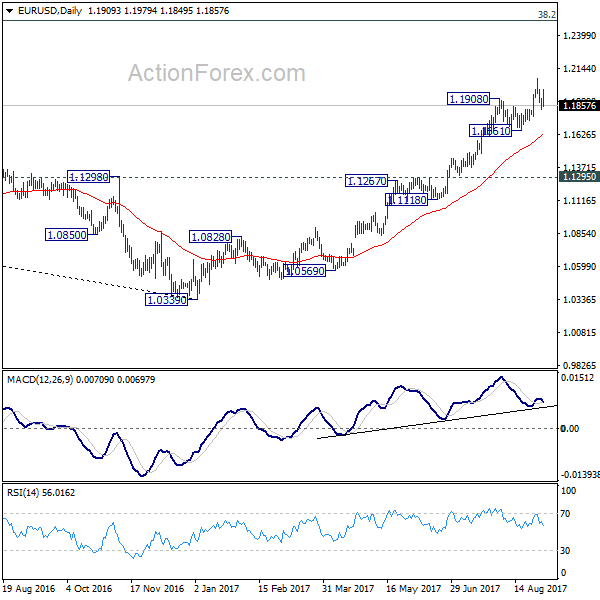
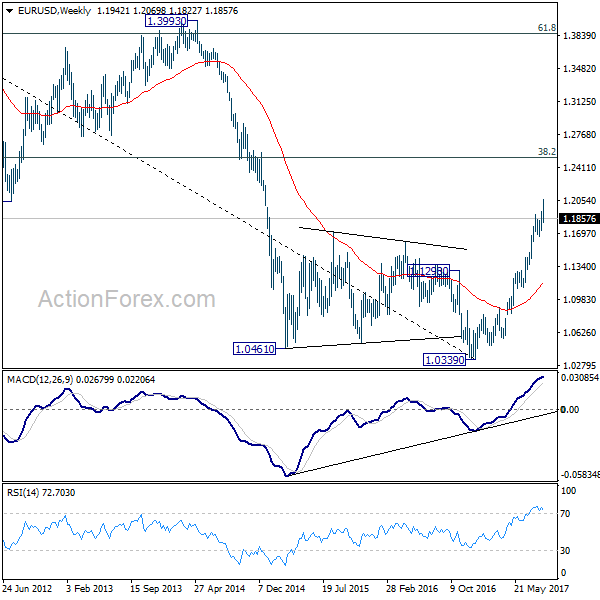
In the bigger picture, an important bottom was formed at 1.0339 on bullish convergence condition in weekly MACD. Sustained trading above 55 month EMA (now at 1.1774) will pave the way to key fibonacci level at 38.2% retracement of 1.6039 (2008 high) to 1.0339 (2017 low) at 1.2516. While rise from 1.0339 is strong, there is no confirmation that it's developing into a long term up trend yet. Hence, we'll be cautious on strong resistance from 1.2516 to limit upside. For now, medium term outlook will remain bullish as long as 1.1295 support holds, in case of pull back.
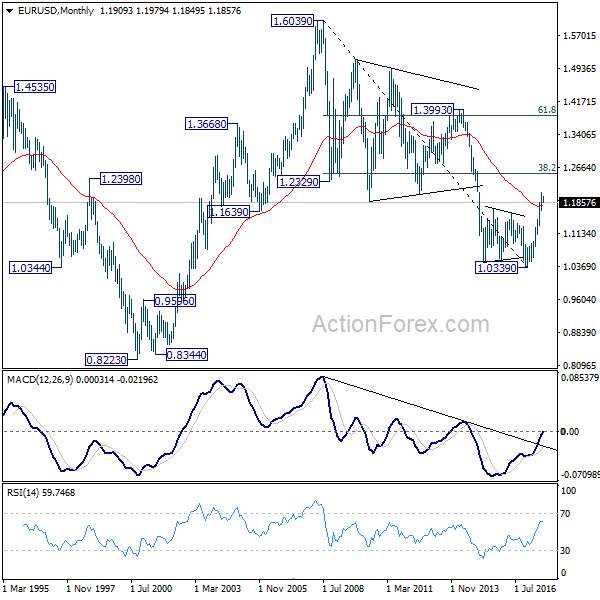
In the long term picture, 1.0339 is now seen as an important bottom as the down trend from 1.6039 (2008 high) could have completed. It's still early to decide whether price action form 1.0339 is developing into a corrective or impulsive move. But in either case, further rally would be seen to 38.2% retracement of 1.6039 to 1.0339 at 1.2516
Summary 9/4 – 9/8
Monday, Sep 4, 2017
[php_everywhere] [/php_everywhere]
Tuesday, Sep 5, 2017
[php_everywhere] [/php_everywhere]
Wednesday, Sep 6, 2017
[php_everywhere] [/php_everywhere]
Thursday, Sep 7, 2017
[php_everywhere] [/php_everywhere]
Friday, Sep 8, 2017
[php_everywhere] [/php_everywhere].
Weekly Economic and Financial Commentary: Slower Trend in Hiring but Consumers Still Confident
U.S. Review
Slower Trend in Hiring but Consumers Still Confident
- Employers added 156,000 new jobs in August, while the unemployment rate ticked up to 4.4 percent. Average hourly earnings rose a tick and are up 2.5 percent over the past year.
- Manufacturing activity strengthened in August, with the ISM index rising to a six-year high of 58.8.
- The Consumer Confidence Index rose to 122.9 in August on improved views of current and expected conditions.
- Headline and core PCE inflation rose 0.1 percent in July. Core inflation is up only 1.4 percent over the past year, which is the smallest increase since late 2015.
Slower Trend in Hiring but Consumers Still Confident
Payroll growth slowed in August with employers adding 156,000 jobs. It is worth noting that the initial print for August payrolls has historically seen the largest upward revisions between the first and third release. Over the past five years, August payrolls have been revised up by an average of 46,000, suggesting the extent of the slowdown may be overstated. That said, job growth for June and July was also revised lower by a total of 41,000 jobs and indicates that the trend in hiring has genuinely eased. The unemployment rate rose to 4.4 percent amid a drop in the household measure of employment. The labor force participation rate was unchanged at 62.9 percent.
On an industry basis, the composition of hiring was favorable. Manufacturers added 36,000 jobs, consistent with the leap in the ISM manufacturing employment component to a six-year high. Gains were also strong in construction (+28,000) and professional & business services (+40,000). Weakness was more evident in lower-wage sectors such as retail (+1,000) and leisure & hospitality (4,000). Despite the favorable composition of job growth, average hourly earnings rose just 0.1 percent in August, keeping the 12-month change in wages at 2.5 percent.
The labor market remains fairly tight despite the recent slowdown, which has helped to bolster consumer confidence. The Conference Board's measure rose 2.9 points in August from an already elevated reading. August's gain was mostly driven by more favorable views of current business conditions and the labor market. A larger share of respondents viewed jobs as "plentiful" while fewer viewed jobs as "hard to get." The difference between these two series, known as the labor differential, suggests that the downward trend in the unemployment rate should resume.
The expectations component also rose in August, as more consumers thought income would increase over the next six months. Greater optimism about future income followed a solid month of realized gains. Personal income rose 0.4 percent in July, led by a 0.5 percent rise in wages and salaries. While July's gain marks a welcome rebound after income was flat in June, income growth still looks tepid compared to the first few months of the year; over the past three months, nominal income has grown at a 3.0 percent annualized rate.
Spending trailed just behind income growth in July, rising 0.3 percent. While this was a shade less than what markets were expecting, it followed an upward revision to June. Moreover, low inflation has helped support real spending. After an unchanged reading in June, PCE inflation rose just 0.1 percent in July.
While low inflation has benefitted real income and spending gains of late, it remains a headache for the Fed. Both headline and core inflation are up only 1.4 percent over the past year. That marks the weakest 12-month change in core inflation since December 2015. Unlike then, however, the dollar has been weakening and commodity prices have been largely stable, which has made it harder for the Fed to consider the weakness transitory.
U.S. Outlook
Factory Orders • Tuesday
With a help from a surge in aircraft bookings, factory orders jumped 3.0 percent in June and in so doing notched the biggest gain in eight months. The aircraft surge lifted overall durables 6.4 percent, its biggest sequential increase since July 2014. As it happens, it was a jump in aircraft orders back in 2014 that was behind the surge at that time as well. The experience in 2014 should make us circumspect about what to expect on Tuesday. The record surge in July 2014 was followed by a record decline in August 2014 when durables tumbled 18.4 percent on the month. Likewise, we expect factory orders to contract 3.2 percent in July as we expect aircraft orders to decline on the month.
Purchasing manager surveys have shed a few points lately, but most still remain firmly in expansion territory. On that basis, we take the back-to-back declines in nondurable goods with a grain of salt, but will also be wary if July brings a surge on the nondurable side.
Previous: 3.0% Wells Fargo: -3.2% Consensus: -3.2% (Month-over-Month)
Trade Balance • Wednesday
Strong export growth drove the trade deficit lower in June. The decline in the trade deficit in June was the combination of a $2.4 billion increase in exports of goods and services and a $396 million decline in imports. There was broad-based strength on the export side of the ledger in June, with exports of capital goods, agricultural products, automobiles and parts, and industrial supplies and materials all posting gains during the month.
The advance estimate of real GDP growth in Q2-2017 showed that real net exports contributed positively (0.2 percentage points) to overall growth in the second quarter. Given the strong monthly momentum, real exports likely will rise further in the third quarter. In contrast, real imports of goods edged up only 0.1 percent in both May and June. Unless the recent trends in exports and imports completely reverse in the next month or two, real net exports likely will not exert much headwinds on real GDP growth in Q3.
Previous: -$43.6B Wells Fargo: -$44.5B Consensus: -$44.6B
ISM Non-Manufacturing • Wednesday
The ISM non-manufacturing composite index dropped 3.5 points to 53.9 in July, as service sector activity retreated to the lowest point in almost a year. The details of last month's report were less than encouraging, as the largest decline was in the forward-looking new orders index, which dropped 5.4 points to 55.1. The slowdown in business activity was notable in July, as it was caused by a larger share of firms reporting declining activity.
We expect the ISM non-manufacturing index to rebound in August. The rebound we expect is largely a payback story, following the sharp decline to 53.9 in July from 57.4 in June. We expect all the underlying components of the index to remain above the 50 demarcation line as the incoming data point to continued expansion in the index.
Previous: 53.9 Wells Fargo: 55.3 Consensus: 55.4
Global Review
Mixed Numbers on Japan, Strong GDP in Canada
- Industrial production in Japan declined 0.8 percent on a month-over-month basis in July, but output remains up 4.7 percent from where it was a year ago. Earlier in the week Japanese retail sales for July showed a 1.1 percent increase, which was better than expected.
- In this week's International Review on page 4, we discuss the much-better-than expected second quarter GDP report in Canada and what it signals for next week's rate decision from the Bank of Canada.
Solid Q2 GDP in Canada
Canada's economy expanded at an annualized rate of 4.5 percent in the second quarter, besting market expectations of a 3.7 percent gain. For the second consecutive period Canada's economy outpaced the rest of the G-7 economies.
In recent months, the year-over-year GDP growth numbers have crested above 4.0 percent. As the middle chart shows, that is the fastest annual growth Canada has seen in roughly a decade. The faster growth is catching forecasters and financial markets somewhat by surprise. Even the Bank of Canada (BoC), which has been known to overshoot its growth estimates from time-to-time, is forecasting only 2.8 percent GDP growth for 2017 as a whole, according to projections in its July Monetary Policy Report. Growth would need to slow meaningfully in the second half of the year to come in with anything below 3.0 percent.
Canada's households continue to boost the economy, with spending growing at an annualized rate of more than 4.5 percent each of the first two quarters of the year. We were already concerned about high consumer debt levels in Canada, and today's report increases that concern. Consumer spending was so strong in Q2 that the personal savings rate slipped below 5.0 percent in the first half of the year, after having remained above 5.0 percent in 2016. Household debt as a share of GDP was 101.4 percent as of the end of 2016—up from less than 80 percent a decade ago.
Business investment, which had been under pressure in 2015 and 2016 due to depressed commodity and oil prices, has rebounded in recent quarters, although admittedly the 1.9 percent growth rate for business investment in the second quarter marks a significant slowdown relative to the 10.5 percent surge in the first three months of the year. The Ivey PMI, a proxy for business activity, came in at 60 for the month of July. A number above 50 is consistent with continued expansion.
Business inventories ratcheted up another $14 billion after a $10.3 billion increase in the prior quarter. While the quickening demand environment in Canada may justify the stockpiling, we suspect a slower pace of inventory accumulation in the second half may be a drag on GDP growth.
After being a drag on overall growth in Q1, net exports boosted growth in the second quarter, adding seven-tenths of a percentage point to the overall top-line growth rate for the period.
Bank of Canada Meeting Next Week Is Live
The BoC lifted its overnight rate to 0.75 percent at its July meeting and has since maintained a tightening bias. Prior to Thursday's report, we would have said that the next hike could come as soon as the October meeting.
While that is still our base case scenario, we would be remiss not to acknowledge there is some risk policy-makers could act at their scheduled meeting this coming Wednesday. CPI inflation at 1.2 percent is still near the low end of the target range, meaning they are not compelled to act now.
Global Outlook
Bank of Canada Meeting • Wednesday
The Bank of Canada (BoC) elected to increase its benchmark policy rate in July by 25 basis points, marking the first increase since 2010. The change in policy came amid broad improvement in the Canadian economy. Real GDP has steadily accelerated since late 2015, led by improvements in the labor market and strong consumer spending. Core inflation had been slowing since mid- 2016 but has since begun to bottom out around 1.5 percent.
Despite the more steady inflation readings of late, core inflation remains near the lower bound of the BoC's 1-3 percent target range. In addition, the BoC is faced with the challenge of tightening policy enough to prevent increasing household debt imbalances without tightening too rapidly and causing a sharp economic disruption. As a result, we do not expect a rate hike at the meeting next week, but another hike could come as early as October.
Previous: 0.75% Wells Fargo: 0.75% Consensus: 0.75%
European Central Bank Meeting • Thursday
All eyes will be on the European Central bank (ECB) when it meets this week to discuss possible changes to its bond-buying program. Earlier this year, hawkish comments from ECB policymakers led to a brief sell-off in European sovereign bonds, leading some to believe that a tighter monetary policy was just around the corner.
The Eurozone recovery has become increasingly self-sustaining amid steady employment gains and improving business sentiment. Despite the firming growth environment, core inflation has been listless around 1 percent for the past two years. Our forecast looks for real GDP in the Eurozone to grow 2.1 percent in 2017 which would be the strongest annual average growth rate since 2007. We believe improving economic conditions and gradually accelerating prices will spur the ECB to continue tapering its bond purchases in the months ahead and cease buying bonds altogether in the first half of next year.
Refinancing Rate: 0.00% Wells Fargo: 0.00% Consensus: 0.00%
U.K. Industrial Production • Friday
Economic growth in the United Kingdom has slowed from its cyclehigh reached in 2014, but the deceleration has not been as sharp as originally feared in the wake of Brexit. That said, production in investment-oriented sectors of the economy remains soft amid the uncertainty surrounding the ongoing Brexit negotiations. Industrial production declined sharply in Q1 and, after two relatively flat readings to start Q2, finally saw a 0.5 percent jump in June.
The Bloomberg consensus expects another monthly increase in industrial production in July. The weaker sterling has likely provided a boost to the U.K. manufacturing sector. Real exports of goods and services have accelerated from the pace seen in the second half of last year. Stronger growth in the global economy, especially in the Eurozone, to which the United Kingdom sends 40 percent of its exports, is likely also boosting trade activity.
Previous: 0.5% Consensus: 0.2% (Month-over-Month)
Point of View
Interest Rate Watch
Evolution of Credit Flows
Over the last year we have witnessed an evolution of the economic fundamentals for growth, inflation, monetary policy and market expectations for federal policy actions. For financial markets this evolution has been accompanied by changes in credit flows.
Inflation and Policy Expectations and Global Capital Flows
Inflation has risen less than expected by policy makers and as a result, marketdetermined interest rates have risen less than the consensus. Meanwhile the election of President Trump has altered policy expectations.
In response to lower-than-anticipated inflation, global Treasury purchases have risen as illustrated in the top graph. Meanwhile, global investors have sought equity opportunities and interest in corporate debt continues to be very steady. Continued economic growth and anticipated policy actions have certainly prompted global investors to seek U.S. financial assets.
Caution on Commercial Real Estate
Demand for commercial real estate loans has diminished as the economic cycle matures (bottom graph) while banks have tightened credit standards for the same credit. Multifamily residential has fallen, intimating that the apartment construction boom is ending as vacancy rates for apartments have risen over the last two years.
Profit Margins and Equity Capital
The late cycle decline of non-financial profit margins is typical of every economic cycle. The pattern reflects the problem that nominal top line growth, proxied by the combination of real GDP growth and inflation, has not significantly altered over the last three years and yet labor and interest expense has risen for many corporations.
As a result, equity returns have diminished raising a concern that the profit incentives have diminished for adding to capital and labor inputs to improve economic growth ahead. Here is where the lack of progress on fiscal policy may have a negative impact on growth going forward.
Credit Market Insights
Financial Stress of Natural Disasters
Natural disasters such as the recent flooding in Houston can be a major source of financial stress, particularly for homeowners who suffer property damage.
Homeowners insurance does not typically cover flood damage. While The Federal Emergency Management Agency (FEMA) requires that mortgage-holders who live in special flood hazard areas purchase flood insurance, this requirement is not wellenforced and only applies to homes with a greater-than one in four chance of flooding over the course of a 30-year mortgage. In Harris County, which includes Houston, only 15 percent of housing units have flood insurance, according to data from FEMA and the American Community Survey.
Government assistance can also step in, but the scope is limited. Grants from FEMA's Individual Assistance Program, meant to help with home repair, are capped at $33,000, for instance.
After a disaster, many homeowners are therefore left to bear a sizeable portion of the cost of damage to their homes. This increases the vulnerability of affected individuals to financial shocks and can reduce their ability to cover loan payments. The president's disaster declaration for the Houston area imposes an automatic 90-day moratorium on foreclosures for homes with FHA-insured mortgages, allowing some relief, but mortgage defaults and foreclosures may tick up after this period. Credit quality more generally is also likely to deteriorate in Houston in the near-term.
Topic of the Week
A Heavy Blow to Houston & The U.S.
Hurricane Harvey inflicted significant damage along the Texas Gulf Coast, with flooding accounting for most of the damage. Homes, businesses and automobiles all suffered catastrophic losses, of which insurance will only pick up a small part. While it is still too soon to compile a precise estimate, total losses are likely to be in the ballpark of $90 billion. Damages to homes will likely total close to $40 billion and losses of automobiles and other household items will be in the neighborhood of $5 billion. With an economy of more than $550 billion annually, business interruption will likely total at least $28 billion. Adding in damages to commercial property and public infrastructure, the total rises to $90 billion.
Because most of the damage was caused by flooding and not wind, many of the losses are uninsured. Federal disaster relief payments will help offset part of this but homeowners will ultimately bear much of this loss.
Houston's economy is enormous. The region is home to nearly 7.8 million people and has added 824,000 people since 2010. That gain eclipses the entire population of Charleston, South Carolina. The Greater Houston GDP tops $550 billion, which equates to about 3 percent of the nation's GDP. Moreover the region has accounted for 6.6 percent of the nation's GDP growth since 2010.
The loss of economic activity from such a rapidly growing area is likely to show up in the national economic data. Houston is the number one market for new single-family permits and also accounts for about 3 percent of existing home sales. Both are likely to take a hit in coming months but should rebound vigorously in 2018. Motor vehicle sales, retail sales and employment will all likely be negatively impacted as well.
With much of its economy tied to the capital-intensive energy business, Houston will get up and running fairly quickly. Rebuilding will take much longer, however, as insurance and federal aid will need to be sorted out. Zoning requirements may also be tightened in efforts to reduce the risks from future storms.