Sample Category Title
S&P 500, Nasdaq 100 Update – Are Wall Street Indexes Set for a January Jump?
- US stocks have seen two years of strong growth, driven by tech and AI stocks, and are expected to continue performing well in 2025.
- Concerns remain about high valuations and the dominance of the “Magnificent Seven” tech stocks.
- Tesla deliveries fell in the fourth quarter of 2024 due to increased competition and reduced subsidies.
- January historically sees strong performance in US stocks, and technical analysis suggests the S&P 500 may be poised for a recovery.
US stocks have just enjoyed their second blockbuster year which has propelled Wall Street Indexes to fresh ATHs. Markets are now eyeing a hat-trick of impressive years as President Elect Donald Trump gets ready to return to the White House.
A combination of a solid economy supporting corporate profits, moderating interest rates and pro growth policies are seen by many as the reason 2025 could be another positive year for US equities. The S&P 500 has just recorded its second year of 20% + growth, which also means it has recorded the biggest two-year percentage jump since 1998 per Reuters.
Concern Around ‘Magnificent 7’ dominance
The past two years have also brought up many questions by market participants. The reason being that the rally has been fueled by tech and AI stocks while the magnificent 7 now accounts for about 35% +- of the S&P 500. This has raised concerns with many comparing the rise of AI stocks to that of the dotcom bubble.
While the Magnificent Seven are expected to continue performing well, their relative outperformance compared to the S&P 493 is projected to be only 7% in 2025, indicating a potential shift in market leadership. This is according to data from Goldman Sachs Global Investment Research.
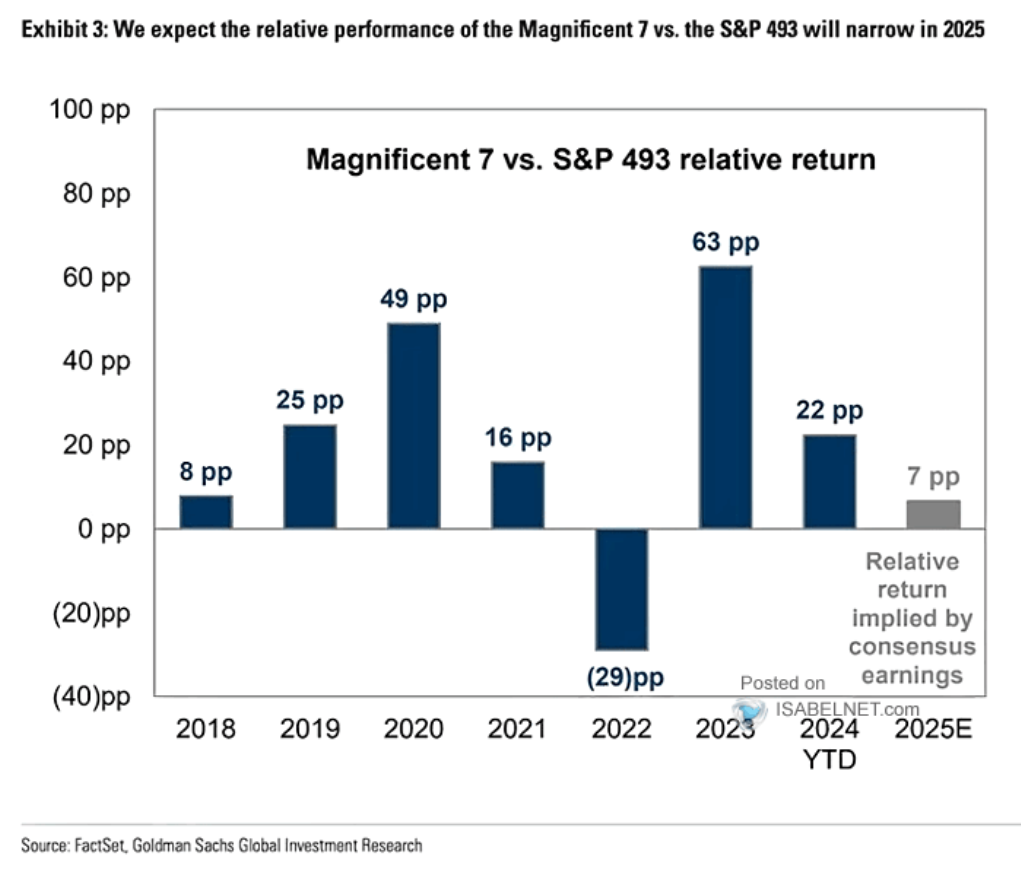
Source: Goldman Sachs Global Investment Research, Isabelnet (click to enlarge)
Market participants seem less concerned with the high valuation environment as the S&P 500 leaves 2024 trading at 24.82 times expected earnings over the next 12 months. According to LSEG, that is well above its long-term average of 15.8, and not far from the 22.6 level it reached earlier this month, its highest since early 2021.
The downside of high valuation historically shows that stocks are more volatile when market expectations are not met with wild swings often occurring. Will 2025 deliver more of the same?
Tesla Deliveries Fall – Competition Heats Up
Elon Musk has been in the news for his rising political and socio-economic commentary of late. However, the year could not get off to a worse start for the world’s richest man as Tesla announced its first drop in yearly deliveries on Thursday, as it delivered fewer electric vehicles than expected in the fourth quarter, and incentives didn’t increase demand for its older models.
Tesla is facing challenges due to reduced subsidies in Europe, a U.S. trend towards cheaper hybrid cars, and stronger competition from China’s BYD.
Tesla was down as much as 3.5% before the opening bell and remains down around 3.8% at the time of writing. Despite this the Nasdaq 100 remains on the front foot following the opening bell, the index was up just over 1%.
Looking Ahead
Looking back at historical performance during the month of January and we see an interesting picture. Based on available data, January usually sees increased investor activity in equity markets, resulting in strong inflows, as the start of a new year often inspires renewed investment strategies and goals.
Another intriguing data point from January shows that US stocks have a tendency to perform strongly during the first half of January, due to factors such as increased investment activity, and positive investor sentiment following the New Year.
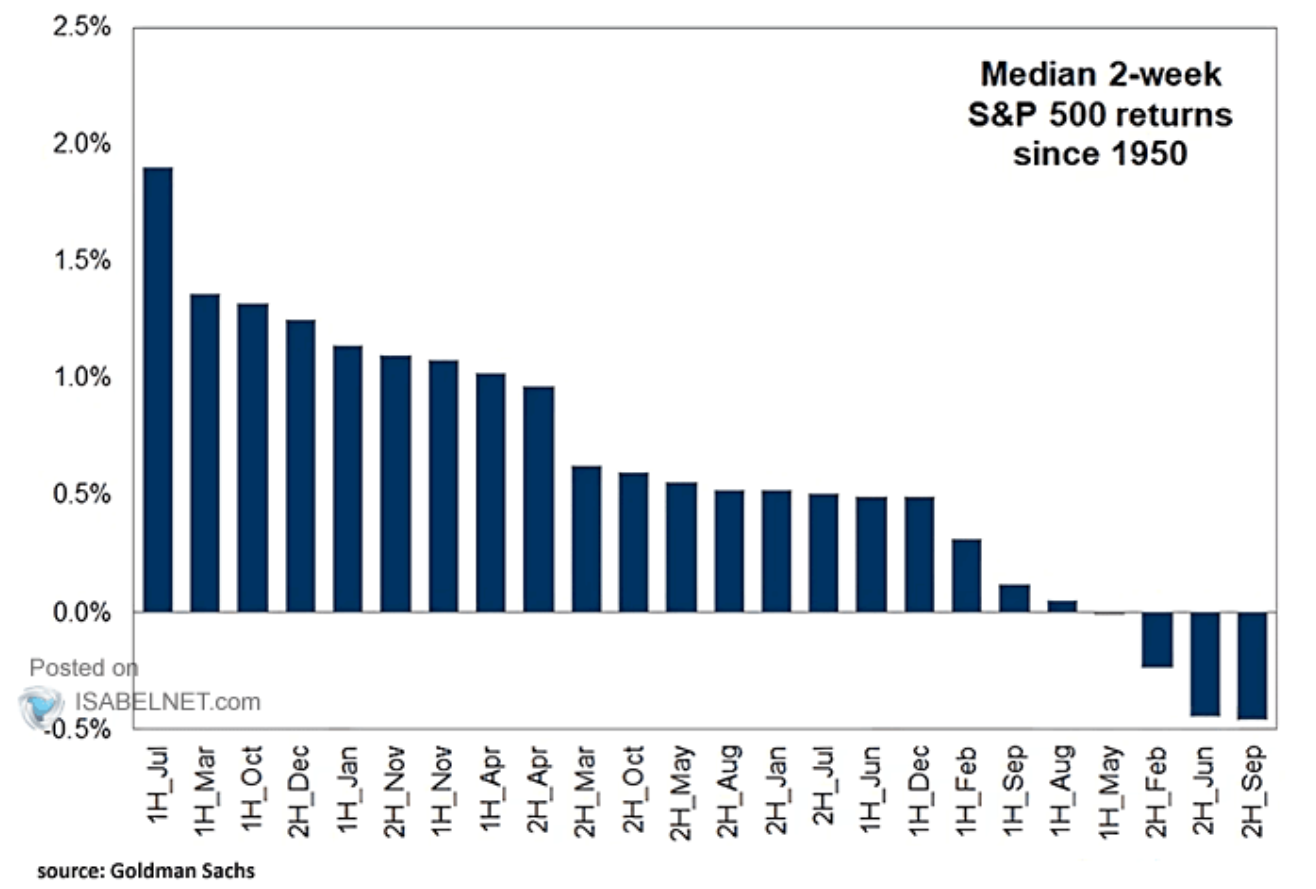
Source: Isabelnet, Goldman Sachs (click to enlarge)
Taking the above into account and with the lackluster ‘Santa Rally’ are US stocks on course for a rise ahead of Donald Trump’s inauguration on January 21?
Technical Analysis
S&P 500
From a technical standpoint, the S&P 500 on a daily timeframe remains bearish following a series of lower highs and lower lows.
However, market participants have failed to print a significant lower low over the last 3 trading days which is a sign that bullish pressure may be building. A bullish daily candle close or a a doji daily candle close could set the index up for a recovery.
Looking at the daily chart above and a daily candle close above the recent swing high at 6026 is needed for a structure change which may embolden bulls even more. This could lead to a push toward fresh all time highs.
The 100-day MA is resting at the 5804 handle and a test of this cannot be ruled out before a rally to the upside. Support below the 100-day MA may be found at 5757, 5700 and 5669 respectively.
S&P 500 Daily Chart, January 2, 2025
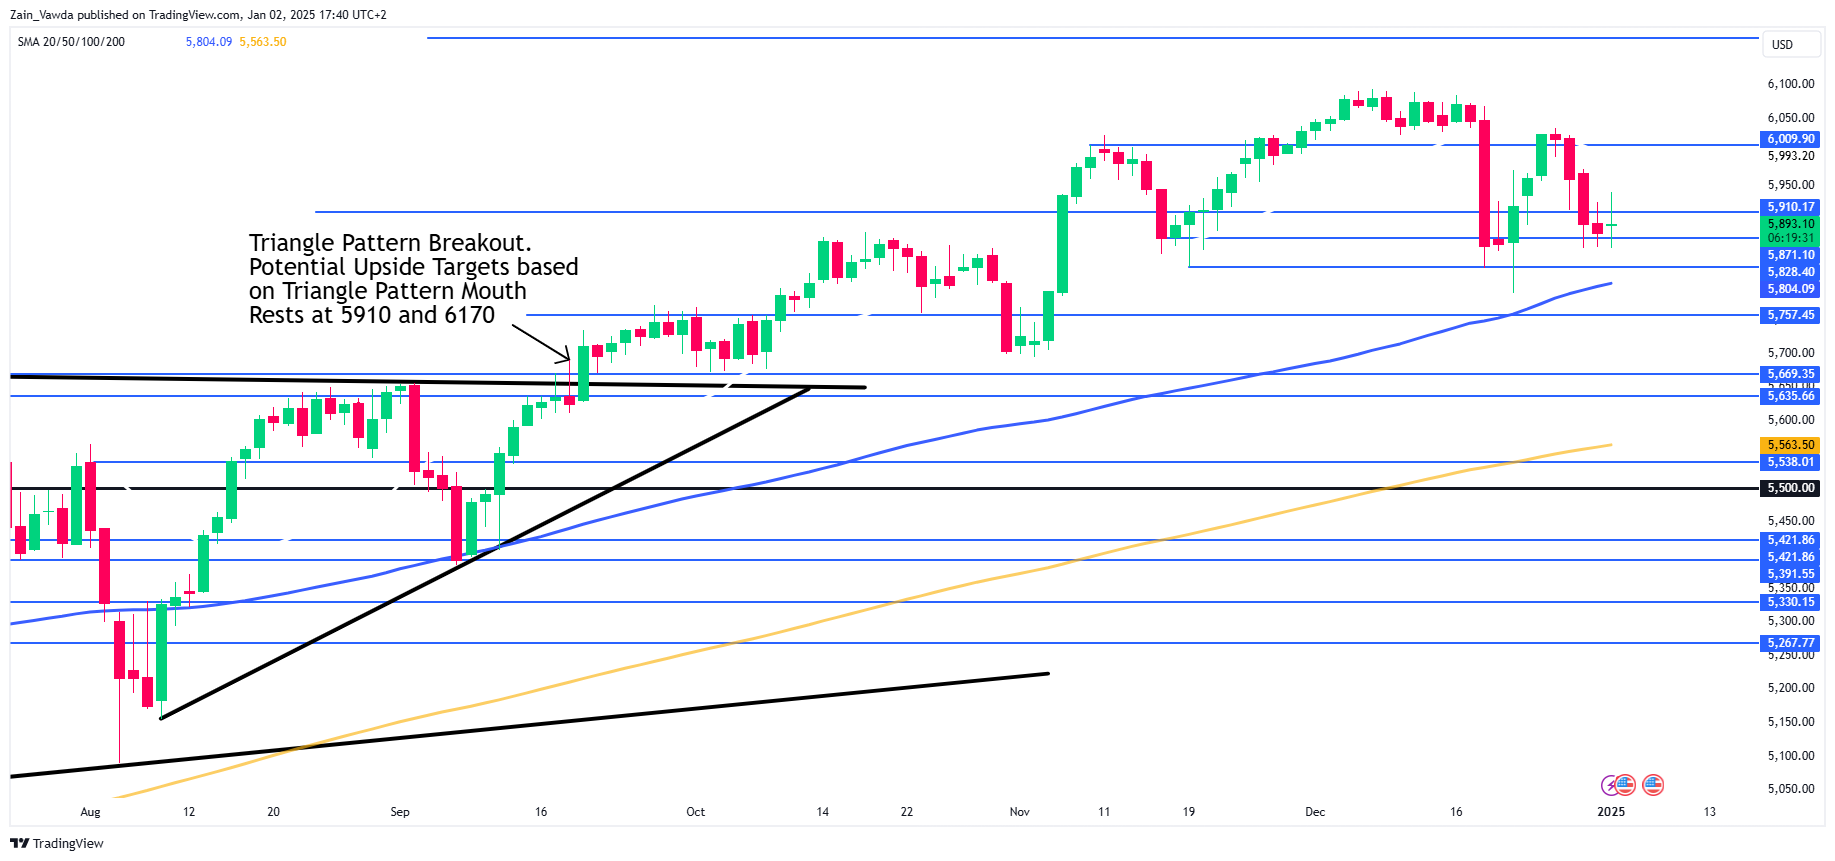
Source: TradingView (click to enlarge)
Support
- 5804
- 5757
- 5700
Resistance
- 5910
- 5950
- 6000
Gold Expected to Remain Underpinned by Political and Economic Uncertainty
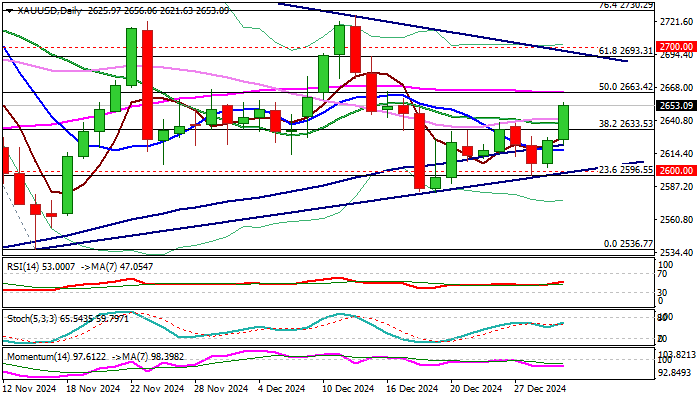
Gold gained nearly 1% in the first trading day in 2025, sending initial positive signal that recovery off $2582 (Dec 18/19 higher base) might be picking up.
The notion is supported by completion of bullish failure swing pattern on daily chart and breach of important barriers at $2637/42 zone (Fibo 38.2% of $2726/$2582 bear-leg /converged 20/30 DMA’s).
Fresh advance penetrated thin daily cloud (spanned between $2642 and $2663) and pressuring daily Kijun-sen ($2654).
Daily close above $2637 is seen as a minimum requirement to keep fresh bulls in play, as 14-d momentum is still in the negative territory and send warning about possible recovery stall.
Fundamentals are expected to remain supportive for the yellow metal, with unstable political and economic situation, sticky inflation, fiscal instability and still a big question mark above possible action of Donald Trump’s administration, marking a solid ground for further gains.
Gold advanced 27% in 2024, marking one of the most significant actions in the history, compared to rallies in 2011 and 2020 and hit new record high at $2790, that exposed psychological $3000 barrier.
However, there is still a long way to complete a corrective phase ($2790/$2536), with pivotal points laying at $2663 (50% retracement) and $2700 zone (Fibo 61.8% / triangle resistance line / psychological), violation of which to improve near-term picture and shift focus to the upside (double-top at $2721/26) and Fibo 76.4% at $2730).
Res: 2663; 2693; 2700; 2726
Sup: 2633; 2621; 2617; 2600
Sterling Starts New Year With Sharp Losses
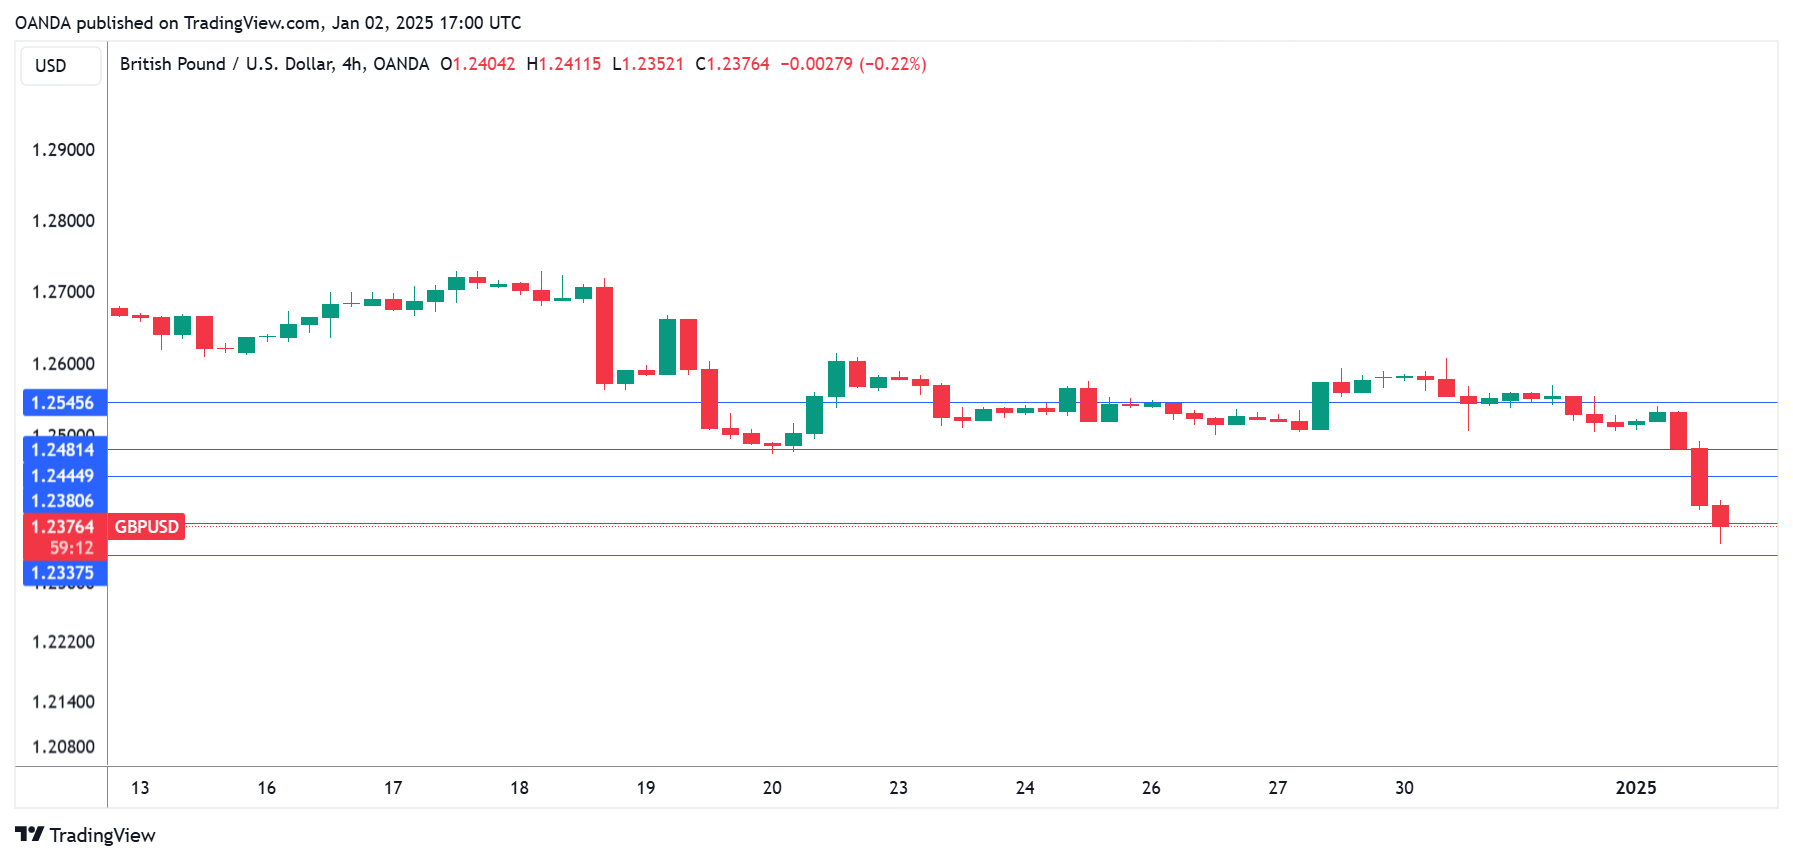
The British pound has started 2025 with sharp losses. In the North American session, GBP/USD is currently trading at 1.2373, down 1.1% on the day.
British pound can’t find its footing
The US dollar has flexed its muscles in recent months and the pound has faltered, sliding 8% since October 1. The pound has fallen to its lowest level since April 2024 and the US dollar, backed by a strong US economy, could continue to pummel the struggling pound. The Fed signaled at the December meeting that it only plans to cut rates twice in 2025, half of the September estimate of four rate cuts.
The BoE ended 2024 on a whimper as it maintained the cash rate at 4.75% at the December meeting. The pause was expected but the vote split was a surprise at 6-3 compared to the forecast of 8-1. The fact that three MPC members voted for a quarter-point cut reflects significant support for the BoE to trim rates and that could mean a cut in February if the December inflation report is lower than expected. The BoE monetary policy summary said that policy would need to remain restrictive until the upside risk to inflation had eased and that the central bank would take a “gradual” approach to easing policy.
UK inflation rose to 2.6% from 2.3% in November. This is the highest level in eight months and the although the alarm bells won’t be ringing at the BoE, policy makers would like to see inflation move back towards the 2% target before cutting rates. The BoE holds its next meeting on Feb. 6 and the December CPI report, which will be released on Jan. 15, will be a critical factor in the BoE rate decision.
GBP/USD Technical
- GBP/USD has pushed below support at 1.2481 and 1.2444 and is testing support at 1.2380. The next support level is 1.2337
- 1.2545 is the next line of resistance
Euro Slides to Lowest Level in Over Two Years
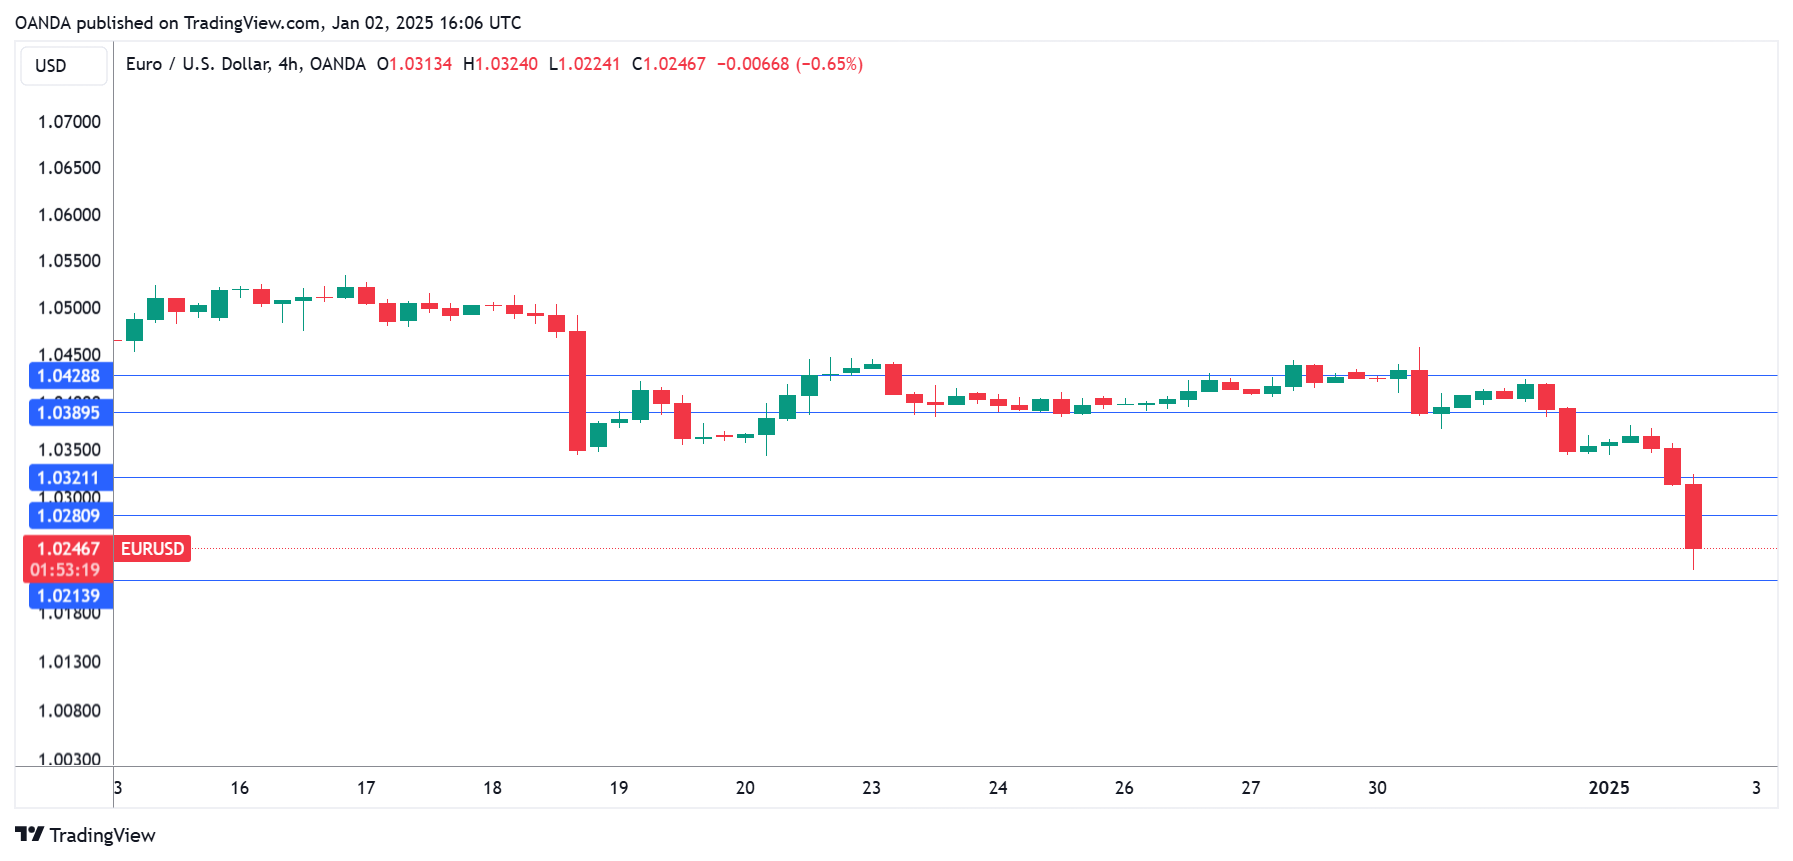
The euro has taken a tumble on Thursday. In the North American session, EUR/USD is currently trading at 1.0246, down 1.06% on the day. The euro has broken below the 1.03 line for the first time since Nov. 2022.
Is euro headed toward parity?
The euro fell more than 6% against the dollar in 2024 and could continue to lose ground in 2025. The Federal Reserve has said it will go slow on rate cuts, a reflection of the strong US economy and resilient labor market. The eurozone economy has been sputtering since late 2022, although the labor market has been overheating. The ECB has cut rates at three straight meetings and seems intent on continuing to lower rates in order to boost the weak economy.
The European Central Bank is expected to cut over 100 basis points this year, more than double the Federal Reserve. A wider US/Europe rate differential will make the dollar more attractive to investors. Could the euro be headed for parity in the near future?
The eurozone released manufacturing PMIs earlier today and the news remains bleak. Among the four largest economies in the eurozone, all are showing contraction in manufacturing activity except for Spain. Germany’s PMI dropped to 42.5 in December, down from 43.0 in October and November, while the eurozone PMI ticked lower to 45.1 in December from 45.2 in November. Manufacturing activity in Germany and the eurozone have been contracting for two years and there doesn’t seem to be much light at the end of tunnel for the struggling manufacturing sector.
We’ll get a look at the US ISM manufacturing PMI on Friday. Manufacturing activity has been contracting and is expected to tick lower to 48.3 in December from 48.4 in November.
EUR/USD Technical
- EUR/USD has pushed below support at 1.0321 and 1.0281. Below, there is support at 1.0231
- There is resistance at 1.0389 and 1.0429
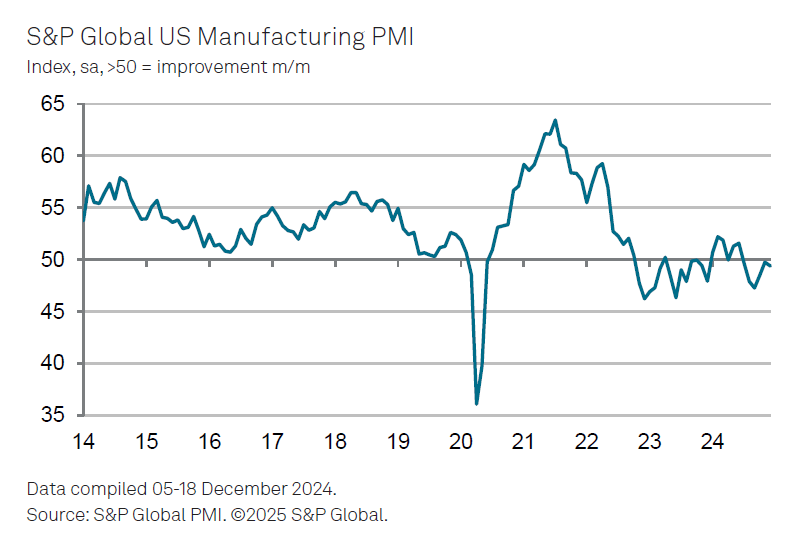
US PMI manufacturing finalized at 49.4, optimism wanes on inflation worries
US PMI Manufacturing Index was finalized at 49.4 in December, a slight dip from November’s 49.7, marking the sixth consecutive month of contraction in the sector. Although the decline in manufacturing health remains modest overall, the pace of deterioration has quickened slightly compared to the prior month.
Chris Williamson, Chief Business Economist at S&P Global Market Intelligence, highlighted the challenges: "US factories reported a tough end to 2024, and have scaled back their optimism for growth in the year ahead."
He pointed to rising production cuts in December as inflows of new orders disappointed. The fleeting boost in customer demand seen after the election in November has faded, leaving factories to contend with subdued sales, particularly in export markets.
Despite the downturn, many manufacturers are cautiously optimistic about the New Year, hoping that the incoming administration’s policies might spur growth. Expectations of reduced regulations, lower taxes, and increased demand for US goods via potential tariffs are contributing to this sentiment. Confidence, which hit a low in June, received a notable boost following the election result in November.
However, firms are increasingly wary of rising input costs and the resurgence of inflation, which could limit the scale of Fed rate cuts in the coming year.
Dollar Index Keeps Firm Tone at the Start of the Year
The dollar index kept firm tone and hit new two year high on the first trading day of the new year, as markets started to gain pace after a quiet holiday mode.
The dollar gained over 7% vs the basket of major world currencies in 2024, following strong swings up and down during the first three quarters of the year and strong acceleration higher in the last three months.
US monetary policy and inflation were among key drivers of the dollar, with its safe-haven appeal during turbulent period of geopolitical and economic uncertainty, also contributing to dollar’s direction.
The latest shift in monetary policy view from Fed, due to new reality of still elevated inflation and promises from incoming administration of Donald Trump for strong boost of the US economy, sparked strong rally in the last quarter of 2024.
Also, a wide difference in monetary policies between the US and other major economies is expected to continue to underpin the dollar in coming months, along with expectations that economic growth acceleration will boost inflation and probably keep US interest rates unchanged, against Fed’s promises of stronger policy easing earlier this year.
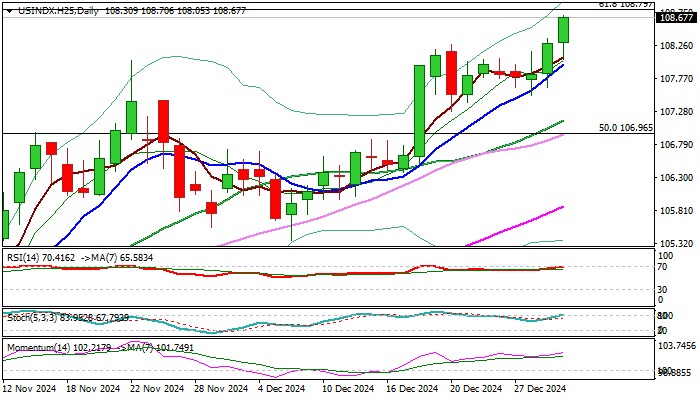
Bullish technical studies on all larger timeframes (Day / Week / Month) contribute to positive short-term outlook (daily / weekly Tenkan-sen is in steep ascend and diverging from Kijun-sen and also creating a bull-cross on monthly chart, while positive momentum remains strong on all three timeframes).
Fresh bulls pressure significant technical resistance at 108.79 (Fibo 61.8% retracement of 114.725/99.20 bear-leg) and firm break here to contribute to strong signals that corrective phase from new multi-year peak (114.72, posted in Sep 2022) might be over that would open way for test of psychological 110 barrier and Fibo level at 111.06 (76.4% retracement).
Minor price adjustments on overbought studies should be anticipated, with 108 zone offering initial support (former top / daily Tenkan-sen) and extended dips to find solid ground at 106 zone (former lower platform of Oct/Nov 2023 / broken Fibo 50%) and keep larger bulls intact.
Res: 108.80; 109.70; 110.00; 111.06
Sup: 108.28; 108.00; 107.51; 107.00
EUR/USD Mid-Day Outlook
Daily Pivots: (S1) 1.0321; (P) 1.0389; (R1) 1.0429; More...
EUR/USD's decline from 11213 resumed by breaking through 1.0330 support and intraday bias is back on the downside. Next target is 1.0199 fibonacci level. On the upside, above 1.0457 minor resistance will turn intraday bias neutral again. But outlook will now stay bearish as long as 1.0629 resistance holds.

In the bigger picture, current development suggests that rebound from 0.9534 (2022 low) has already completed at 1.1274 after rejection by 55 M EMA. Deeper fall should be seen to 61.8 retracement of 0.9534 to 1.1274 at 1.0199. Sustained trading below there will pave way back to 0.9534 low. This will now remain the favored case as long as 1.0629 resistance holds.

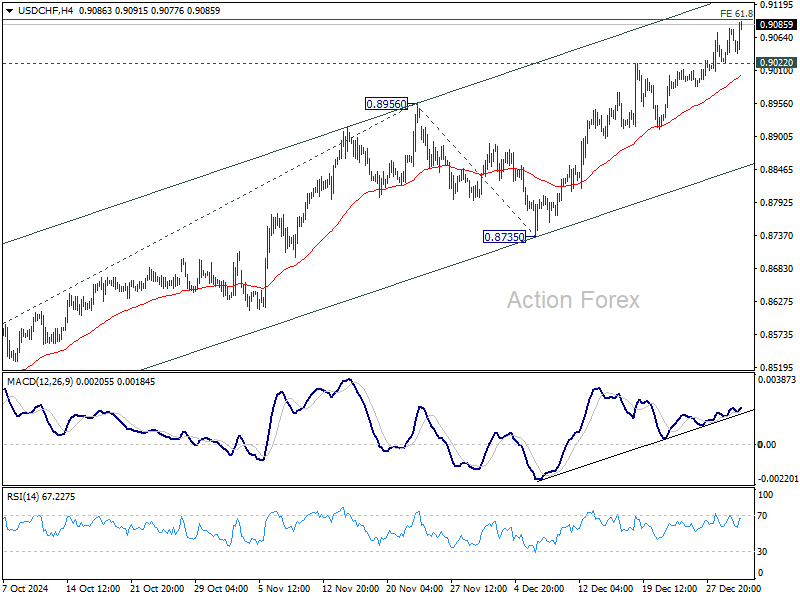
USD/CHF Mid-Day Outlook
Daily Pivots: (S1) 0.9024; (P) 0.9052; (R1) 0.9095; More…
USD/CHF's rally fro 0.8374 is still in progress and intraday bias stays on the upside. Firm break of 61.8% projection of 0.8374 to 0.8956 from 0.8735 at 0.9095 will pave the way to 0.9223 ley resistance next. On the downside, below 0.9022 minor support will turn intraday bias neutral first. But outlook will stay bullish as long as 0.8956 resistance turned support holds.
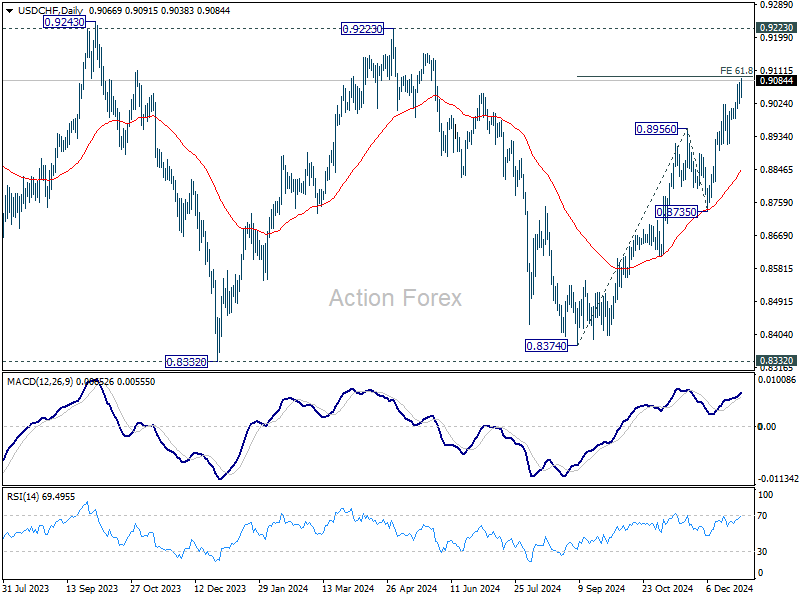
In the bigger picture, price actions from 0.8332 (2023 low) are currently seen as a medium term corrective pattern, with rise from 0.8374 as the third leg. Overall outlook will continue to stay bearish as long as 0.9223 resistance holds. Break of 0.8332 low is in favor at a later stage when the consolidation completes.
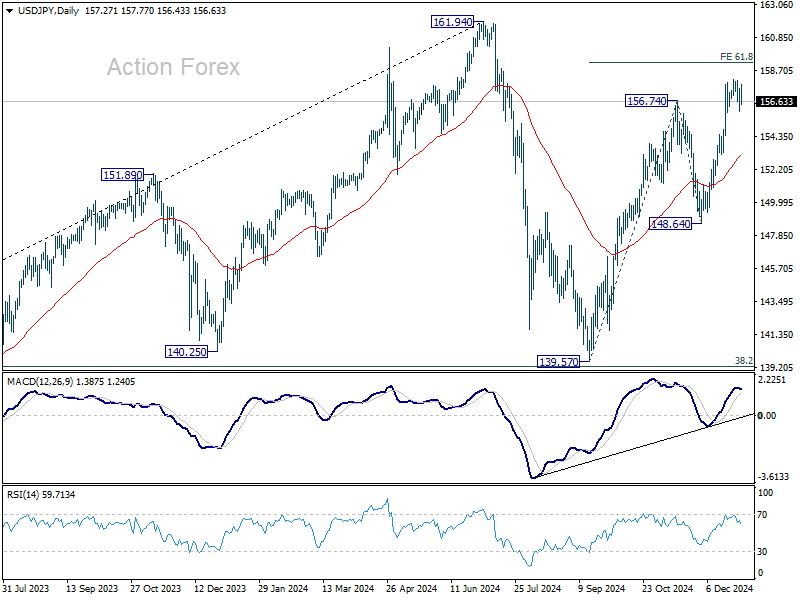
USD/JPY Mid-Day Outlook
Daily Pivots: (S1) 156.70; (P) 157.38; (R1) 158.09; More...
USD/JPY is staying in consolidation below 158.06 and intraday bias remains neutral. Outlook will stay bullish as long as 55 D EMA (now at 153.16) holds. On the upside, above 158.06 will resume the rally from 139.57 to 61.8% projection of 139.57 to 156.74 from 148.64 at 159.25. Firm break there will pave the way back to 161.94 high.
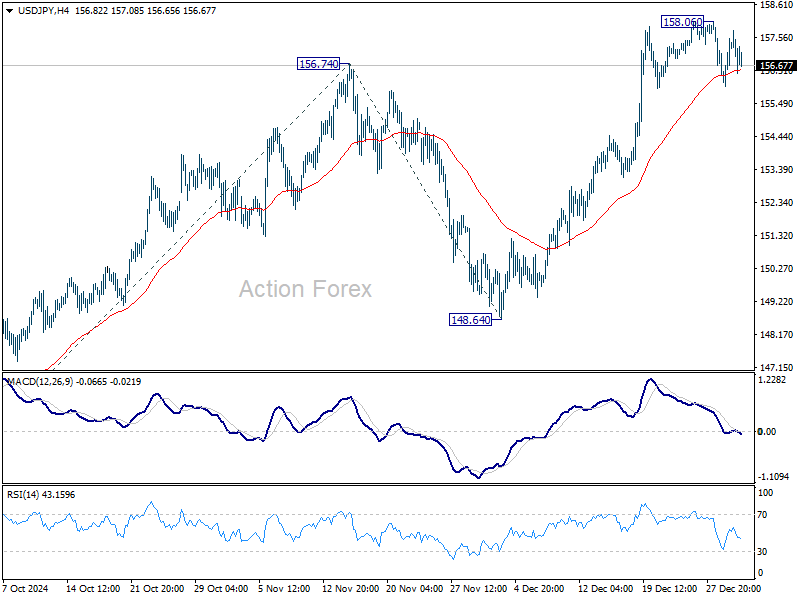
In the bigger picture, price actions from 161.94 are seen as a corrective pattern to rise from 102.58 (2021 low). The range of medium term consolidation should be set between 38.2% retracement of 102.58 to 161.94 at 139.26 and 161.94. Nevertheless, sustained break of 139.26 would open up deeper medium term decline to 61.8% retracement at 125.25.
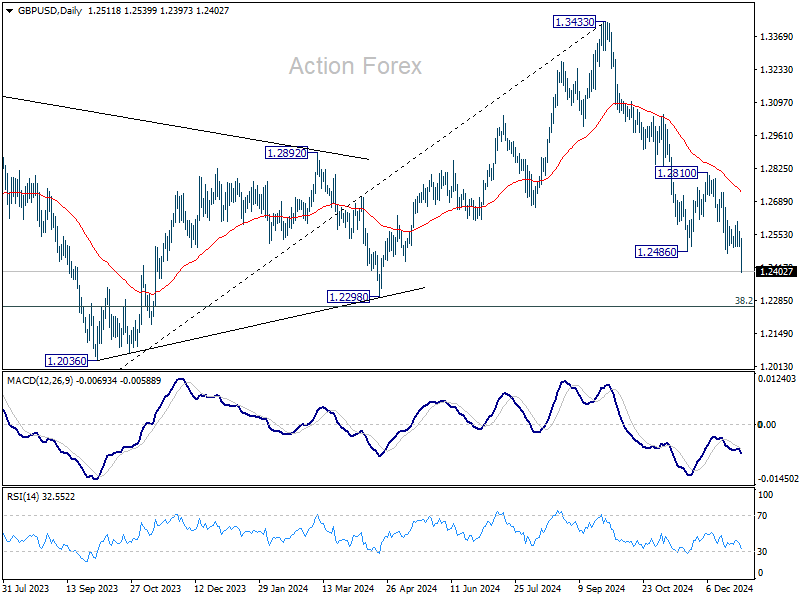
GBP/USD Mid-Day Outlook
Daily Pivots: (S1) 1.2481; (P) 1.2545; (R1) 1.2582; More...
GBP/USD's decline from 1.3433 resumed by breaking through 1.2474 support today. Intraday bias is back on the downside for 1.2298 cluster support zone. Strong support is expected there to contain downside to bring rebound, at least on first attempt. On the upside, break of 1.2606 minor resistance will indicate short term bottoming, and turn bias back to the upside for 1.2810 resistance next.
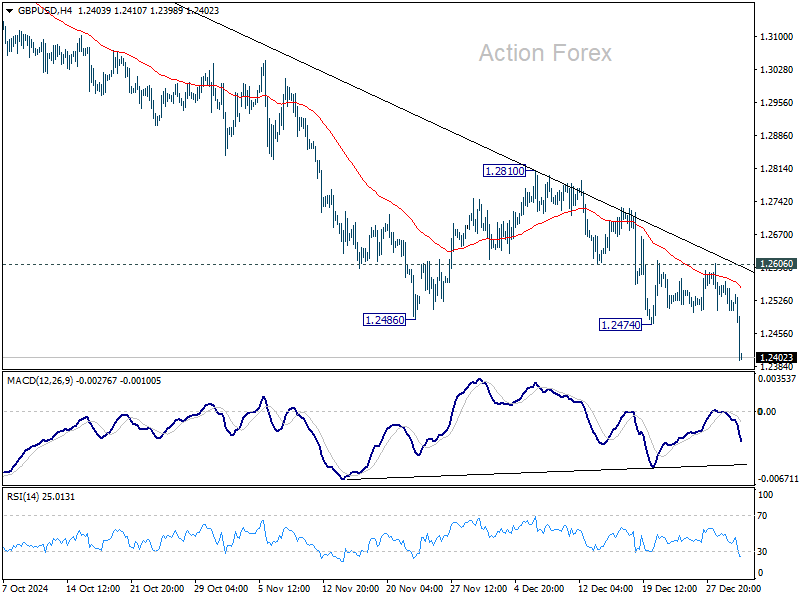
In the bigger picture, price actions from 1.3433 medium term are seen as correcting whole up trend from 1.0351 (2022 low). Deeper decline could be seen to 38.2% retracement of 1.0351 to 1.3433 at 1.2256, which is close to 1.2298 structural support. But strong support is expected there to bring rebound to extend the corrective pattern.