Sample Category Title
EURUSD: Larger Bears to Consolidate Before Resuming Lower, Parity Level Coming in Focus
EURUSD edges higher early Friday on a partial profit-taking at the end of the week, after the latest three-day acceleration pushed the price to the lowest levels in over two years.
Larger bears are likely to take a breather above important support at 1.0200 (Fibo 61.8% retracement of 0.9535/1.1275, Sep 2022 – July 2023 rally) and position for fresh push lower as 1.0200 marks the last significant obstacle on the way towards parity level, which came in focus as next target.
Daily Tenkan-sen / former low at 1.0350 zone offer solid resistance which should ideally cap and keep near term bears intact.
Technical picture remains firmly bearish on daily chart (strong negative momentum / MA’s in full bearish setup and price action weighed by thick falling daily Ichimoku cloud) and support scenario.
Only sustained break above 1.0430 (daily Kijun-sen) would sideline bears for stronger correction.
Res: 1.0345; 1.0405; 1.0430; 1.0460.
Sup: 1.0224; 1.0200; 1.0150; 1.0100.
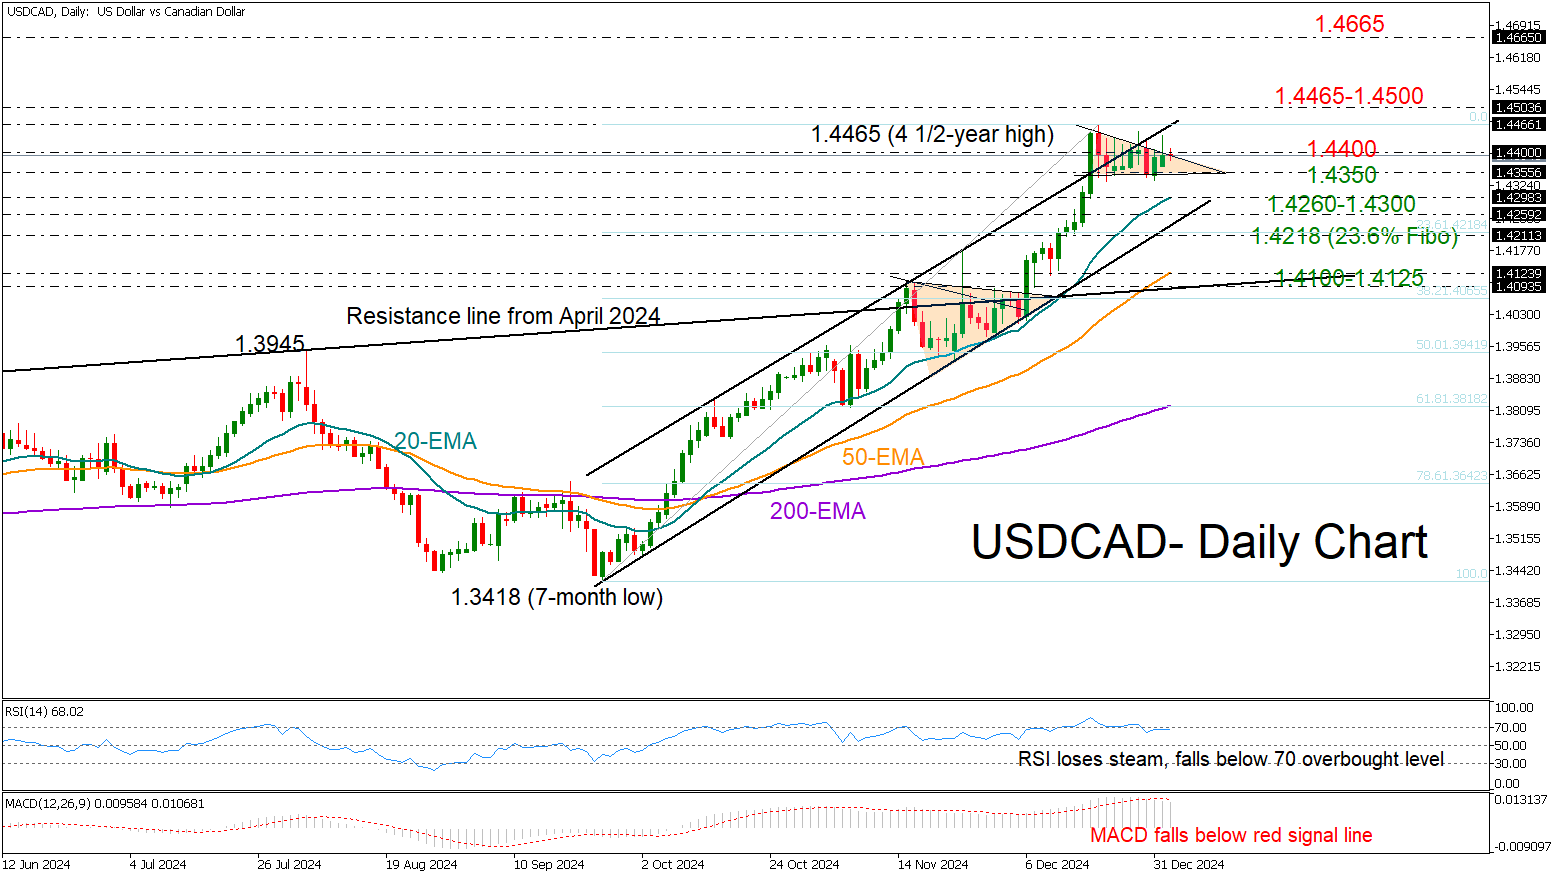
Has USD/CAD Reached a Peak Point?
- USDCAD holds short-term range ahead of ISM manufacturing PMI.
- Bulls lose power but not the battle, uptrend intact above 1.4260.
USDCAD is holding steady within the tight three-week-old range of 1.4350-1.4400 despite a brief rise to 1.4465 in the first trading day of 2025.
Technical indicators point to weakening buying sentiment, with the MACD decelerating below its red signal line and the RSI retreating from overbought territory. Despite this, the price seems to be forming a descending triangle at the top of its three-month-old uptrend, a pattern typically signaling continued bullish movement. Supporting this view, the exponential moving averages (EMAs) show a positive slope.
For a clearer bullish signal, the pair needs a close above 1.4400 and perhaps a sustainable move above the critical resistance zone of 1.4465-1.4500 before reaching the 2020 high of 1.4667. This is near the 2016 top of 1.4689, a break of which could open the door for the 1.4800 barrier last seen in 2003.
Alternatively, a slide below the 1.4350 floor could instantly pause near the 20-day EMA at 1.4300 or around the support trendline at 1.4260. If the 23.6% Fibonacci retracement of the September-December uptrend at 1.4218 fails too, the price could slide toward the 50-day EMA at 1.4125.
All in all, USDCAD is in a wait and see mode. A clear move above 1.4400 could trigger the next bull run, whilst a drop below 1.4350 may activate selling orders.
Crypto Hesitates to Grow Without Stocks
Market picture
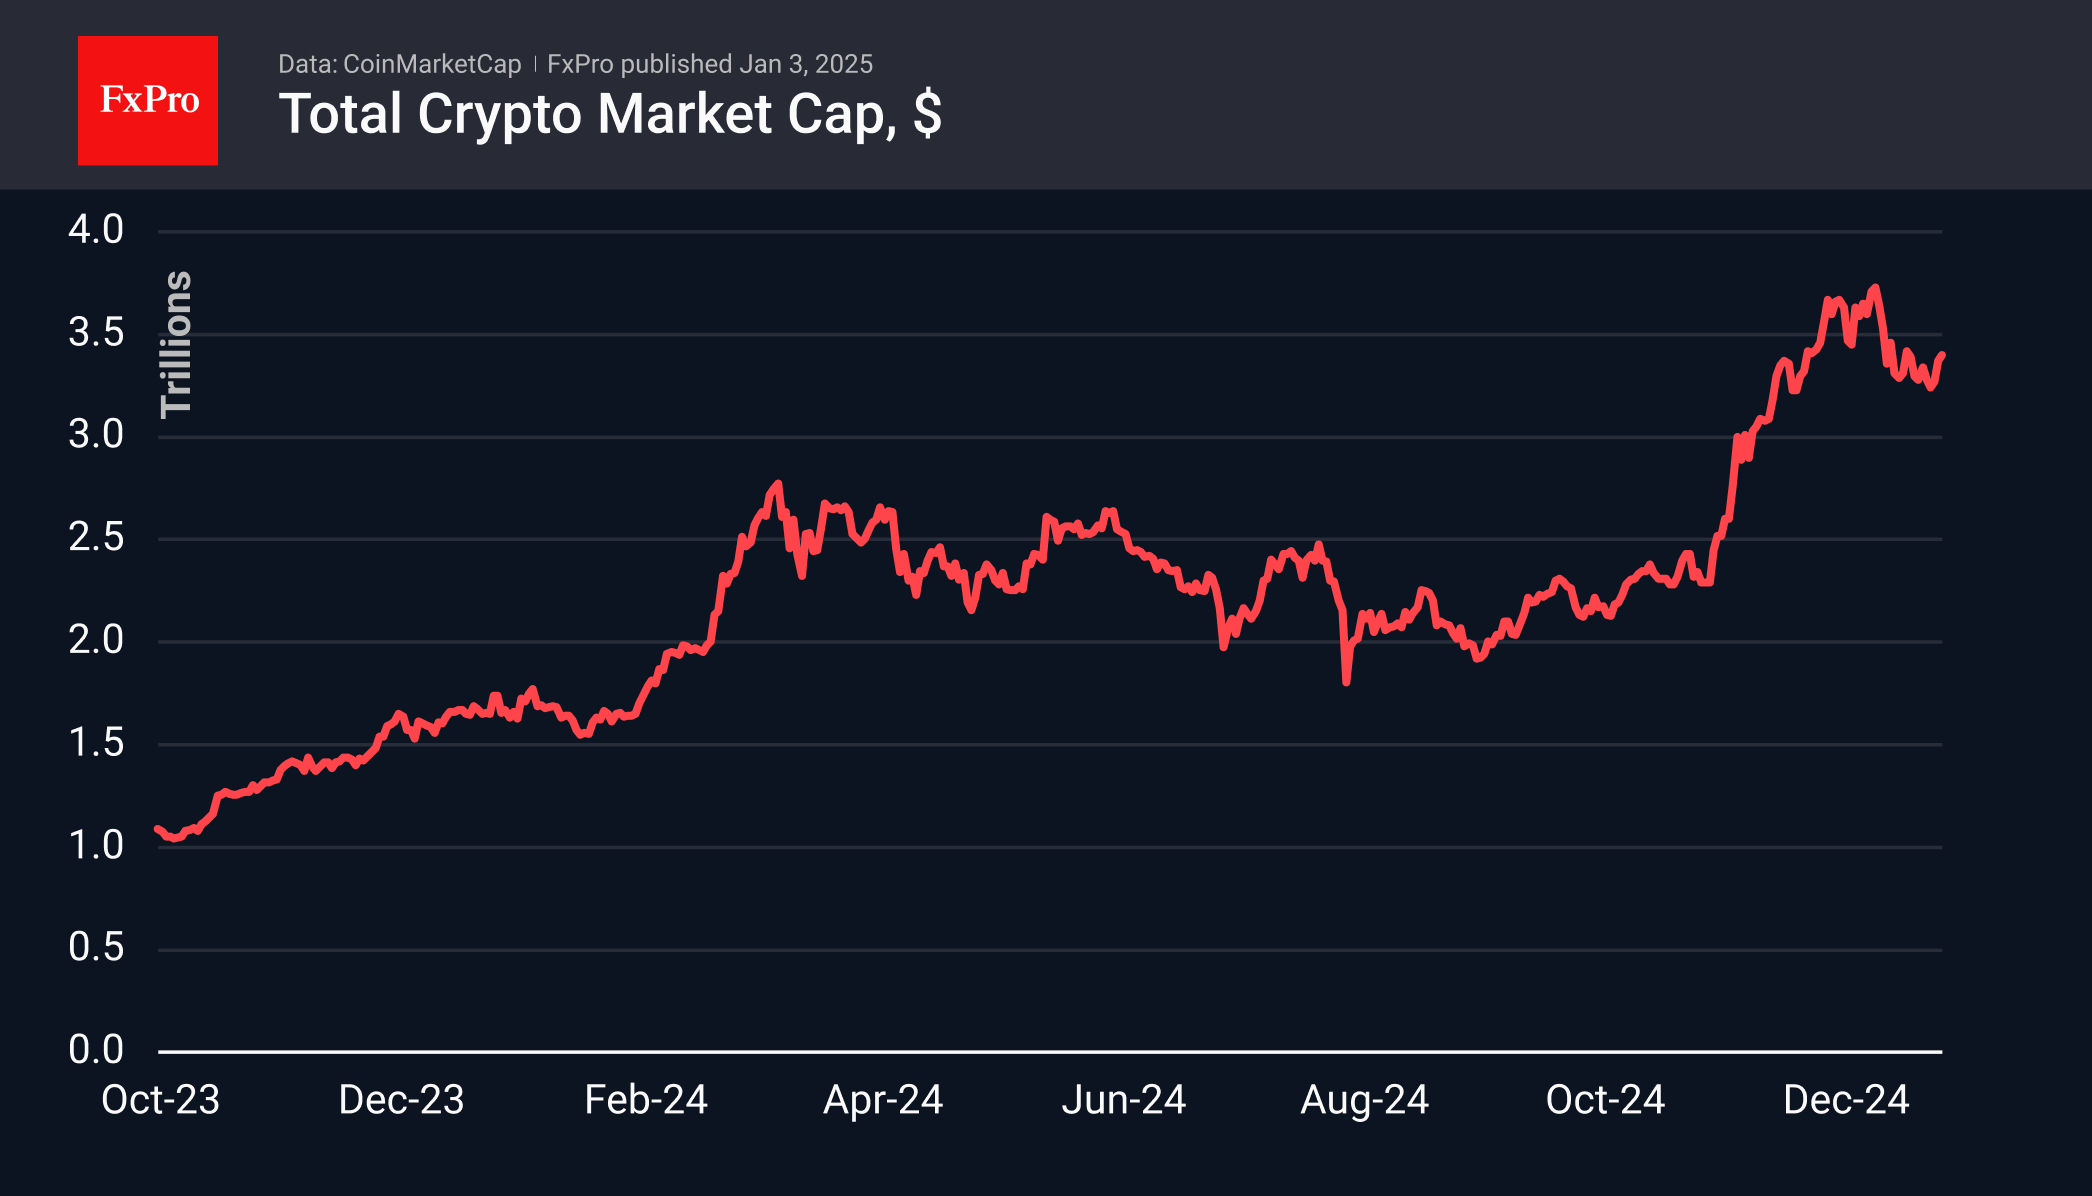
The crypto market is trying to start 2025 with growth, adding 4% since the beginning of the year. Like in late December, the market is stalling on reaching a capitalisation of $3.41 trillion. This time, the positive mood of cryptocurrency enthusiasts was undermined by a sharp downward reversal in the US and Chinese stock markets.
We pay attention to the reduced trading volumes, which indicate a wait-and-see attitude among market participants and a search for new ideas. At the same time, the support of around $3.20 trillion makes the latest pullback a correction, not a reversal.
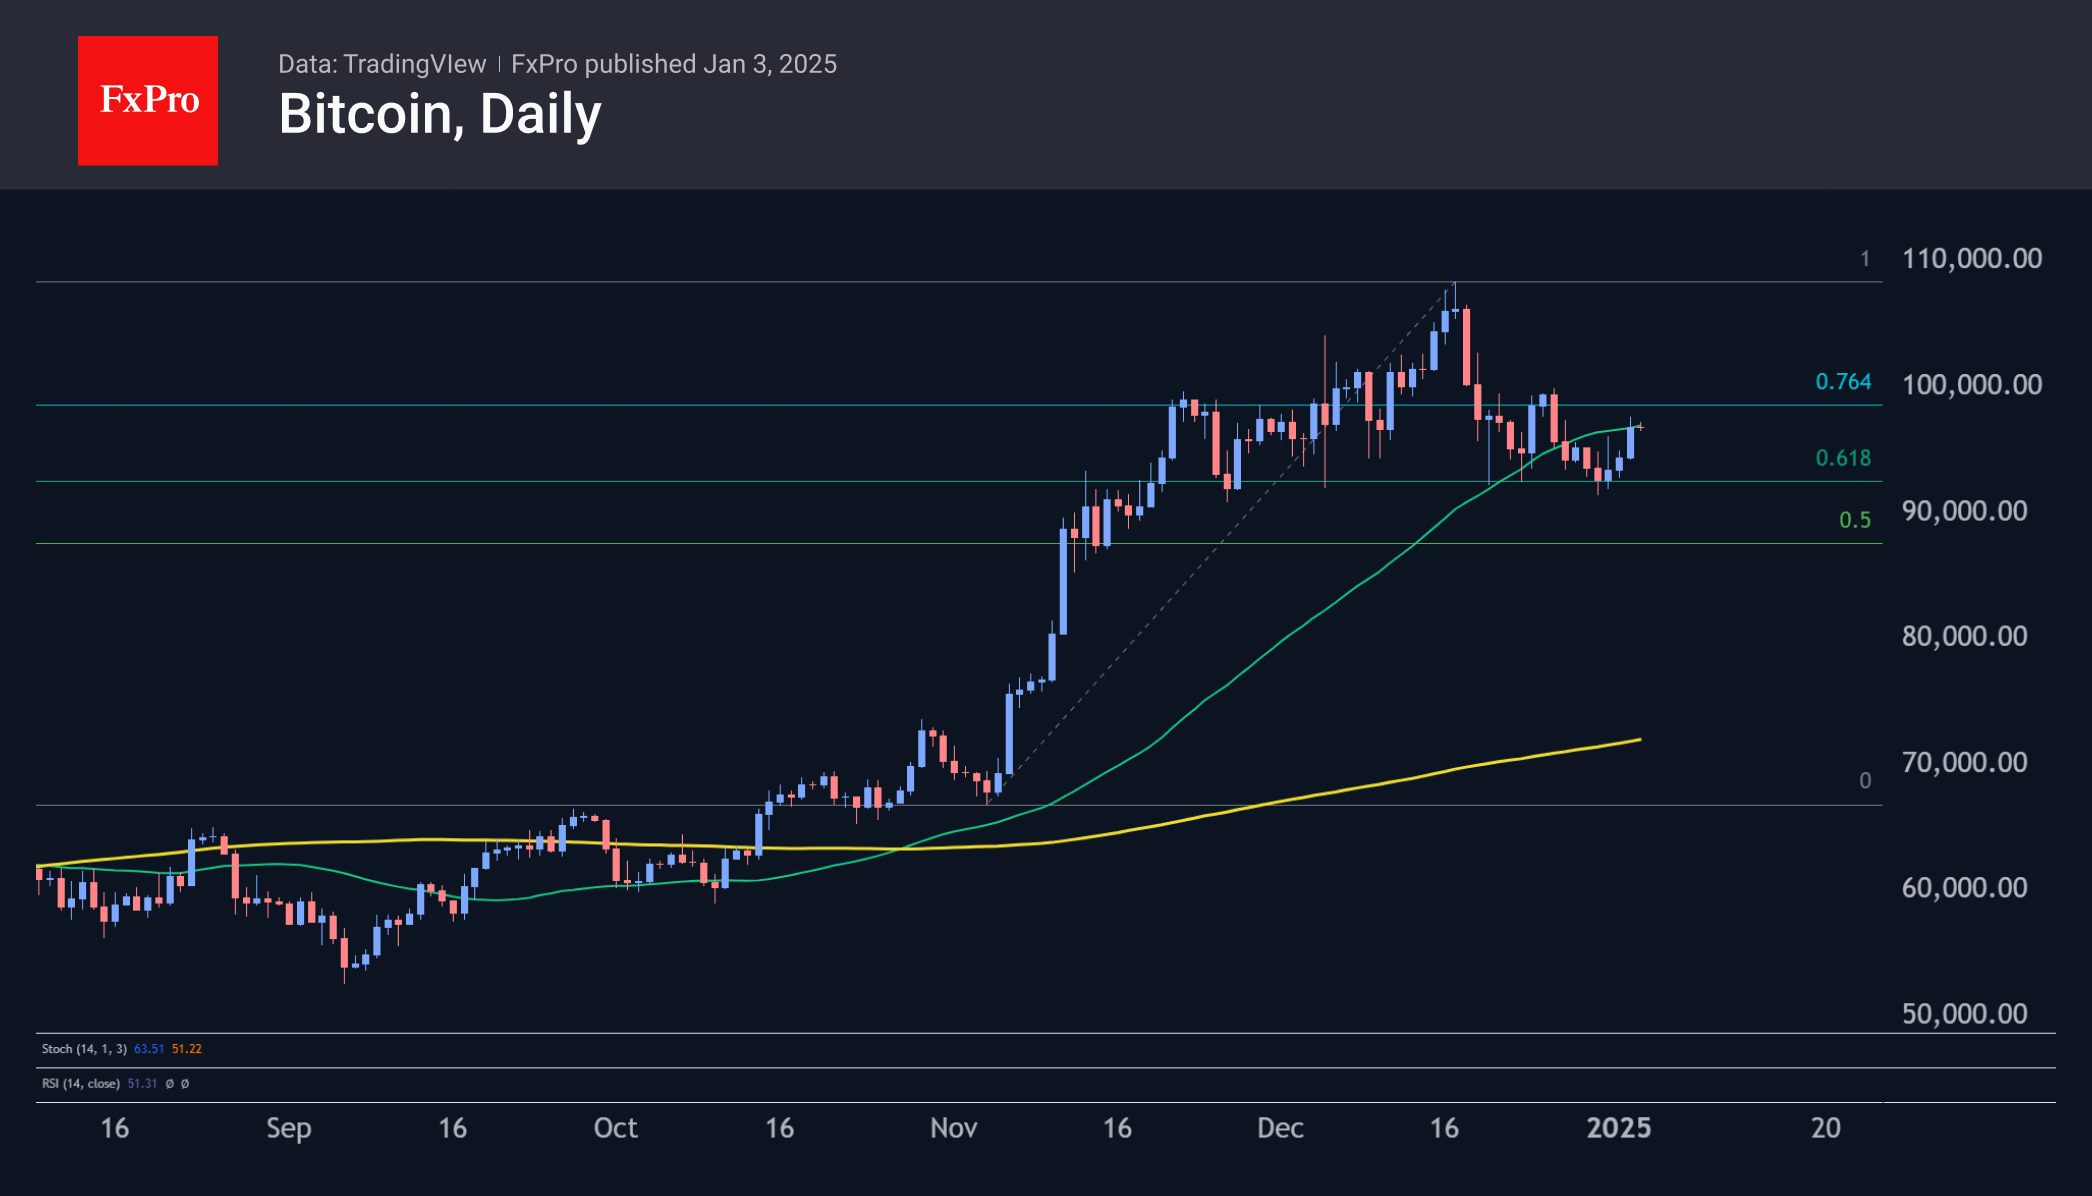
Bitcoin fell 3.5% to $93,600 in December. Growth for the full year of 2024 was 120% after 158% a year earlier. The first cryptocurrency has strengthened for seven months in the past year, becoming one of the year’s best-performing assets.
In terms of seasonality, January is considered a relatively successful month for BTC. Over the past 14 years, bitcoin has ended the month with growth on seven occasions. The average rise was 22.5%, while the average decline was 14.6%.
Technically, bitcoin has bounced off the 61.8% level from the November rally and is attempting to return above the 50-day moving average. A solid break above $97,000 will allow us to expect new highs above $110,000 soon. However, we should be prepared for a strengthening of selling, as we are currently seeing in equities.
News Background
IntoTheBlock notes that through 2024, the number of long-term Ethereum holders has been rising, while Bitcoin’s metric has been steadily declining. The percentage holding ETH for more than a year increased from 59% in January to 75% in December. For BTC, the metric dropped from around 70% to 62%.
Another recalculation increased the first cryptocurrency’s mining difficulty by 1.08%, reaching a record of 109.78 T. The average hash rate for the period since the previous change was 777 EH/s.
MicroStrategy purchased an additional 2,138 BTC for ~$209 million over the past week at an average price of around $97.837 per coin. The company holds 446,400 BTC purchased for a combined $27.9bn at an average price of $62,428 per coin.
CoinGecko calculated the profitability of crypto market sectors in 2024. The most profitable narrative of the crypto industry was AI. Second and third place went to meme coins and RWAs.
CryptoQuant notes that Coinbase’s premium has reached a 12-month low. This signals insufficient institutional demand and caution among US investors.
GBP/JPY Daily Outlook
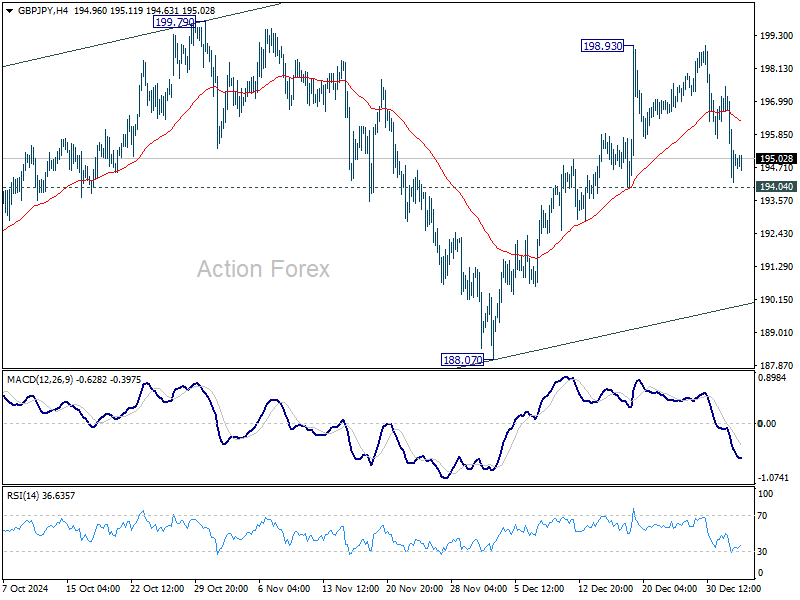
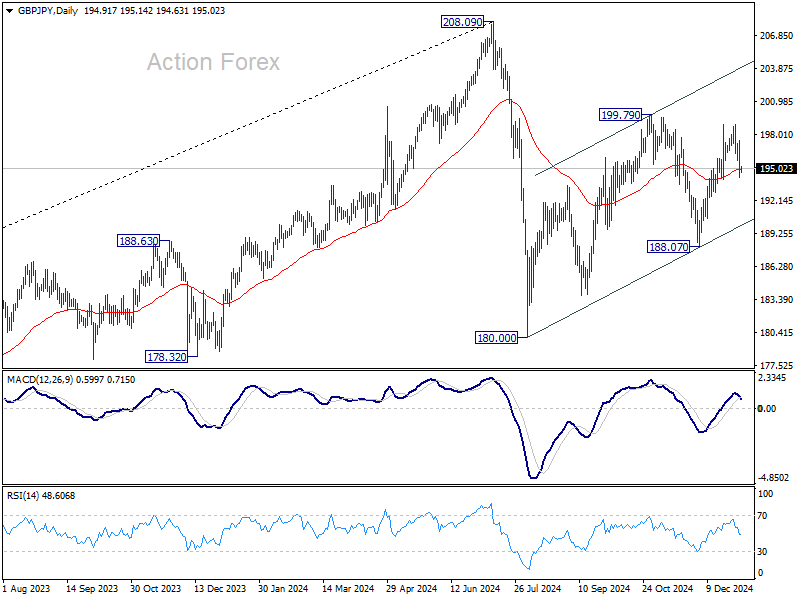
Daily Pivots: (S1) 193.63; (P) 195.58; (R1) 196.97; More...
Intraday bias in GBP/JPY remains neutral for the moment. Further rise is still in favor with 194.04 minor support intact. Corrective pattern from 180.00 is extending with another rising leg. On the upside, above 1999.79 will will target channel resistance (now at 203.90). However, firm break of 194.04 will turn bias to the downside fro 188.07 support instead.
In the bigger picture, price actions from 208.09 are seen as a correction to whole rally from 123.94 (2020 low). The range of consolidation should be set between 38.2% retracement of 123.94 to 208.09 at 175.94 and 208.09. However, decisive break of 175.94 will argue that deeper correction is underway.
EUR/JPY Daily Outlook
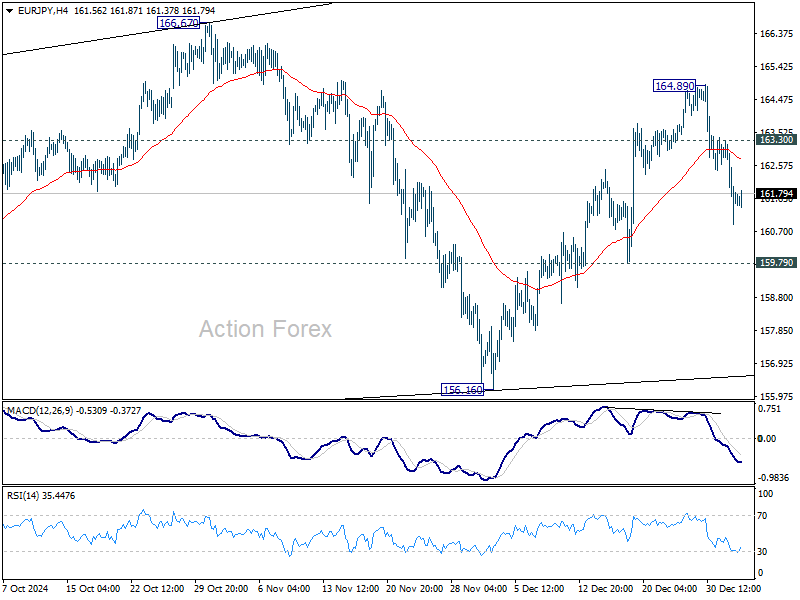
Daily Pivots: (S1) 160.65; (P) 161.98; (R1) 163.06; More...
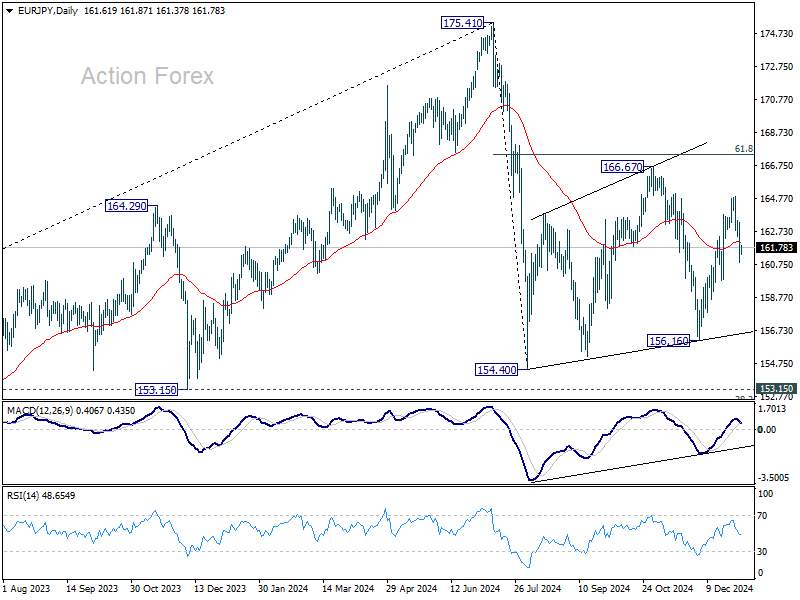
Intraday bias in EUR/JPY remains neutral for the moment. Some more consolidations could be seen, but another rally is mildly in favor as long as 159.79 support holds. Above 163.30 minor resistance will turn bias back to the upside. Rise from 156.16 is seen as a rising leg in the corrective pattern from 154.04. Break of 164.89 will target 166.67 resistance next.
In the bigger picture, price actions from 175.41 are seen as correction to rally from 114.42 (2020 low). The range of consolidation should have been set between 38.2% retracement of 114.42 to 175.41 at 152.11 and 175.41 high. However, decisive break of 152.11 would argue that deeper correction is underway.
EUR/GBP Daily Outlook
Daily Pivots: (S1) 0.8263; (P) 0.8295; (R1) 0.8324; More...
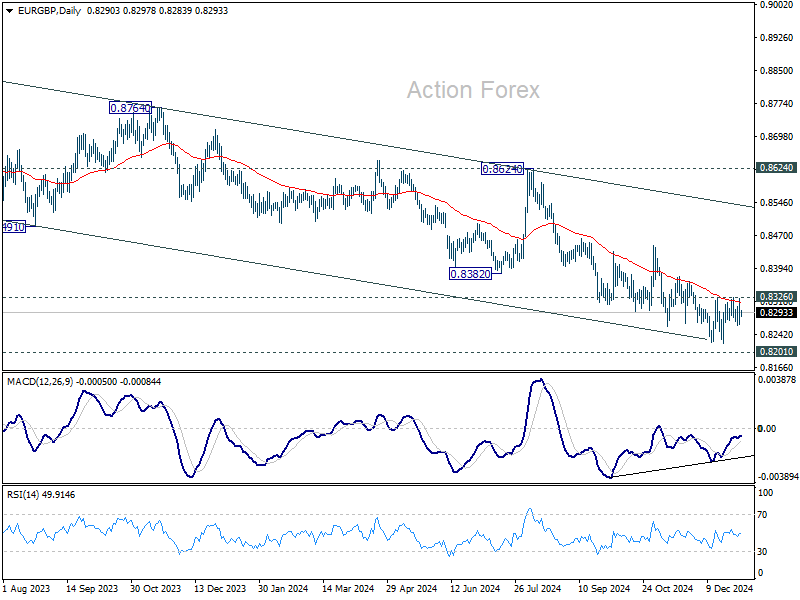
No change in EUR/GBP's outlook as range trading continues. Intraday bias remains neutral for the moment. On the upside, firm break of 0.8326 resistance will confirm short term bottoming at 0.8221, ahead of 0.8201 key support. Intraday bias will be turned back to the upside for 0.8446 structural resistance next.
href="https://www.actionforex.com/wp-content/uploads/2025/01/eurgbp20250103a1.png">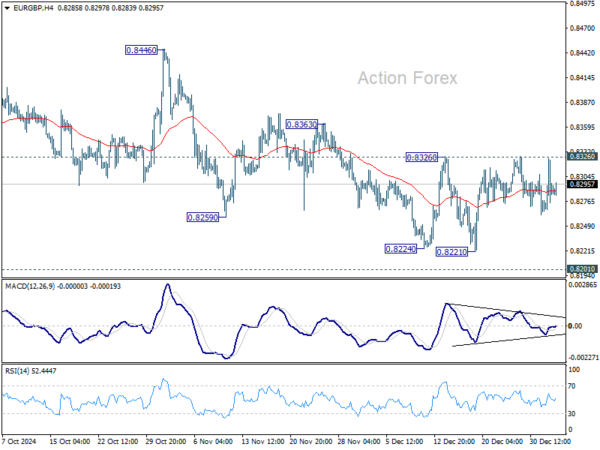
In the bigger picture, focus is now on whether 0.8201 key support (2022 low) is strong enough to complete the whole down trend from 0.9267 (2022 high). In any case, medium term outlook will be neutral at best until decisive break of 0.8624 key resistance. Otherwise, risk will stay on the downside even in case of strong rebound.
EUR/AUD Daily Outlook
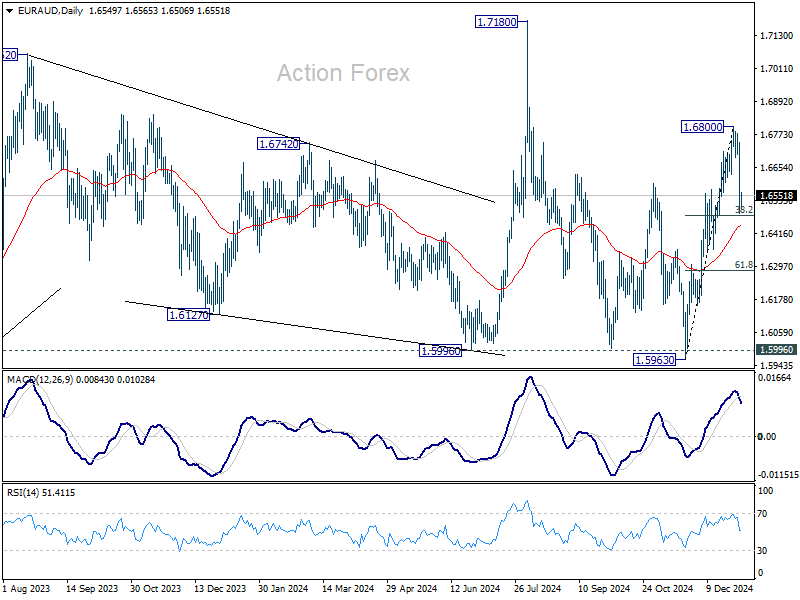
Daily Pivots: (S1) 1.6441; (P) 1.6600; (R1) 1.6710; More...
EUR/AUD's pull back from 1.6800 extended lower today and intraday bias is now on the downside. Firm break of 38.2% retracement of 1.5963 to 1.6800 at 1.6480 will bring deeper fall to 61.8% retracement at 1.6283. For now, risk will stay mildly on the downside as long as 1.6800 resistance holds, in case of recovery.
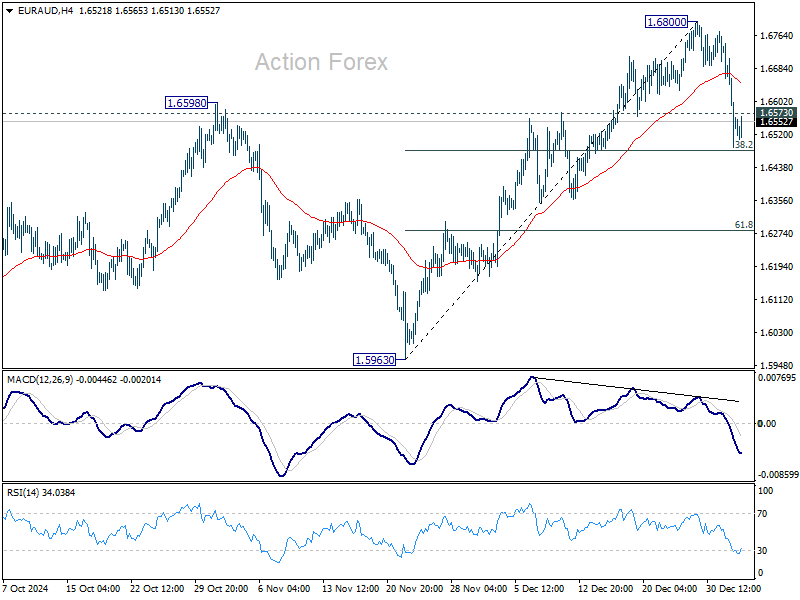
In the bigger picture, EUR/AUD is holding on to 1.5996 key support despite brief breach. Larger up trend from 1.4281 (2022 low) is still in favor to resume through 1.7180 at a later stage. Nevertheless, sustained break of 1.5995 will indicate that such up trend has completed and deeper decline would be seen.
EUR/CHF Daily Outlook
Daily Pivots: (S1) 0.9333; (P) 0.9365; (R1) 0.9401; More....
Intraday bias in EUR/CHF is back on the downside with break of 0.9359 minor support. Deeper fall should be seen to 0.9284 support next. Rebound from 0.9204 is current seen as a corrective move. In case of another rise through 0.9440, strong resistance would be seen from 0.9481 fibonacci resistance to limit upside.
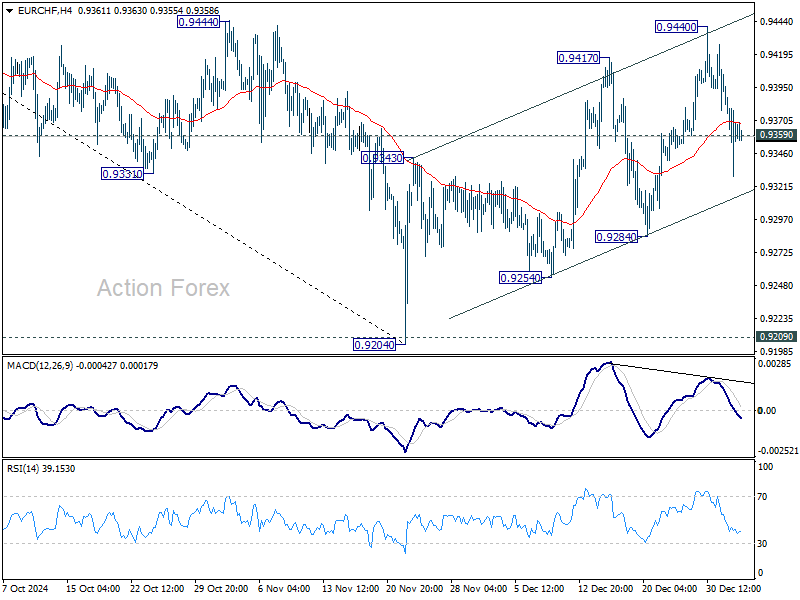
In the bigger picture, a medium term bottom is probably in place at 0.9204. More consolidations would be seen above there with risk of stronger rebound to 38.2% retracement of 0.9928 to 0.9204 at 0.9481. But outlook will remain bearish as long as 0.9481 holds and another fall through 0.9204 to resume larger down trend is in favor.

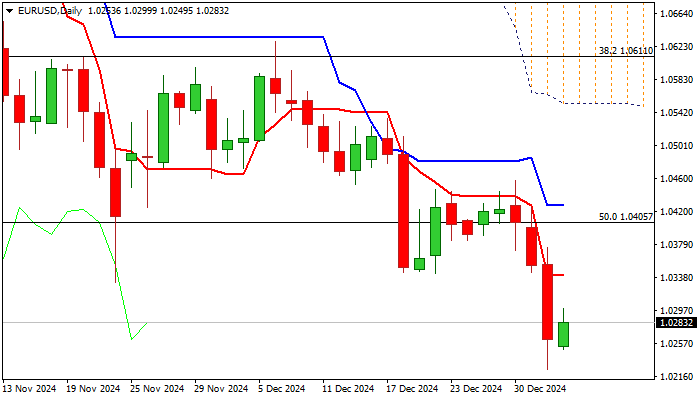
EUR/USD Started 2025 at Its Lowest Point in 25 Months
According to the EUR/USD chart, on 2nd January, the first trading day of the year, the EUR/USD pair fell below the psychological level of 1.025, the lowest mark since November 2022.
There are few news events, and the EUR/USD rate decline may be attributed to:
→ The holiday period still affecting financial markets, reducing liquidity and creating vulnerabilities for volatility spikes;
→ Market participants potentially rebalancing their portfolios for the new calendar year;
→ Reassessing the strength of the dollar amid uncertainty about the actual steps of President-elect Trump, whose inauguration is scheduled for this month.
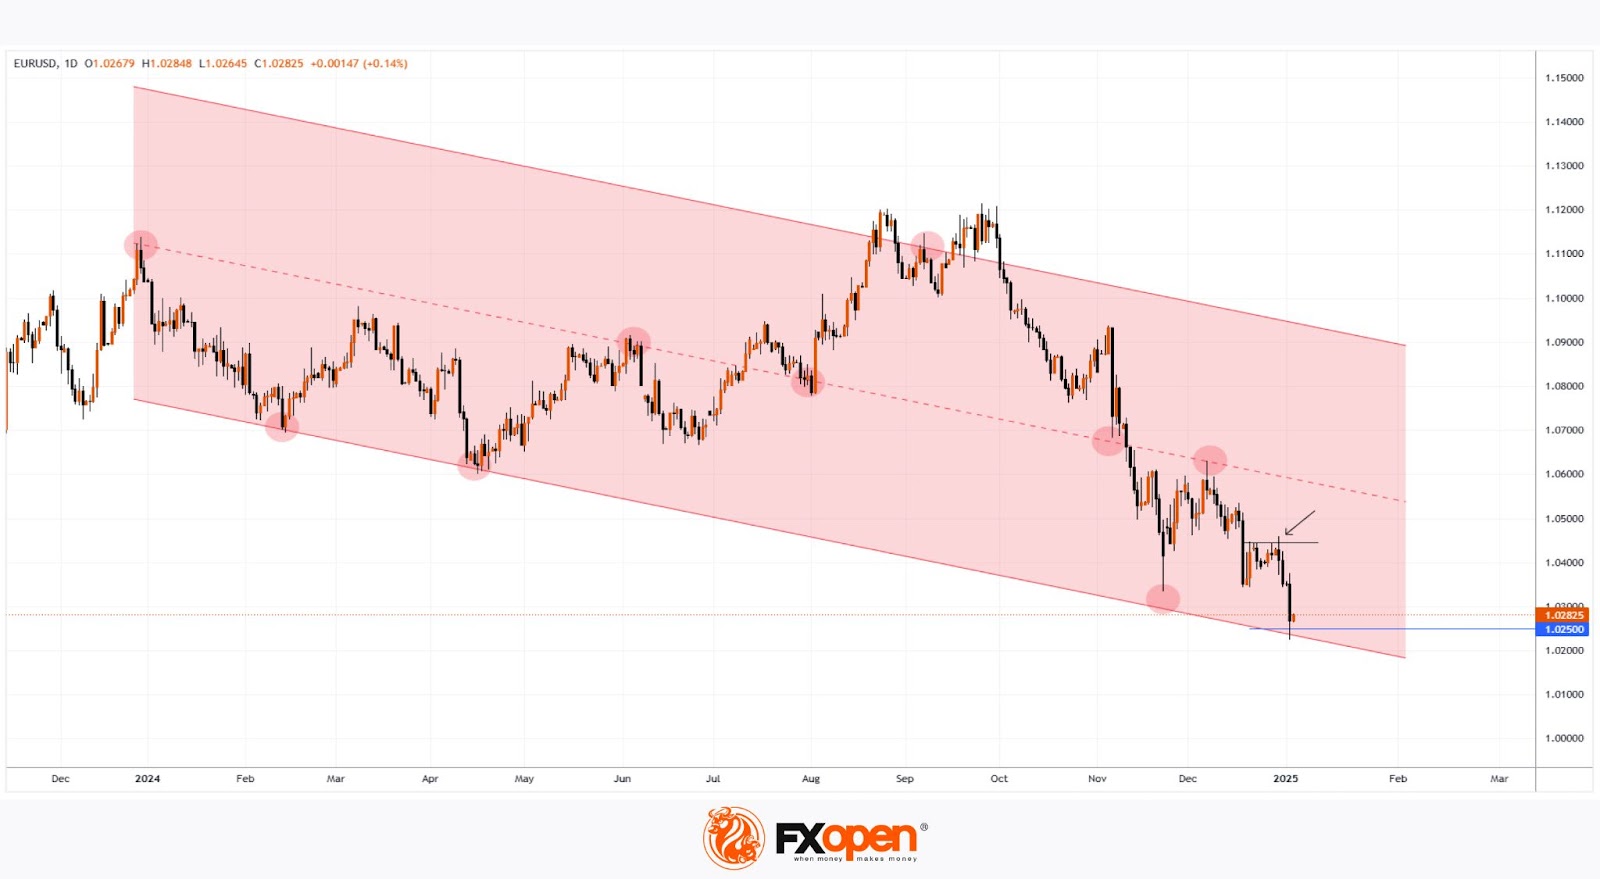
Meanwhile, technical analysis of the EUR/USD chart reveals that:
→ In 2024, price fluctuations formed a downward channel, with key pivot points marked by red circles. Notably, the previous holiday period led to the formation of the first of these points.
→ The bullish "Cup and Handle" pattern, which we discussed on 30th December, resulted in a false bullish breakout (indicated by an arrow). Seizing the bulls' failure, the bears pushed the price to the lower boundary of the mentioned channel.
The area where the lower boundary of the channel intersects the psychological level of 1.025 could serve as strong support. The recovery observed on the morning of 3rd January may confirm this.
The holiday period may lead to the formation of a new key pivot point on the EUR/USD chart, as has happened before.
Trade over 50 forex markets 24 hours a day with FXOpen. Take advantage of low commissions, deep liquidity, and spreads from 0.0 pips. Open your FXOpen account now or learn more about trading forex with FXOpen.
This article represents the opinion of the Companies operating under the FXOpen brand only. It is not to be construed as an offer, solicitation, or recommendation with respect to products and services provided by the Companies operating under the FXOpen brand, nor is it to be considered financial advice.
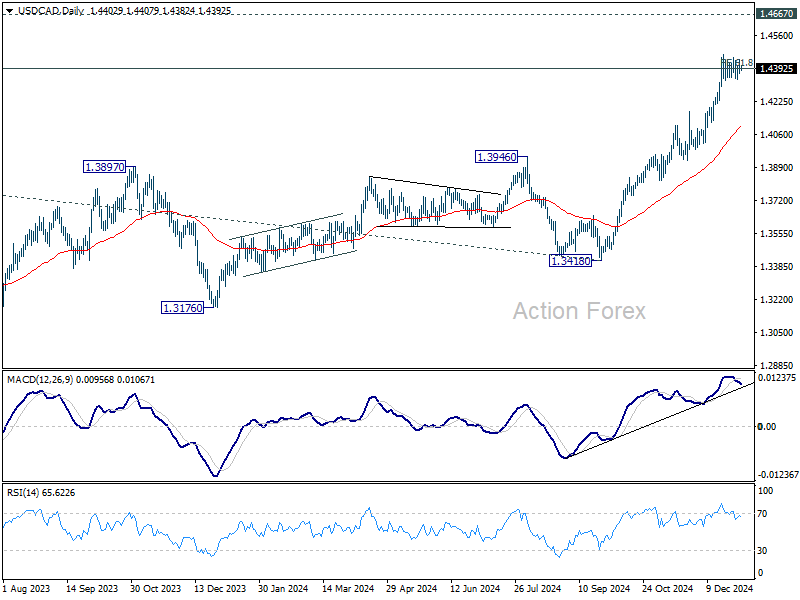
USD/CAD Daily Outlook
Daily Pivots: (S1) 1.4367; (P) 1.4405; (R1) 1.4440; More...
USD/CAD is staying in consolidations below 1.4466 and intraday bias remains neutral. Another retreat cannot be ruled out, but outlook will stay bullish as long as 1.4177 resistance turned support holds. On the upside, break of 1.4466 and sustained trading above 1.4391 will pave the way to retest 1.4667/89 long term resistance zone.
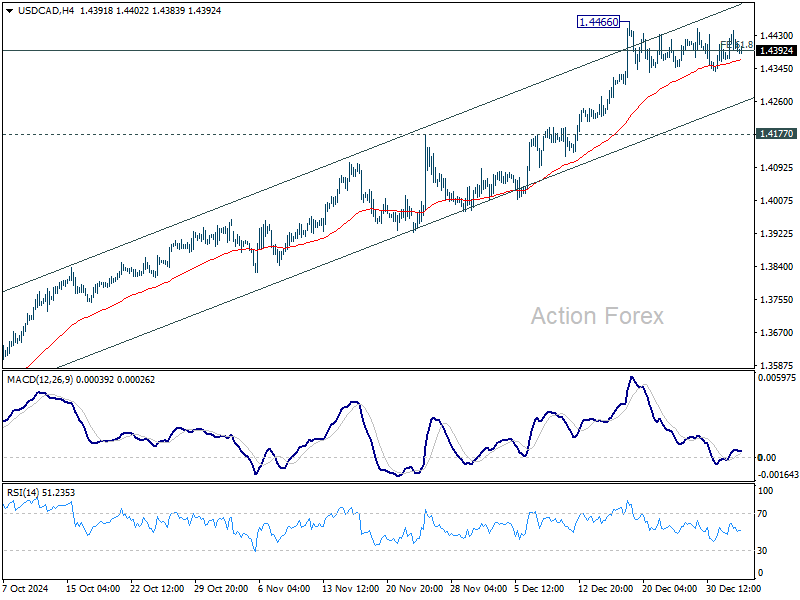
In the bigger picture, up trend from 1.2005 (2021) is in progress and met 61.8% projection of 1.2401 to 1.3976 from 1.3418 at 1.4391 already. Sustained trading above there will pave the way to 1.4667/89 key resistance zone (2020/2015 highs). Medium term outlook will remain bullish as long as 1.3976 resistance turned holds, even in case of deep pullback.