Sample Category Title
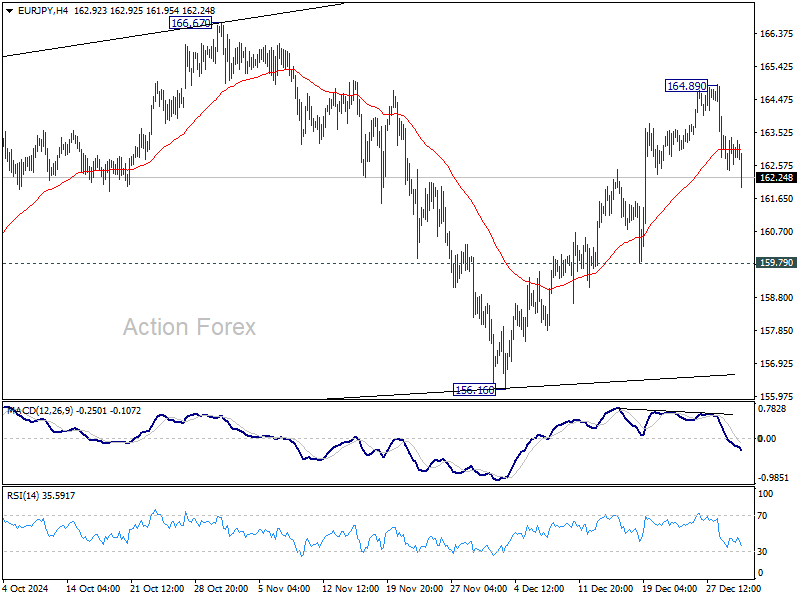
EUR/JPY Daily Outlook
Daily Pivots: (S1) 162.26; (P) 163.58; (R1) 164.39; More...
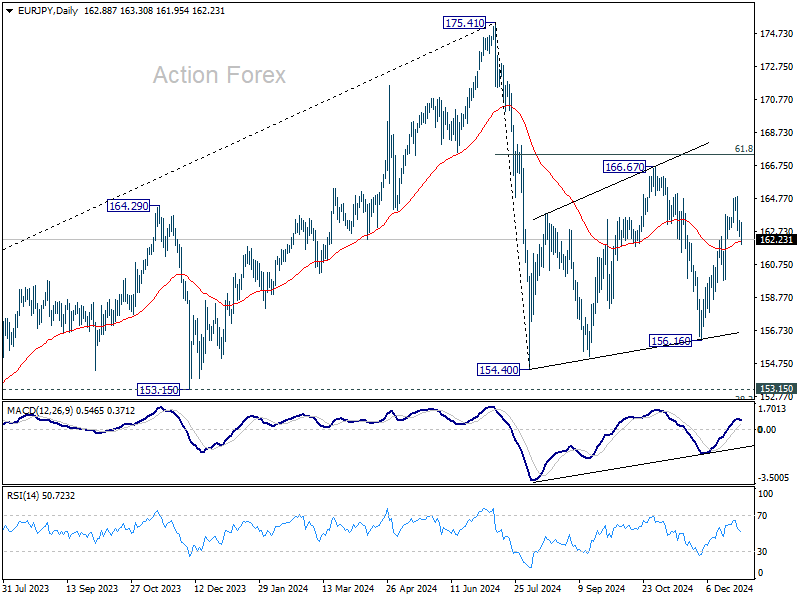
Intraday bias in EUR/JPY is turned neutral first with current retreat. Some consolidations would be seen, but another rise is mildly in favor as long as 159.79 support holds. Rise from 156.16 is seen as another rising leg in the corrective pattern from 154.04. Above 164.89 will target 166.67 resistance next.
In the bigger picture, price actions from 175.41 are seen as correction to rally from 114.42 (2020 low). The range of consolidation should have been set between 38.2% retracement of 114.42 to 175.41 at 152.11 and 175.41 high. However, decisive break of 152.11 would argue that deeper correction is underway.
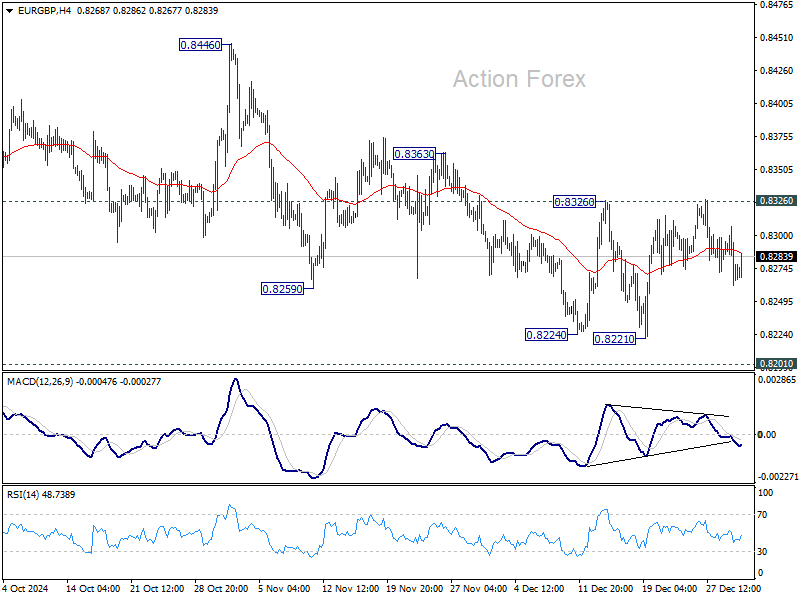
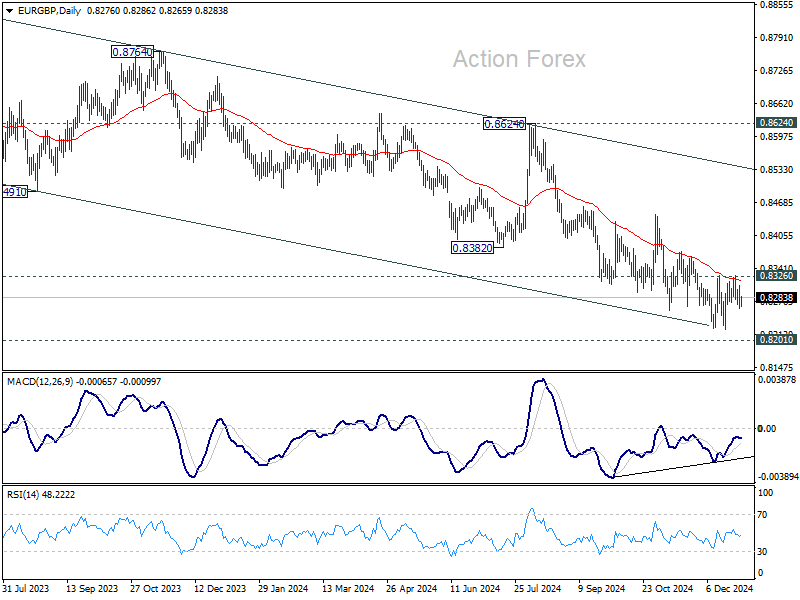
EUR/GBP Daily Outlook
Daily Pivots: (S1) 0.8264; (P) 0.8284; (R1) 0.8298; More...
EUR/GBP is still bounded in range of 0.8221/8326 and intraday bias stays neutral. On the upside, firm break of 0.8326 resistance will confirm short term bottoming at 0.8221, ahead of 0.8201 key support. Intraday bias will be turned back to the upside for 0.8446 structural resistance next.
In the bigger picture, focus is now on whether 0.8201 key support (2022 low) is strong enough to complete the whole down trend from 0.9267 (2022 high). In any case, medium term outlook will be neutral at best until decisive break of 0.8624 key resistance. Otherwise, risk will stay on the downside even in case of strong rebound.
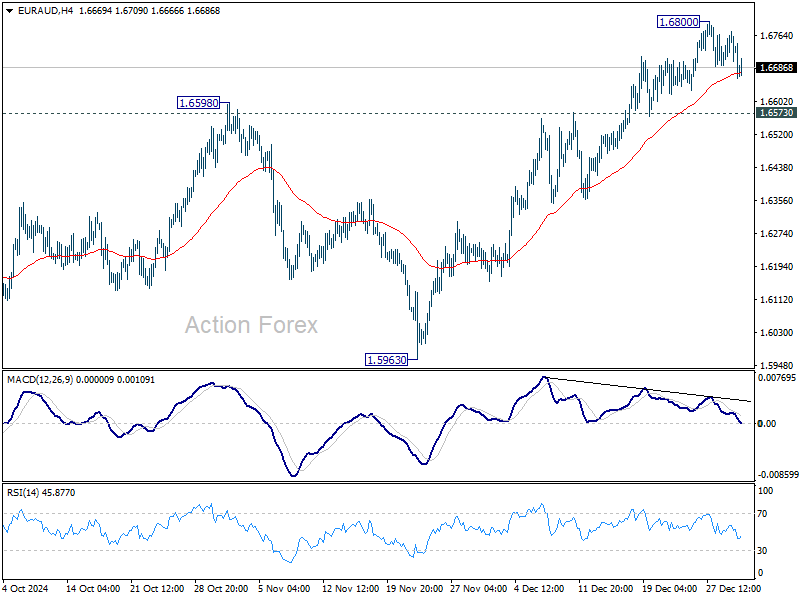
EUR/AUD Daily Outlook
Daily Pivots: (S1) 1.6695; (P) 1.6733; (R1) 1.6774; More...
Intraday bias in EUR/AUD remains neutral and some more consolidations would be seen below 1.6800. Outlook will stay bullish as long as 1.6573 resistance turned support holds. Above 1.6800 will resume the rally from 1.5963 to retest 1.7180 high next. However, considering bearish divergence condition in 4H MACD, firm break of 1.6573 will confirm short term topping, and turn bias back to the downside instead.
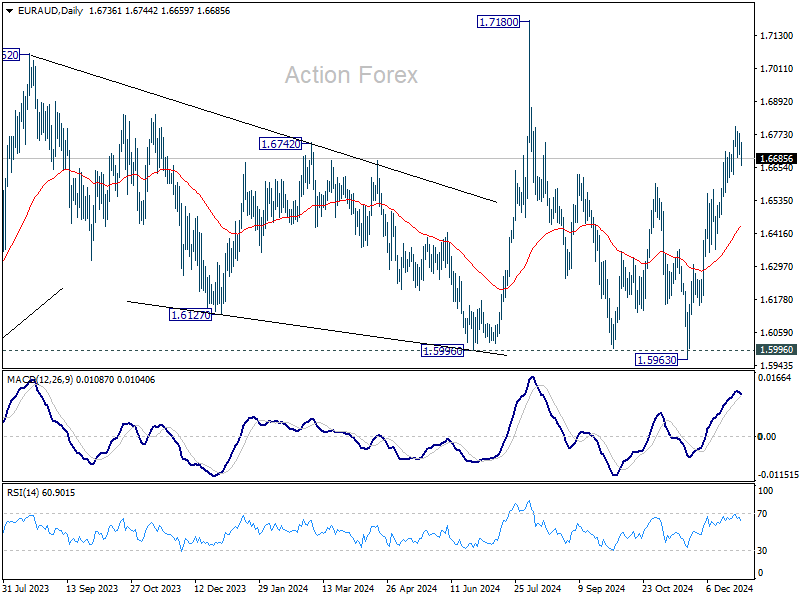
In the bigger picture, EUR/AUD is holding on to 1.5996 key support despite brief breach. Larger up trend from 1.4281 (2022 low) is still in favor to resume through 1.7180 at a later stage. Nevertheless, sustained break of 1.5995 will indicate that such up trend has completed and deeper decline would be seen.
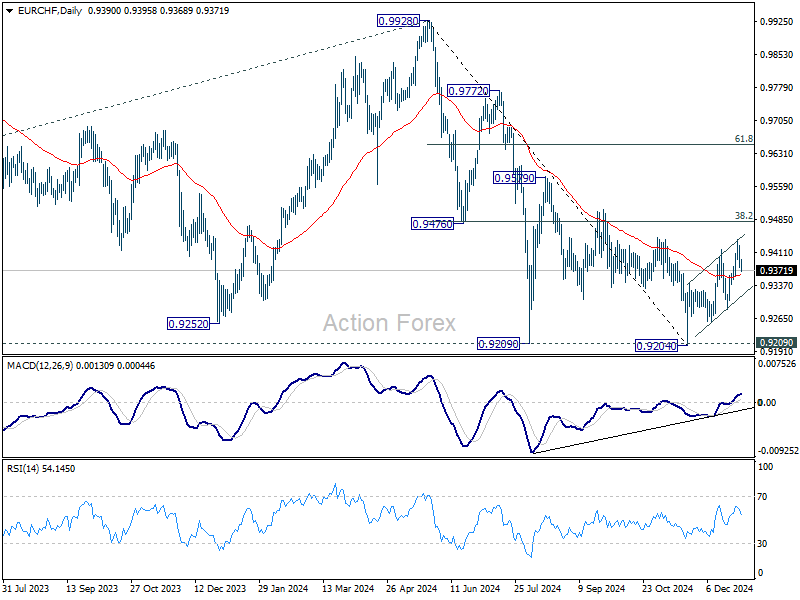
EUR/CHF Daily Outlook
Daily Pivots: (S1) 0.9378; (P) 0.9412; (R1) 0.9440; More....
EUR/CHF retreated notably after rising to 0.9440 and intraday bias is turned neutral first. On the upside, break of 0.9440 will resume the corrective rebound from 0.9204 to 0.9481 fibonacci resistance next. On the downside, below 0.9359 minor support will turn intraday bias back to the downside for 0.9284 support instead.
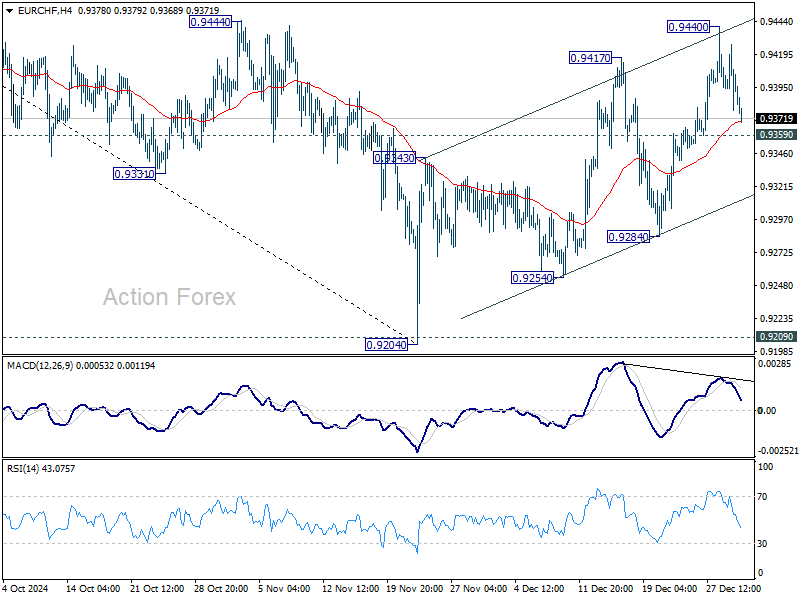
In the bigger picture, a medium term bottom is probably in place at 0.9204. More consolidations would be seen above there with risk of stronger rebound to 38.2% retracement of 0.9928 to 0.9204 at 0.9481. But outlook will remain bearish as long as 0.9481 holds and another fall through 0.9204 to resume larger down trend is in favor.
EUR/USD Daily Outlook
Daily Pivots: (S1) 1.0321; (P) 1.0389; (R1) 1.0429; More...
EUR/USD's sideway trading continues above 1.0330 and intraday bias remains neutral. Stronger recovery cannot be ruled out, but outlook will remain bearish as long as 1.0629 resistance holds. Firm break of 1.0330 will confirm resumption of whole decline from 1.1213. Sustained trading below 1.0404 fibonacci level will carry larger bearish implications.
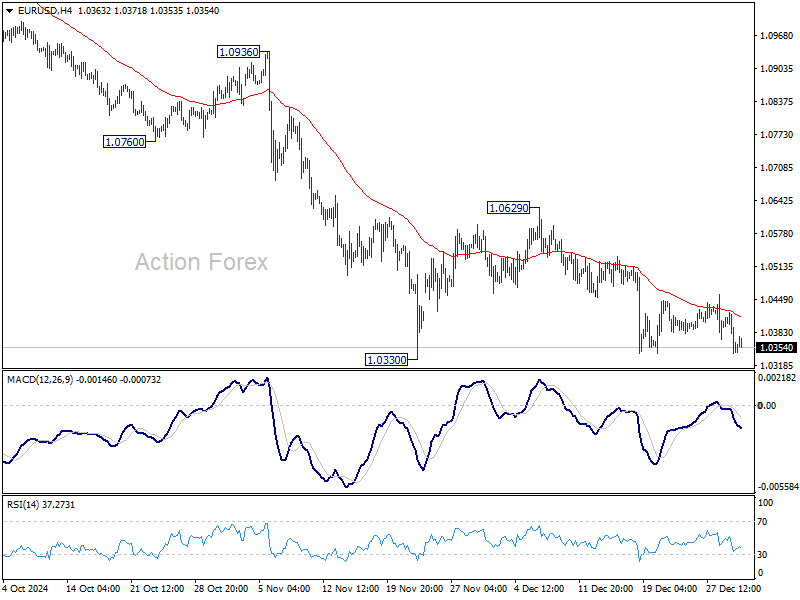
In the bigger picture, focus stays on 50% retracement of 0.9534 (2022 low) to 1.1274 at 1.0404. Strong rebound from this level will keep price actions from 1.1273 (2023 high) as a medium term consolidation pattern only. However, sustained break of 1.0404 will raise the chance that whole up trend from 0.9534 has reversed. That would pave the way to 61.8% retracement at 1.0199 first. Firm break there will target 0.9534 low again.
GBP/USD Daily Outlook
Daily Pivots: (S1) 1.2481; (P) 1.2545; (R1) 1.2582; More...
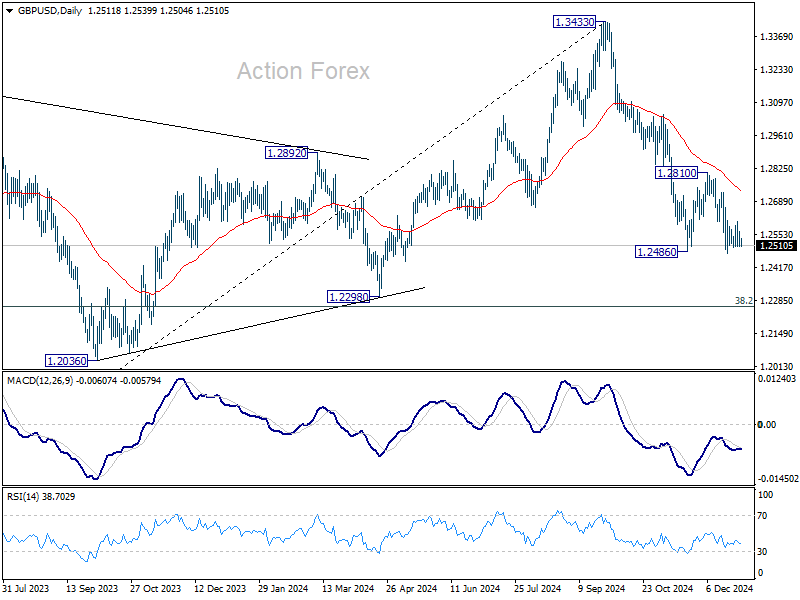
GBP/USD is staying in sideway trading and intraday bias remains neutral. While another recovery cannot be ruled out, outlook will stay bearish as long as 1.2810 resistance holds. On the downside, break of 1.2474 will resume the fall from 1.3433 to 1.2298 cluster support zone.
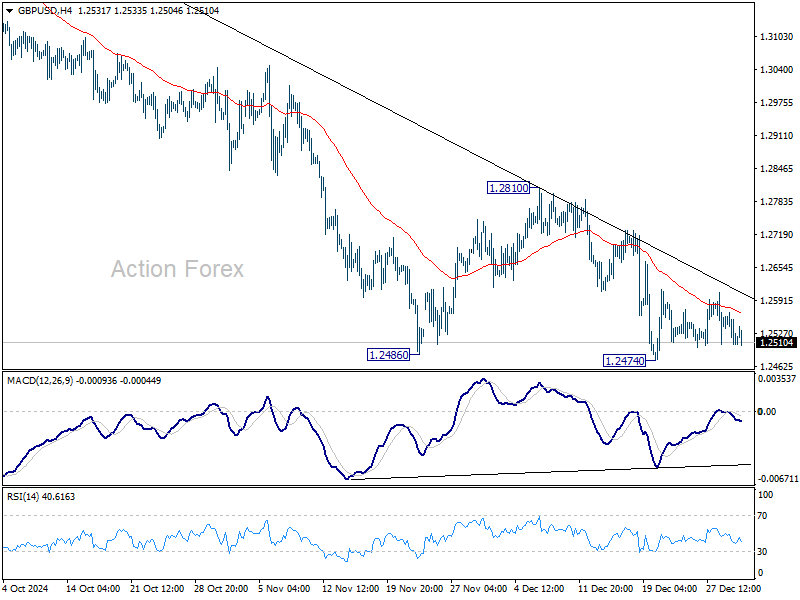
In the bigger picture, price actions from 1.3433 medium term are seen as correcting whole up trend from 1.0351 (2022 low). Deeper decline could be seen to 38.2% retracement of 1.0351 to 1.3433 at 1.2256, which is close to 1.2298 structural support. But strong support is expected there to bring rebound to extend the corrective pattern.
USD/CHF Daily Outlook
Daily Pivots: (S1) 0.9024; (P) 0.9052; (R1) 0.9095; More…
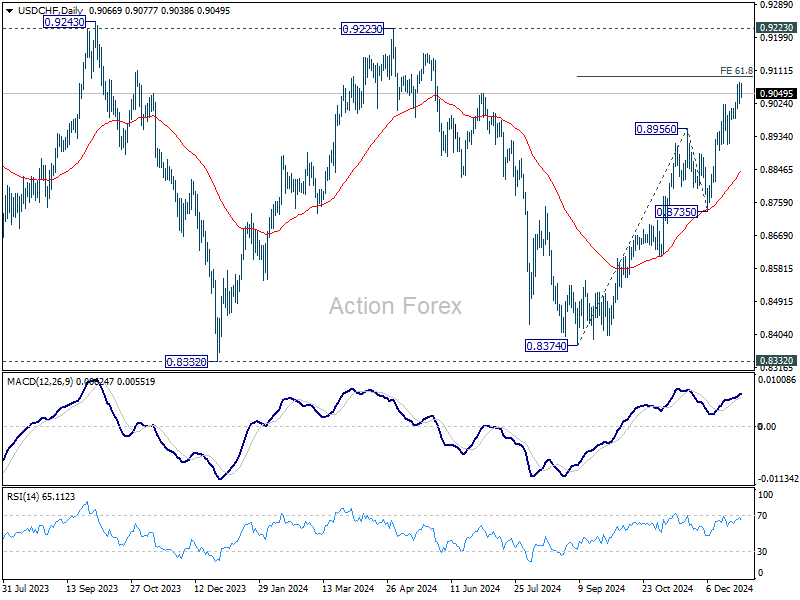
Intraday bias in USD/CHF stays mildly on the upside, as rise from 0.8374 is in progress for 61.8% projection of 0.8374 to 0.8956 from 0.8735 at 0.9095. Firm break there will pave the way to 0.9223 ley resistance next. Nevertheless, considering bearish divergence condition in 4H MACD, break of 0.8983 minor support will indicate short term topping, and turn bias back to the downside for deeper pull back.
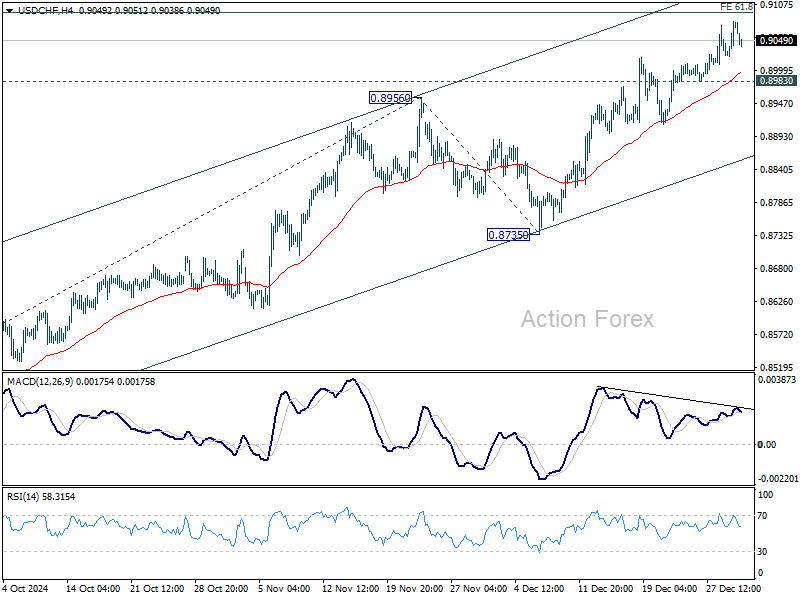
In the bigger picture, price actions from 0.8332 (2023 low) are currently seen as a medium term corrective pattern, with rise from 0.8374 as the third leg. Overall outlook will continue to stay bearish as long as 0.9223 resistance holds. Break of 0.8332 low is in favor at a later stage when the consolidation completes.
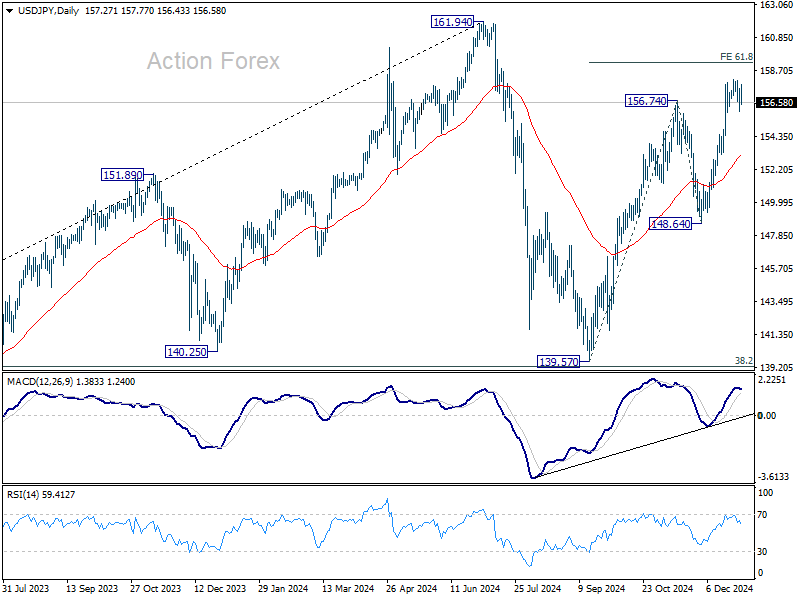
USD/JPY Daily Outlook
Daily Pivots: (S1) 156.70; (P) 157.38; (R1) 158.09; More...
Intraday bias in USD/JPY is turned neutral with current retreat, and some consolidations would be seen below 158.06 temporary top first. But outlook will stay bullish as long as 55 D EMA (now at 153.16) holds. On the upside, above 158.06 will resume the rally from 139.57 to 61.8% projection of 139.57 to 156.74 from 148.64 at 159.25. Firm break there will pave the way back to 161.94 high.
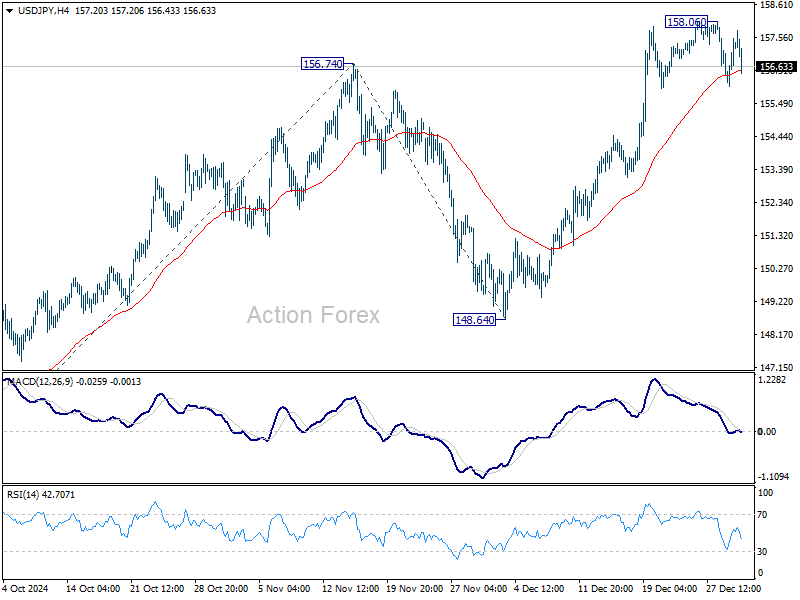
In the bigger picture, price actions from 161.94 are seen as a corrective pattern to rise from 102.58 (2021 low). The range of medium term consolidation should be set between 38.2% retracement of 102.58 to 161.94 at 139.26 and 161.94. Nevertheless, sustained break of 139.26 would open up deeper medium term decline to 61.8% retracement at 125.25.
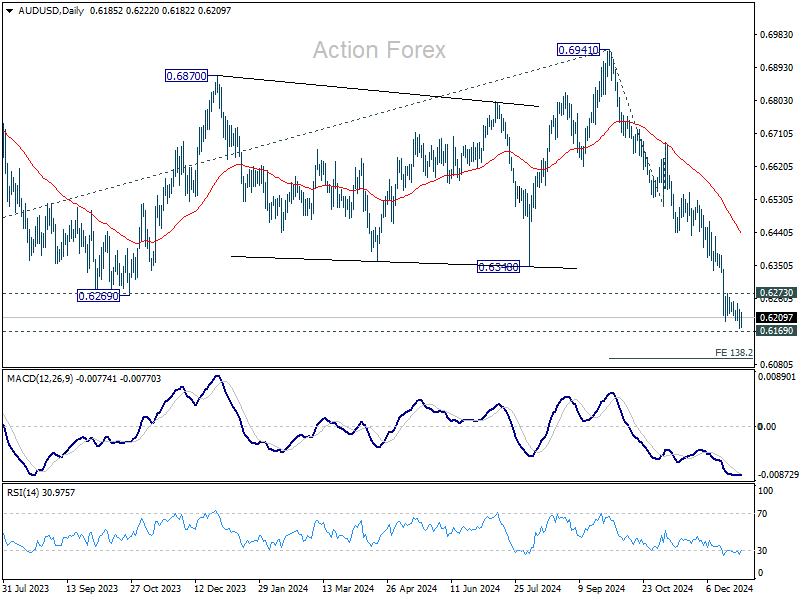
AUD/USD Daily Report
Daily Pivots: (S1) 0.6172; (P) 0.6209; (R1) 0.6229; More...
Intraday bias in AUD/USD is back on the downside with breach of 0.6198 support. Fall from 0.6941 is resuming for 0.6169 long term support, and then 138.2% projection of 0.6941 to 0.6511 from 0.6687 at 0.6074. However, considering bullish convergence condition in 4H MACD, break of 0.6273 resistance will indicate short term bottoming, and turn bias back to the upside for stronger rebound.
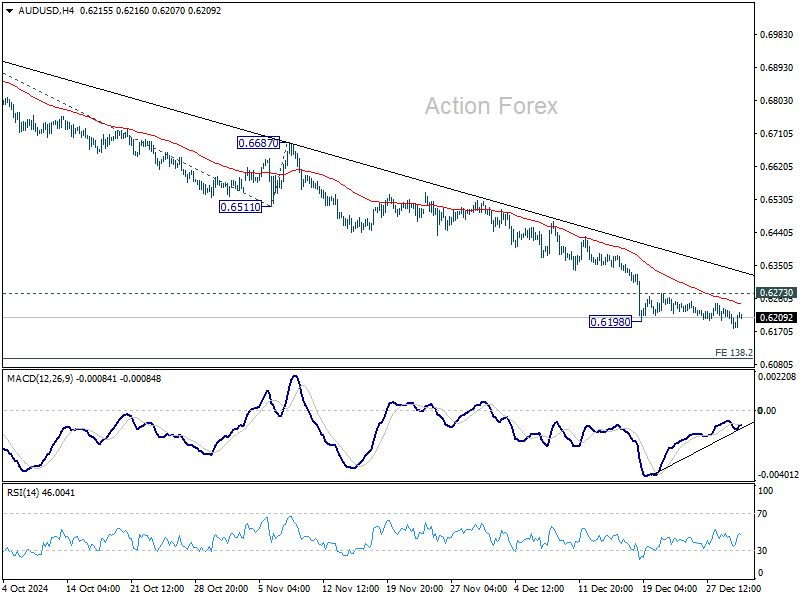
In the bigger picture, price actions from 0.6169 (2022 low) are seen as a medium term consolidation to the down trend from 0.8006. Firm break of 0.6169 support will confirm down trend resumption for 61.8% projection of 0.8006 to 0.6169 from 0.6941 at 0.5806 next. In any case, outlook will stay bearish as long as 55 W EMA (now at 0.6573) holds.
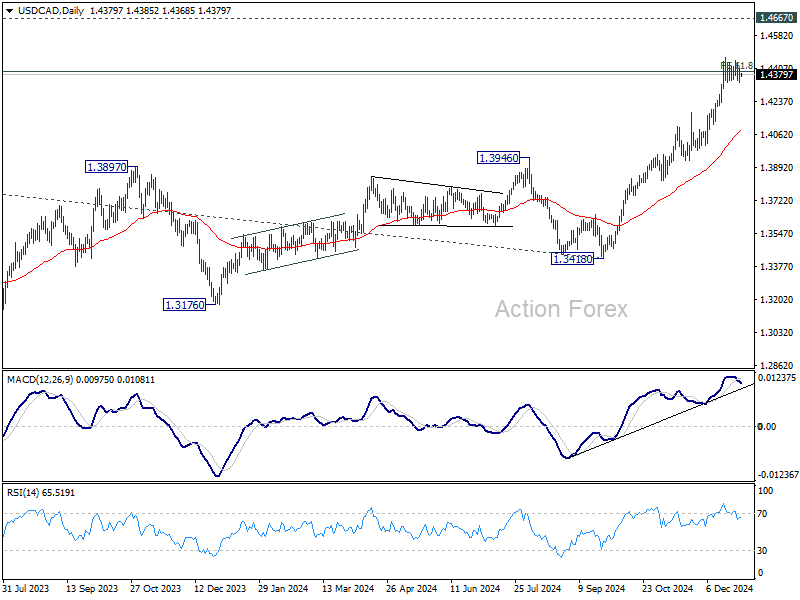
USD/CAD Daily Outlook
Daily Pivots: (S1) 1.4354; (P) 1.4394; (R1) 1.4442; More...+
Intraday bias in USD/CAD remains neutral as consolidations continue below 1.4466. Deeper pullback cannot be ruled out, but outlook will stay bullish as long as 1.4177 resistance turned support holds. On the upside, break of 1.4466 and sustained trading above 1.4391 will pave the way to retest 1.4667/89 long term resistance zone.
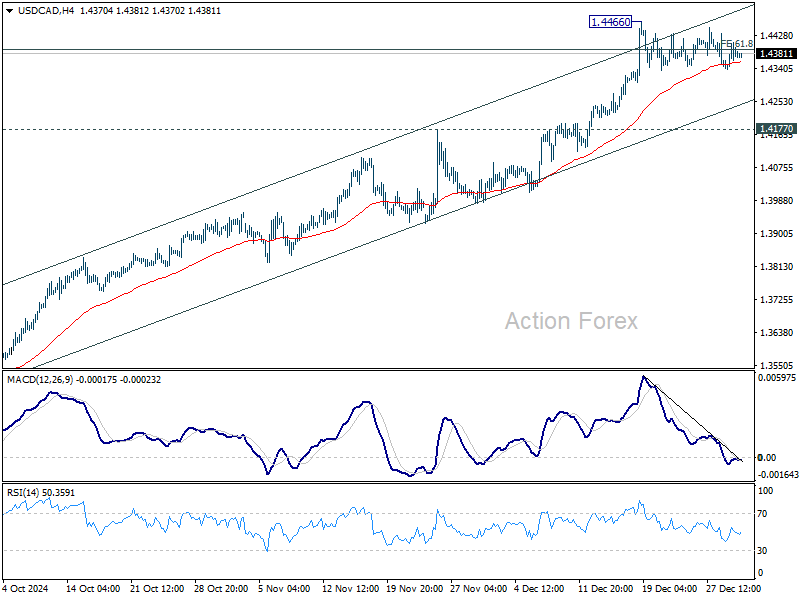
In the bigger picture, up trend from 1.2005 (2021) is in progress and met 61.8% projection of 1.2401 to 1.3976 from 1.3418 at 1.4391 already. Sustained trading above there will pave the way to 1.4667/89 key resistance zone (2020/2015 highs). Medium term outlook will remain bullish as long as 1.3976 resistance turned holds, even in case of deep pullback.