Sample Category Title
GBP/JPY Daily Outlook
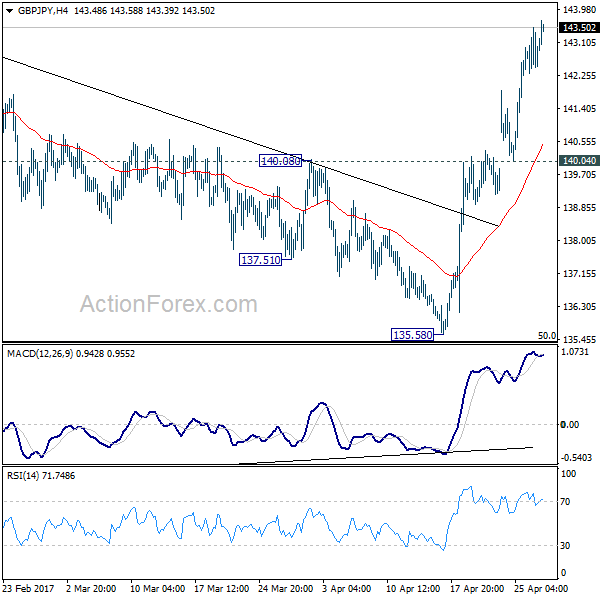
Daily Pivots: (S1) 142.15; (P) 142.83; (R1) 143.33; More....
GBP/JPY's rally is still in progress and intraday bias remains on the upside for 144.77 resistance. Consolidation pattern from 148.42 should have completed three waves down to 135.58, after hitting 135.39 fibonacci level. Break of 144.77 should extend whole rise from 122.36 through 148.42. On the downside, break of 140.04 support is needed to indicate short term topping. Otherwise, outlook will remain bullish in case of retreat.
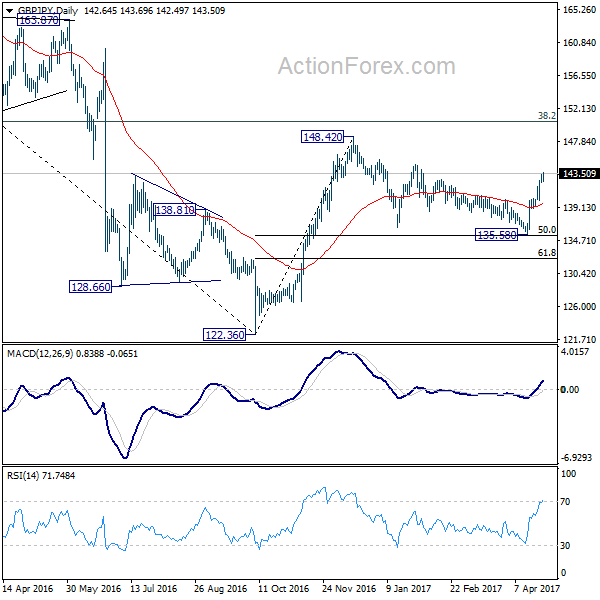
In the bigger picture, price actions from 122.36 medium term bottom are still seen as a corrective pattern. As long as 50% retracement of 122.36 to 148.42 at 135.39 holds, another rising leg would be seen to 38.2% retracement of 195.86 to 122.36 at 150.42 and possibly above. However, firm break of 135.39 will bring retest of 122.36, with prospect of resuming the larger down trend from 195.86.
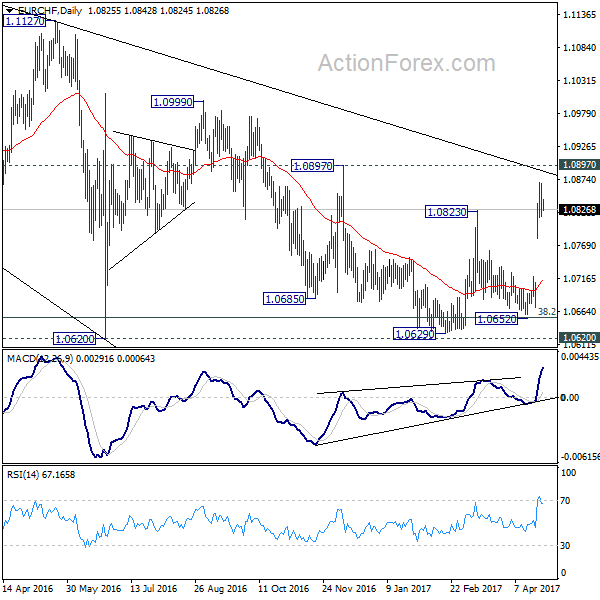
EUR/CHF Daily Outlook
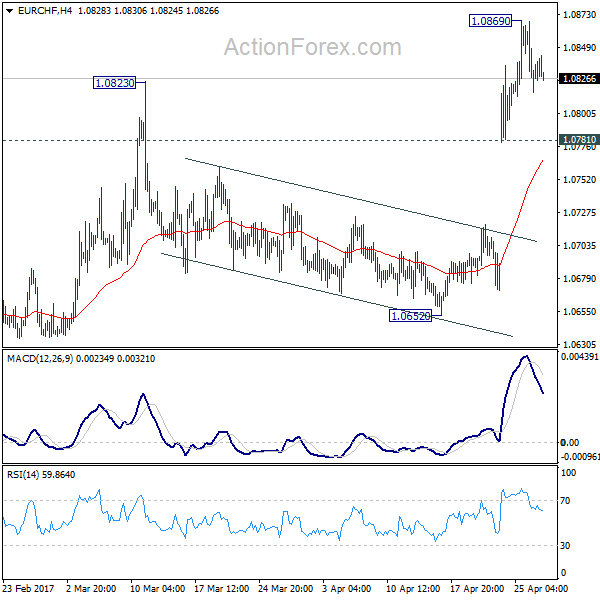
Daily Pivots: (S1) 1.0807; (P) 1.0838; (R1) 1.0860; More...
A temporary top is in place at 1.0869 and intraday bias in EUR/CHF is turned neutral for the moment. Some consolidations could be seen but downside should be contained by 1.0781 and bring another rise. Above 1.0869 will target 1.0897 resistance next. Break there will confirm trend reversal. Nonetheless, break of 1.0781 will bring deeper fall back towards 1.0652 support instead.
In the bigger picture, the price actions from 1.1198 are seen as a corrective move. Current strong rebound is raising the chance that it's completed after defending 38.2% retracement of 0.9771 to 1.1198 at 1.0653. Decisive break of 1.0823 resistance will affirm this bullish case. Further break of 1.0999 will target a test on 1.1198 high. For now, this will be the preferred case as long as 1.0652 support holds.
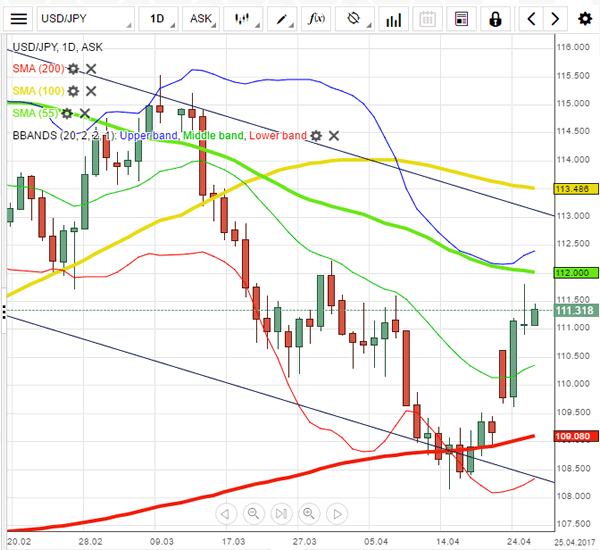
Technical Outlook: USDJPY – Fresh Bulls Probe Again Above Weekly Cloud Top
The pair remains bullish and returns above 111.00 handle on fresh strength, after Wednesday's spike to 111.76, on probe above strong barrier (weekly cloud top at 111.36). No significant impact from yesterday's Doji candle with long upper shadow is seen so far, as the pair is on fresh rally (underpinned by rising hourly cloud) for renewed attempts above weekly cloud and retest of yesterday's high, reinforced by weekly Tenkan-sen. Bullish setup of daily MA's and momentum studies are supportive for firm break and close above 111.36/78 pivots, to signal fresh extension higher and test of next key barrier at 112.18 (31 Mar high). Slow stochastic is overbought on daily chart but continues to head north, however, corrective action should be anticipated in the near-term. Wednesday's low at 110.85 marks solid support, followed by hourly cloud base at 110.54, with extended downticks expected to hold above psychological 110.00 support, reinforced by weekly Kijun-sen line.
Res: 111.41; 111.76; 112.18; 112.67
Sup: 111.00; 110.85; 110.54; 110.00
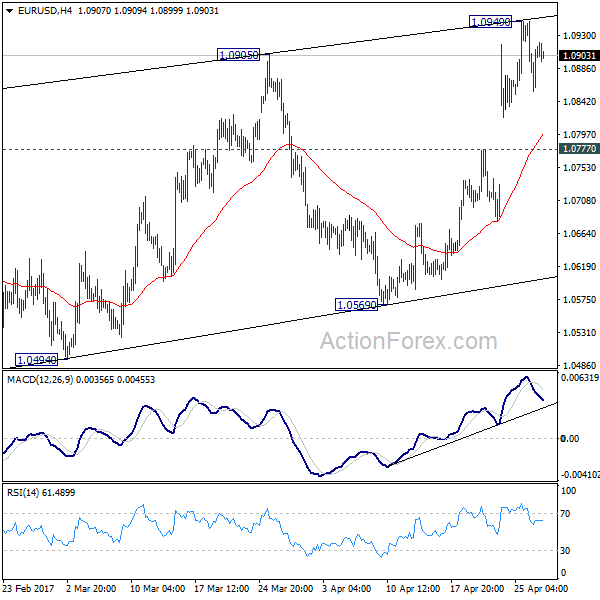
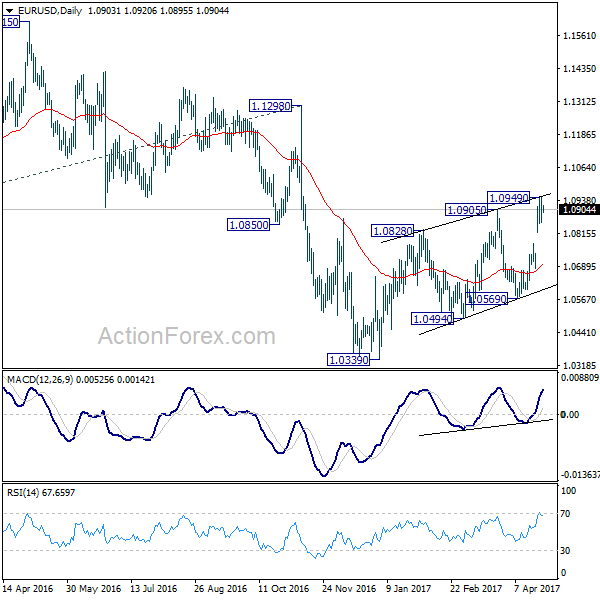
EUR/USD Daily Outlook
Daily Pivots: (S1) 1.0855; (P) 1.0903 (R1) 1.0950; More....
Intraday bias in EUR/USD remains neutral for consolidation below 1.0949 temporary top. At this point, another rise could be seen as long as 1.0777 support holds. But still, rise form 1.0339 is seen as a corrective move. Hence we'd pay attention to topping signal even if EUR/USD rises through 1.0949. On the downside, below 1.0777 minor support will turn bias to the downside for 1.0569 support first.
In the bigger picture, as long as 1.1298 key resistance holds, whole down trend from 1.6039 (2008 high) is still expected to continue. Break of 1.0339 low will send EUR/USD through parity to 61.8% projection of 1.3993 to 1.0461 from 1.1298 at 0.9115. However, considering bullish convergence condition in weekly MACD, break of 1.1298 will indicate term reversal. this would also be supported by sustained trading above 55 week EMA.
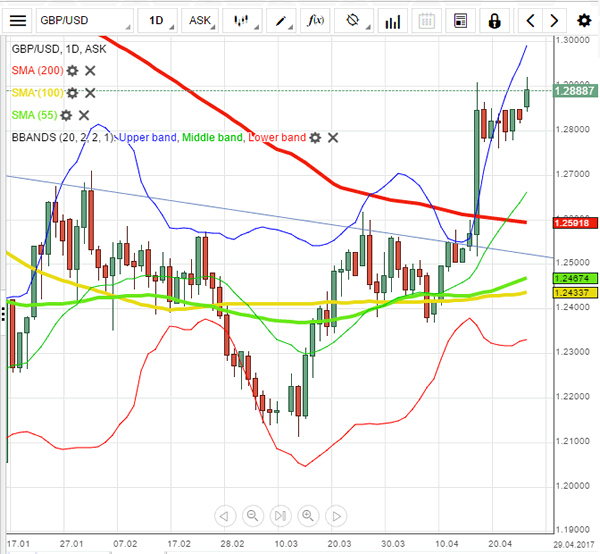
GBP/USD Daily Outlook
Daily Pivots: (S1) 1.2812; (P) 1.2838; (R1) 1.2871; More...
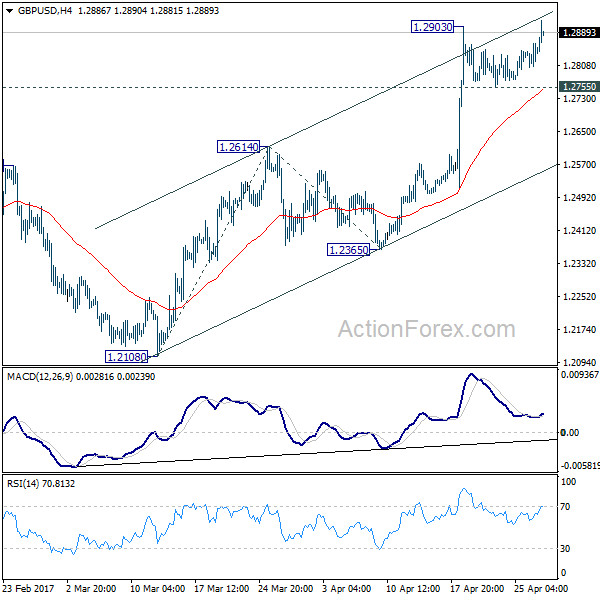
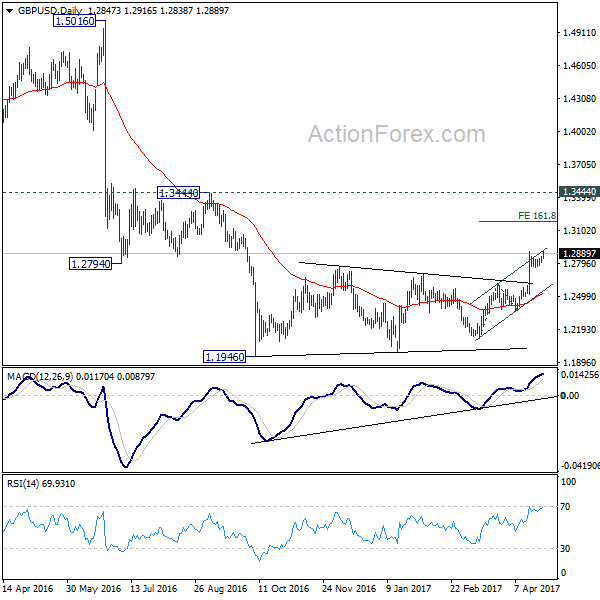
Breach of 1.2903 temporary top indicates resumption of recent rally. Intraday bias turned back to the upside. Current rise would target 161.8% projection of 1.2108 to 1.2614 from 1.2365 at 1.3184. At this point, price actions from 1.1946 are still interpreted as a correction pattern. Therefore, we'd expect strong resistance below 1.3444 to bring larger down trend resumption. On the downside, break of 1.2755 minor support will turn bias to the downside. Further break of 1.2614 resistance turned support will now indicate near term reversal.
In the bigger picture, fall from 1.7190 is seen as part of the down trend from 2.1161. There is no sign of medium term reversal yet. Sustained trading below 61.8% projection of 2.1161 to 1.3503 from 1.7190 at 1.2457 will target 100% projection at 0.9532. Overall, break of 1.3444 resistance is needed to confirm medium term bottoming. Otherwise, outlook will remain bearish.
EUR/USD Analysis: Reaches 1.0950 Mark
'We consider the euro to be cheap. Investors will be back to look at the euro from a valuation basis. We see the fundamental fair value of the currency closer to $1.25 in the long term.' – Thomas Kressin, Pimco (based on Bloomberg)
Pair's Outlook
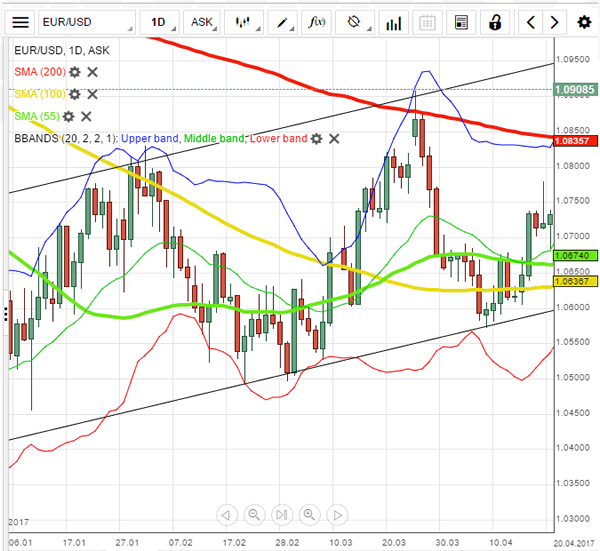
On Thursday morning the common European currency remained near the 1.09 mark against the US Dollar. Previously, as it was forecasted, the currency exchange rate reached the cluster of support below it near the 1.0880 level and rebounded. Due to that factor a surge is to be expected. However, the upper Bollinger band is no longer located below the pair, and on Thursday was providing a hindering resistance near the 1.0920 level. Moreover, the pair is still set to struggle with the resistance put up by the upper trend line of the long term pattern at 1.0960.
Traders' Sentiment
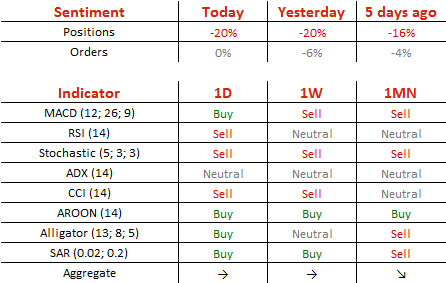
SWFX traders remain bearish, as 60% of open positions are short. Meanwhile, trader set up orders are neutral.
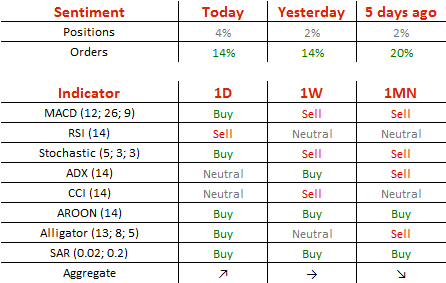
GBP/USD Analysis: Consolidation At Risk
'The first phase of negotiations with the EU [over Brexit] will be marked by sharp discord that is likely to be negative for the pound.' – BMO Capital Markets (based on Business Recorder)
Pair's Outlook
Wednesday ended with the British currency erasing all intraday losses against the US Dollar, but with no significant gains registered. A close barely above the 1.2850 psychological resistance now allows the Cable to continue edging further up, with the monthly R2, the weekly R1 and the upper Bollinger band forming another supply area around 1.2950. Although technical indicators support the possibility of another rally, the tide could still turn once the US fundamentals are released later today. Upbeat data is likely to provide the Greenback with a boost, in which case the Cable's consolidation trend would be preserved.
Traders' Sentiment
There are slightly more bulls today, namely 52% (previously 51%). At the same time, the number of orders to acquire the Sterling remained unchanged at 57%.
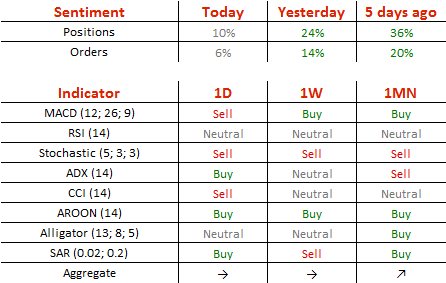
USD/JPY Analysis: Struggles To Hover Over 111.00
'Risk of closing the 109.40-60 gap should not be ignored, but price action suggests an early surge into the 112.15 to 114.65 retracement zone during May.' – Westpac (based on FXStreet)
Pair's Outlook
The USD/JPY currency pair remained relatively unchanged yesterday, with the 111.00 major level limiting downside volatility. The weekly R3 that was on the pair's path appears to be unable to provide support or resistance, thus, more focus should be on the cluster around 110.20 and the one around 112.15. From a broad technical perspective the Greenback should continue moving up until the descending channel's resistance line is reached; however, the mentioned supply area circa 112.15 could apply sufficient pressure on the Buck, resulting in another drop even back under 110.00. At the moment the US Dollar's main goal is to manage to retain its positions above 111.00.
Traders' Sentiment
There are 55% of traders holding long positions today, compared to 62% yesterday. The share of buy orders inched down from 57 to 53%.
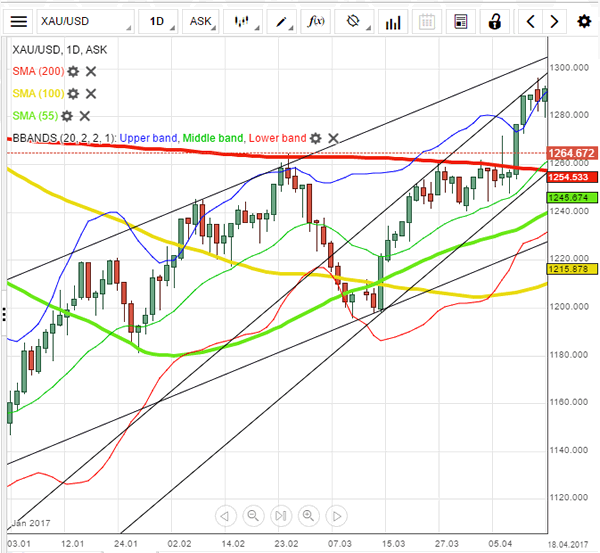
Gold Analysis: Fluctuates Above 1,265 Level
'President Donald Trump unveiled a one-page plan on Wednesday proposing deep U.S. tax cuts.' – Swati Verma, Reuters
Pair's Outlook
The yellow metal remained near previous session's opening level on Thursday morning, as the commodity price ran into resistance during the last hours of Wednesday's trading. The bullion is most likely going to find support in the weekly S2, which is located at the 1,263.56 level. The weekly S2 managed to provide enough support to keep the metal's price higher in the past two trading sessions. However, as the yellow metal rebound, it is set to face the resistance put up by the 20-day SMA at 1,271.25 level.
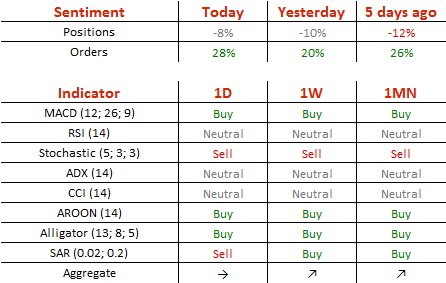
Traders' Sentiment
Traders remain bearish on the pair, as 54% of open positions are short. However, 64% of pending commands are set to buy the metal.
Technical Outlook: Cable Hit New Multi-Month High And Eyes 1.3000 Target, Caution On O/B Conditions
Today's fresh bullish acceleration has eventually completed 1.2904/1.2755 correction and broke higher to post new multi-month high at 1.2914.
Positive sentiment and bullish daily studies are supportive, as double golden-cross (10/200 and 20/200SMA's) underpins the action.
Near-term focus is turning towards psychological 1.3000 barrier initially and may extend towards weekly cloud base at 1.3113, as the action is supported by completion of inverted weekly H&S pattern.
However, risk of corrective easing on overbought daily RSI/slow stochastic remains in play, but without firmer bearish signals for now. Rising daily 10SMA, also former consolidation base at 1.2770 zone offers solid support which is expected to ideally contain dips.
Res: 1.2914, 1.2944, 1.3000, 1.3055
Sup: 1.2859, 1.2837, 1.2770, 1.2755