
Sample Category Title
Forex Technical Analysis: EUR/USD, USD/JPY, GBP/USD
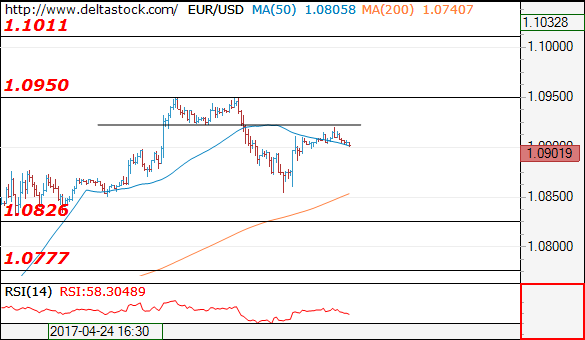
EUR/USD
Current level - 10901
The recent break through 1.0920 led to s dip to 1.0854, but it wasn't enough to initiate a more substantial downswing, so the outlook on the senior frames is still positive, with a risk of a rise towards 1.1010 area. Initial intraday resistance lies at 1.0920 and key support is projected at 1.0826.
| Resistance | Support | ||
| intraday | intraweek | intraday | intraweek |
| 1.0920 | 1.0950 | 1.0826 | 1.0780 |
| 1.0950 | 1.1010 | 1.0780 | 1.0676 |
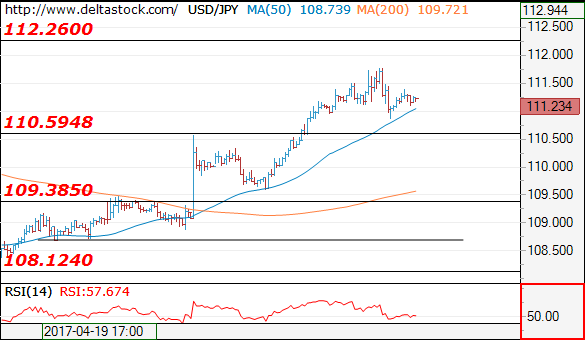
USD/JPY
Current level - 111.23
A minor reversal at yesterday's peak at 111.75 signals a negative bias, for a slide towards 110.50 support zone.
| Resistance | Support | ||
| intraday | intraweek | intraday | intraweek |
| 111.75 | 112.26 | 110.50 | 109.40 |
| 112.26 | 113.50 | 109.40 | 108.12 |
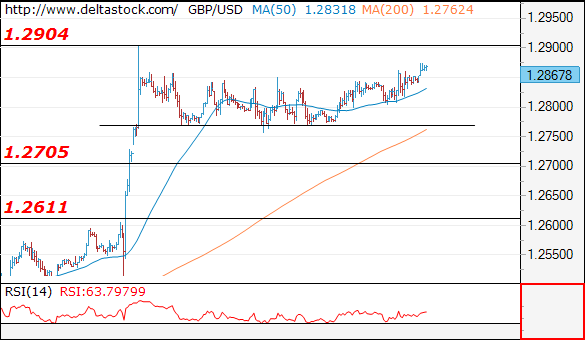
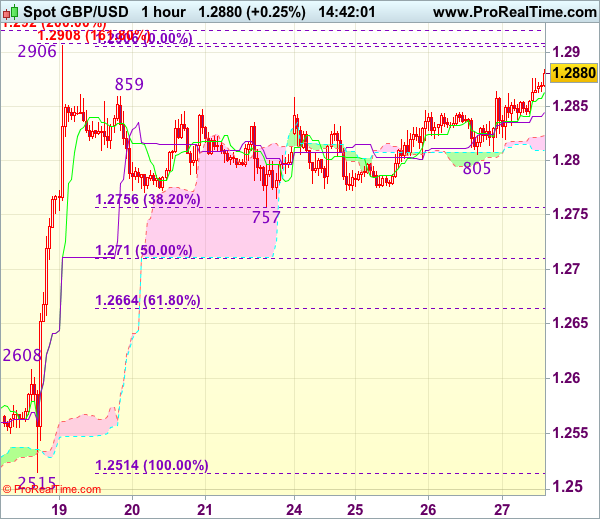
GBP/USD
Current level - 1.2867
The intraday outlook is positive and a break through 1.2904 high will target 1.3000 sentiment area. Crucial support lies at 1.2803 low.
| Resistance | Support | ||
| intraday | intraweek | intraday | intraweek |
| 1.2904 | 1.3000 | 1.2770 | 1.2610 |
| 1.3000 | 1.3500 | 1.2705 | 1.2510 |
GOLD Could Be In For Stronger Prices
Gold is moving higher after a completion of wave II pullback at 1195 area. As such, current leg up can be a new strong and extended wave III but as always we have to focus on minimum expectations which is a rally up to 1330/40 area.
GOLD, Daily
Daily Technical Analysis: EURUSD, GBPUSD, USDJPY, USDCHF
EURUSD
The EURUSD was indecisive yesterday. Price attempted to push lower bottomed at 1.0855 but closed higher at 1.0903. The bias is neutral in nearest term. Immediate support is seen around 1.0850. A clear break below that area could trigger further bearish pressure testing the pre-gap level at 1.0730 region. Immediate resistance is seen around 1.0950 (double top). A clear break and daily close above that area would expose 1.1000 – 1.1050 region. Overall I remain neutral.
GBPUSD
The GBPUSD was indecisive yesterday. The bias is neutral in nearest term. We haven’t seen a significant bullish run so far, but price is still traded just above the daily EMA 200, keeps the double bottom bullish scenario remains valid with nearest target seen around 1.3000 – 1.3050 region. Immediate support is seen around 1.2800 but key support remains at 1.2750 which need to be clearly broken to the downside to interrupt the double bottom bullish scenario.
USDJPY
The USDJPY attempted to push higher yesterday topped at 111.77 but whipsawed to the downside and closed lower at 111.04. The bias is neutral in nearest term but overall price is still in a bullish phase after broke above the trend line resistance targeting 112.20 area. Immediate support is seen around 110.85. A clear break below that area could trigger further bearish pressure testing 110.10 region. Immediate resistance is seen around 111.77. A clear break above that area could trigger further bullish pressure testing 112.20 region.
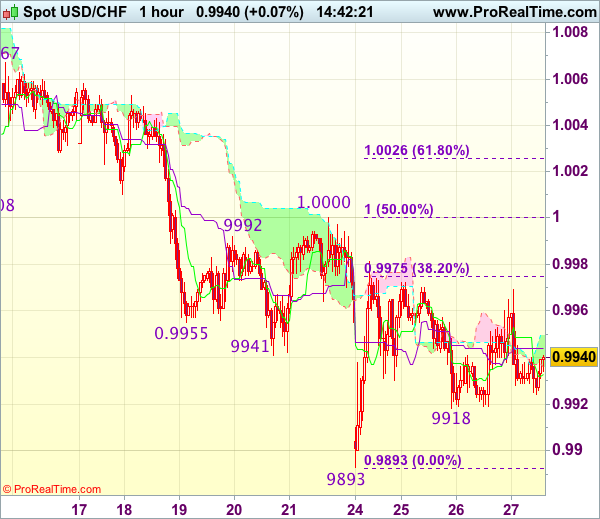
USDCHF
The USDCHF had another indecisive movement yesterday formed a Doji on daily chart. Price attempted to push higher topped at 0.9968 but closed lower at 0.9932. The bias remains neutral in nearest term but overall price is still in a bearish phase targeting 0.9880 and 0.9813 area. On the upside, 1.0020 remains a key resistance and good place to sell with a tight stop loss. Overall I remain neutral.
Unimpressed Investors Drag Equities From All-Time High
Trump's big tax reforms and tax reductions on Wednesday proved to be not so big, at least from Wall Street's perspective. U.S. equities shrugged off earlier gains after flirting with all-time highs, the dollar pared back some gains, and Treasury yields declined slightly from a two-week high.
The market's reaction to the core principles of President Trump's tax plan, which included a cut to corporate tax from 35% to 15%, isn't based on the “buy the rumors, sell the news” phenomenon, but it reflects investors' skepticism that the proposed cuts will be very difficult to pass through Congress.
The lack of details contained on Trump's single piece of paper was perceived as a publicity stunt for the President as he celebrates his first one hundred days in the Oval Office, and unfortunately, seemed more of a wish list than a serious starting point.
Many economists agree that it's almost impossible for the proposed plan to be revenue-neutral, and that's why Democrat and Republican deficit hawks will stand against it. Although I think we will see some sort of tax cuts and reforms, it's not likely to occur by August this year, and of course won't be of the proposed magnitude, which is likely to be a negative factor to the U.S. dollar and equities.
The market's focus will shift to the European Central Bank's monetary policy meeting later today. While no changes to asset purchases or interest rates are expected, Mario Draghi's tone will guide the Euro. During the month of April, economic data has shown a fair improvement in the Eurozone. Unemployment declined to an eight-year low, PMI posted its strongest readings in six years, consumer confidence strengthened, and construction of buildings and infrastructure rose at its fastest pace in almost five years. On the downside, inflation levels slipped to 1.5% in March.
The Euro will trade based on whether Mario Draghi looks at the glass half full or half empty. However, I find it difficult not to acknowledge the improvement in economic developments, and that's why I see further potential for the single currency to move higher.
Technical Outlook: EURUSD – Bullish Above 200SMA, ECB In Focus
The Euro remains bid after the first round of French election and fragile tone of the dollar, as US President Trump did not give specific details about his highly anticipated tax reform report yesterday.
The single currency is consolidating under week's high at 1.0948, posted on Tuesday and retested yesterday, but unable to break higher so far.
Two strong barriers lay in this zone, Fibonacci 61.8% of 1.1298/1.0339 descend at 1.0931 and falling weekly 55SMA (currently at 1.0935), break of which is needed to signal resumption of bull-leg from 1.0568 and expose psychological 1.1000 barrier, reinforced by weekly 100SMA.
The pair will remain bullish while above 200SMA (currently at 1.0834) with extended dips on overbought daily slow stochastic expected to find support here and keep bullish stance intact.
Today's focus is on ECB policy meeting. The central bank is expected to at least outline plans for normalizing policy on positive economic outlook, backed by brighter business and consumer sentiment, stronger manufacturing data and political environment that showed signs of stabilizing after the first round of French election.
Res: 1.0935, 1.0948, 1.1000, 1.1067
Sup: 1.0894, 1.0854, 1.0834, 1.0819
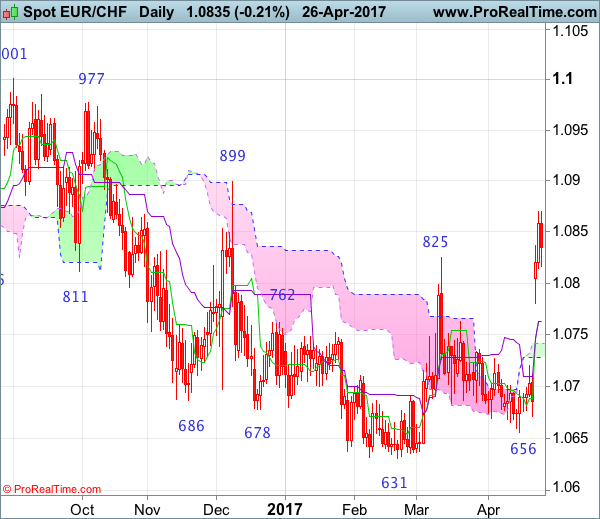
EUR/CHF Candlesticks and Ichimoku Analysis
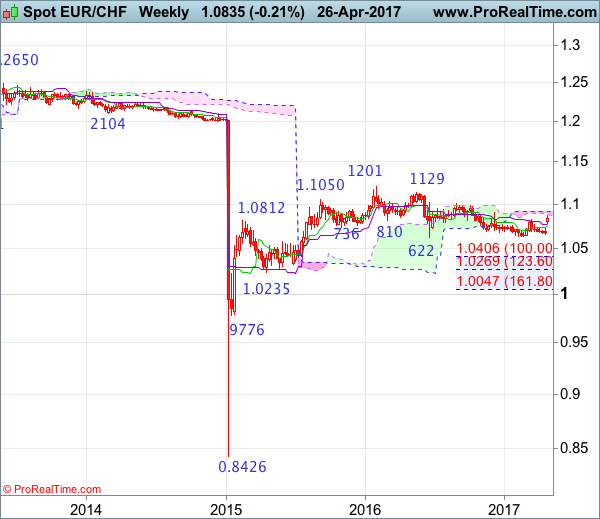
Weekly
• Last Candlesticks pattern: Doji
• Time of formation: 20 Feb 2017
• Trend bias: Up
Daily
• Last Candlesticks pattern: Doji
• Time of formation: 1 Sep 2016
• Trend bias: Near term down
EUR/CHF – 1.0838
The single currency opened higher this week and jumped to as high as 1.0870, the breach of previous resistance at 1.085 signals low has been formed at 1.0631, hence the erratic rise from there may extend further gain to resistance at 1.0899 (Dec high), however, a daily close above there is needed to retain bullishness, then the aforesaid rise may bring at least a stronger correction of early decline to 1.0950-60, then 1.0975-80, having said that, near term overbought condition should prevent sharp move beyond 1.1001 resistance, risk from there has increased for a retreat to take place later.
On the downside, whilst initial downside risk is seen for the pullback from 1.0870 to bring weakness t 1.0800, reckon the Kijun-Sen (now at 1.0763) would limit downside and bring another rise later. A daily close below the lower Kumo (now at 1.0728) would defer and suggest top is possibly formed instead, risk weakness to 1.0671 support but break of indicated support at 1.0656 is needed to add credence to this view and suggest the entire rebound from 1.0631 has ended, bring further fall towards this level later.
Recommendation: Buy at 1.0780 for 1.0980 with stop below 1.0680.
On the weekly chart, although the single currency rebounded initially last week, renewed selling interest emerged around the Kijun-Sen and price should stay above the Tenkan-Sen (now at 1.0753), bring another rise later. Above 1.0870 would extend the erratic rise from 1.0631 low for retracement of recent decline to indicated resistance at 1.0899 but a weekly close above there is needed to retain bullishness and bring a stronger rebound to 1.0970-75, then test of 1.1001. Looking ahead, only a sustained breach above 1.1001 would signal the fall from 1.1201 has ended, bring further gain to 1.1100 but reckon resistance at 1.1129 would hold on first testing.
On the downside, expect pullback to be limited to the Kijun-Sen (now at 1.0765) and the Tenkan-Sen (now at 1.0753) should contain downside, bring another rise later. Only below previous resistance at 1.0720 would abort and suggest top is possibly formed instead, risk weakness towards support at 1.0656 (last week’s low), once this level is penetrated, this would signal the rebound from 1.0631 has ended, bring retest of this level. Looking ahead, euro needs to penetrate indicated strong support at 1.0622-31 to retain bearishness and confirm recent decline from 1.1201 top has resumed and extend further fall to 1.0550-55, then 1.0500-10 but downside should be limited to 1.0400-10 (100% projection of 1.1201-1.0622 measuring from 1.1001) and price should stay well above previous support at 1.0314.
Currencies: Trump Tax Plan No Help For The Dollar. Focus Turns To Draghi
Sunrise Market Commentary
- Rates: Will Draghi trigger new Bund sell-off?
The ECB is expected to keep its policy unchanged. However, Draghi's language at the press conference might reveal more optimism on economic growth and hints about a future unwinding of the ECB's current very accommodative monetary policy stance. The market reaction could be a copy of the one after the March policy meeting (bear steepening). - Currencies: Trump tax plan no help for the dollar. Focus turns to Draghi
Yesterday, the euro fall prey to modest profit taking. However, the lack of details of the Trump tax plan prevented further USD gains. The BOJ left its policy unchanged with little impact on the yen. Today's focus will be on the ECB meeting. If Draghi would sound more optimistic, he might inspire some further unintended euro gains.
The Sunrise Headlines
- US equities ended marginally weaker as they were not impressed by Trump's tax plan. Overnight, Asian stock markets also correct lower with China marginally underperforming (‐0.5%).
- The Trump administration said it was no longer considering pulling out of NAFTA. Mexico, Canada and the US will soon begin talks over renegotiating the agreement.
- President Trump's top economic team unveiled what they called the biggest tax cut in US history, proposing a sharp reduction in corporate taxes and a simplification of individual rates they said would unleash economic growth.
- The BoJ kept its policies unchanged while lowering its inflation forecast. Any exit from its unprecedented monetary easing remains far away. The central bank made a small increase to its growth forecasts for this fiscal year and next.
- Global oil discoveries fell to a record low in 2016, the International Energy Agency says, raising fresh concerns about the potential for a petroleum‐supply shortage as soon as 2020.
- Profits earned by China's industrial firms rose 23.8% in March from a year earlier, buoyed by a continued construction boom, though the pace of growth eased from multi‐year highs seen in previous months.
- Today's eco calendar heats up with US trade balance, durable goods orders, weekly jobless claims, German Inflation, EMU EC economic confidence and central bank meetings in EMU and Sweden. Italy and the US tap the market
Currencies: Trump Tax Plan No Help For The Dollar. Focus Turns To Draghi
Tax plan no help for USD. Focus turns to Draghi
On Wednesday, the combined rally of EUR/JPY, USD/JPY and EUR/USD continued in Asia, but the post‐Macron risk trade slowed in Europe. This caused some profit taking on the euro as investors reduced positions ahead of the Turmp tax plan and the ECB policy meeting today. The Trump tax plan didn't bring additional info. The announcement triggered a slight setback in US equities and in the dollar. EUR/USD reversed part of intra‐day losses and finished the session at 1.0904 (from 1.0926). USD/JPY closed the session little changed at 111.09.
Overnight, the BOJ as expected left its policy unchanged. The bank is rather upbeat on the economy. Still, It cut its inflation forecast for this fiscal year, suggesting that no policy tightening is to be expected anytime soon. The Bank expects the 2% target to be reached during the fiscal year 2018/19. The reaction of the yen is modest. USD/JPY hovers in the 111.20/25 area. Asian equities trade with limited losses following WS. EUR/USD hovers little changed n the 1.09 area. The CAD and MXN rebound as Trump said he doesn't intend to scrap the NAFTA pact.
Today, the eco calendar is well filled. In EMU, the EC confidence data and the German inflation data take centre stage. German HICP inflation is expected to rebound to 1.9 % Y/Y from a surprise drop to 1.5% Y/Y. We consider the expected rebound as quite strong. A lower than expected figure might be slightly negative for the euro. The US calendar heats up with the trade balance, the durable goods orders and the weekly jobless claims. For the durable orders, we see downside risks. The key feature for the (FX) trading will be the ECB meeting. (see our preview). Given uncertainty about the French elections, we expect the ECB to try to avoid volatility. So, the core of its current policy will be confirmed. It is possible that the risk assessment is upgraded to broadly balanced from tilted to the downside. There is a small chance that the reference to even lower rates is scrapped from the forward guidance. However, we think that the June and the September meetings will be crucial.
In a day‐to‐day perspective, the eco data might be mixed for EUR/USD trading. Market disappointment on the Trump tax plan might be slightly negative for the dollar. As was the case last month, the ECB will try to avoid hints about policy normalisation. However, hints on an improvement in the economic context might be seen as opening the door for a change in policy. In such a scenario, EUR/USD might revisit the recent highs. Even a test of the 1.10 barrier might be on the cards.
This week, FX trading was driven by the global risk trade as (European) political event risk eased. This supported USD/JPY but also EUR/USD and EUR/JPY. Market speculation that the decline in EMU political event risk could bring forward the ECB normalisation process supports the euro, too. ECB's Draghi will downplay this speculation. Question is whether the (FX) market will believe it. At the same time, Trump's tax plan is no immediate support for the dollar. So, for now, a cautiously euro positive momentum might persist. From a technical point of view, This week's rebound of USD/JPY suggests a bottoming out process might have started, but the pair needs to regain the 112.20 level (neckline ST double bottom) to improve the picture. EUR/USD extensively tested the topside of the MT range (1.0874/1.0906 area) late March. The pair returned to the range top after the French election and set minor new highs. We look out how this test turns out. If EUR/USD would regain the 1.10 barrier, next resistance comes in in the 1.1145/1.13 area (US pre/post‐election swings).
EUR/USD maintains gains. Range top under heavy strain
EUR/GBP
Cable continues to challenge recent top
Yesterday, the focus of sterling trading was on external factors, including on the Trump tax plan. Euro profit taking dominated the price action in EUR/GBP. EUR/GBP closed the session at 0.8487. Initially, the dollar held relatively strong against sterling, but cable regained some ground on USD softness after the Trump Tax plan. The pair closed the session at 1.2848.
Today, the UK calendar contains the CBI retail data/distributive reported sales. A slight decline in the sales momentum is expected. However, the figure will have to be really negative to trigger a meaningful decline of sterling. Sterling took a good start against the euro and the dollar this morning. However, if the euro would stay well bid on the ECB policy statement, it could also help to put a floor for the EUR/GBP. Cable currently profits from USD softness.
Early last week, EUR/GBP dropped below EUR/GBP 0.84 support, (temporary) improving the sterling picture. The pair came within reach of the key 0.8305 support (Dec low), but no real test occurred. After this week's rebound, the range bottom is better protected. Longer term, Brexit‐complications remain a potential negative for sterling. Of late, this was not the focus of sterling trading. Nevertheless on technical considerations we are inclined to reconsider a cautious EUR/GBP buy‐on‐dips approach.
EUR/GBP jumps on French election. 0.83 range bottom looks safe for now. Downside better protected due to euro strength
Trade Idea : USD/CHF – Stand aside
USD/CHF - 0.9935
Most recent candlesticks pattern : N/A
Trend : Near term down
Tenkan-Sen level : 0.9933
Kijun-Sen level : 0.9944
Ichimoku cloud top : 0.9950
Ichimoku cloud bottom : 0.9936
New strategy :
Stand aside
Position : -
Target : -
Stop : -
Although dollar has retreated after meeting resistance at 0.9969 yesterday, a firm break below indicated support at 0.9918 is needed to signal the rebound from 0.9893 (this week’s low) has ended, bring retest of this level, break there would confirm recent decline from 1.0108 has resumed and extend weakness to 0.9865-70 (2 times extension of 1.0108-1.0008 measuring from 1.0067), however, reckon support at 0.9831 would hold from here, bring rebound later
In view of this, would not chase this fall here and would be prudent to stand aside for now. Above 0.9969-75 would prolong consolidation, bring another bounce to 0.9981 but break of 1.0000-08 resistance is needed to signal low is formed instead, bring rebound to 1.0025-30 (61.8% Fibonacci retracement of 1.0108-0.9893), however, price should falter below resistance at 1.0067.
Trade Idea : GBP/USD – Buy at 1.2845
GBP/USD - 1.2884
Most recent candlesticks pattern : N/A
Trend : Near term up
Tenkan-Sen level : 1.2863
Kijun-Sen level : 1.2845
Ichimoku cloud top : 1.2823
Ichimoku cloud bottom : 1.2809
New strategy :
Buy at 1.2845, Target: 1.2945, Stop: 1.2810
Position : -
Target : -
Stop : -
As cable has risen again after finding renewed buying interest at 1.2805, signaling the pullback from 1.2906 has ended at 1.2757 earlier and retest of this level would be seen, break there would confirm recent upmove has resumed for headway o 1.2920-30 (2 times extension of 1.2365-1.2575 measuring from 1.2500), then 1.2950 but reckon 1.2990-00 (1.236 times projection of 1.2109-1.2616 measuring from 1.2365 and psychological resistance) would hold on first testing.
In view of this, would not chase this rise here and would be prudent to buy cable on pullback as downside should be limited to 1.2840-45. Below said support at 1.2805 would abort and prolong consolidation, then risk another corrective fall to indicated previous support at 1.2757 but price should stay well above 1.2710 (50% Fibonacci retracement of 1.2515-1.2906), bring another rise.
Post-Rout Rally Likely For Oil But OPEC Concerns Remain In Place
Key Points:
- Buying pressure should be returning this week.
- Multiple technical reading suggestive of a reversal.
- Fundamentals likely to cap upsides around the 51.55 handle.
Following a much larger than anticipated drawdown in US Crude Inventories, the recent oil rout is levelling out which means buying pressure is likely to be coming down the line in the immediate future. Moreover, both the near and medium-term technical biases are indicating that a bottom has been reached which will also be adding to bullish sentiment. Despite this, overall upsides may be limited which is worth taking into account.
Starting with the long-term technicals, the key structure to keep in mind is that rising wedge which began approximately 12 months ago. Notably, the recent rout has brought oil prices into conflict with the downside of this pattern, which would typically necessitate some upside action, moving ahead. Indeed, this shift in momentum is already becoming apparent given the rather muted moves made by oil over the prior 3 sessions.
This shift in bias comes as little surprise given the developments in a number of near-term technical readings. In particular, a potential ascending triangle or bullish pennant is shaping up which will be reinforcing the effects of the long-term wedge. However, in addition to this, we can also see that stochastics have been pushed into oversold territory around a historical reversal point which will be spurring the bulls into action.
If enough support can be recruited, we expect to see oil prices make their way higher over the next few weeks, potentially even back to above the $50 handle. Although, overall gains are likely to be capped around the 51.55 level as this represents the intersection of the upside of the near-term triangle and the 50.0% Fibonacci retracement. What's more, even getting to this price involves closing back above the 100 day EMA which may prove rather difficult this time around as a result of uncertainty regarding OPEC.
Speaking of the cartel, it's slipping grip on the market is becoming evident for a number of reasons but one recently reported statistic stands out. Specifically, we saw a record uptick in global Oil shipments by tanker to 50.3M barrels last month which can't be a good sign for those wanting to see oil well above the $50 handle. Additionally, Russia is proving reluctant to sign on for an extension of the freeze which will reinforce resistance substantially.
Ultimately, the combination of both the technical and fundamental biases illustrate that, while we can expect to see buoyancy return moving ahead, the 51.55 level should remain a robust zone of resistance. As a result, we may have to see a break out of some form or another in June to resolve the developing disconnect between technicals and fundamentals and this is worth watching out for.