
Sample Category Title
USD/CHF Daily Outlook
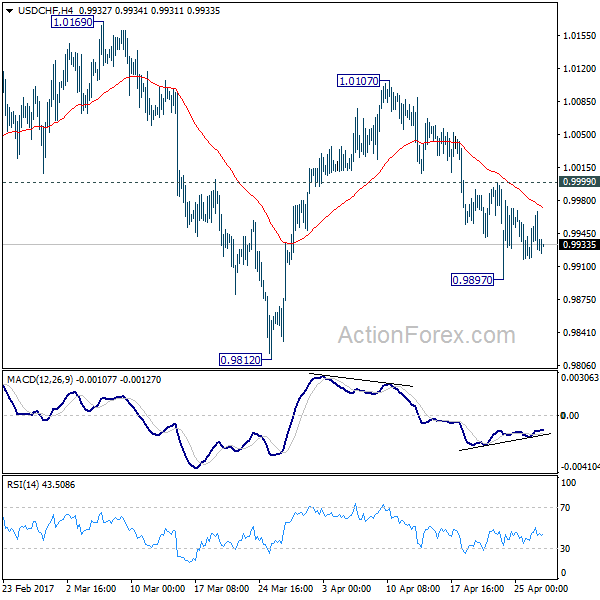
Daily Pivots: (S1) 0.9909; (P) 0.9939; (R1) 0.9960; More.....
Intraday bias in USD/CHF remains neutral for the moment. At this point, with 0.9999 minor resistance intact, deeper fall is still in favor. Below 0.9897 temporary low will turn bias to the downside for 0.9812 and possibly below. Nonetheless, whole decline from 1.0342 is seen as a correction. Hence, we'll look for bottoming signal below 0.9812. Meanwhile, on the upside, above 0.9999 minor resistance will turn bias back to the upside for 1.0107 resistance.
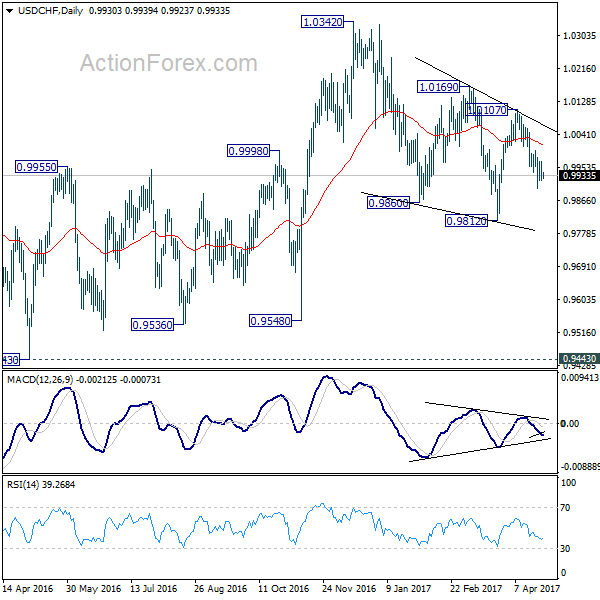
In the bigger picture, we're still maintaining that firm break of 1.0342 key resistance is needed to confirm underlying bullish momentum in the cross. However, the corrective nature of the fall from 1.0342 is starting to give the medium term outlook a bullish favor. Hence, in stead of looking for topping signal around 1.0342, we'd now pay closer attention to upside acceleration as USD/CHF approaches this level again.
USD/JPY Daily Outlook
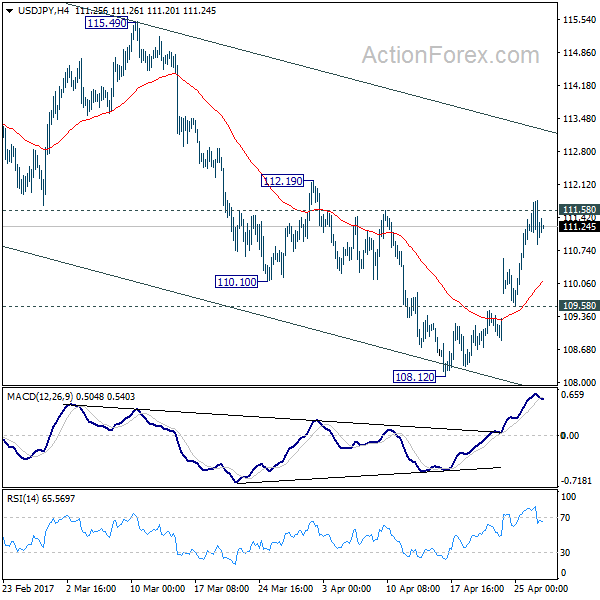
Daily Pivots: (S1) 110.68; (P) 111.23; (R1) 111.60; More....
At this point, further rise is expected in USD/JPY with 109.58 minor support intact. Sustained trading above 111.58 support turned resistance will indicate that fall from 118.65 is merely a corrective move and has completed. Outlook will then be turned bullish for 115.49 resistance and above. However, break of 109.58 will argue that fall from 118.65 is still in progress and will turn bias to the downside for 108.12 and below.
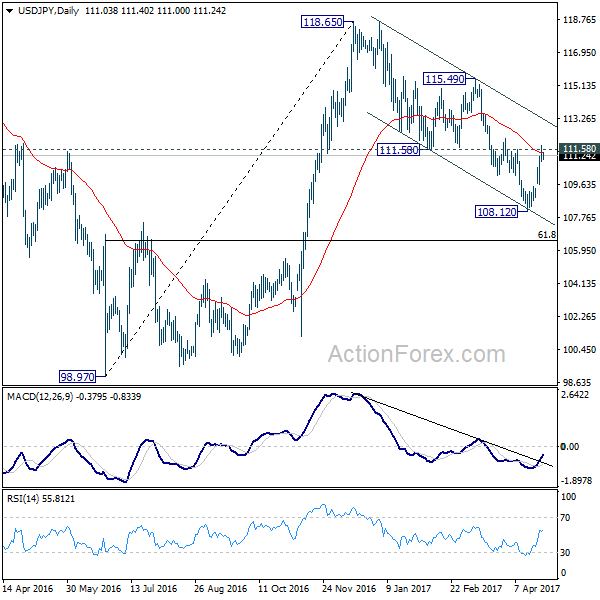
In the bigger picture, price actions from 125.85 high are seen as a corrective pattern. Current development suggests that it's not completed yet and is extending. In case of deeper decline, downside should be contained by 61.8% retracement of 75.56 to 125.85 at 94.77 to bring rebound. Rise from 75.56 is still expected to resume later after the correction from 125.85 completes.
AUD/USD Daily Outlook
Daily Pivots: (S1) 0.7435; (P) 0.7493; (R1) 0.7532; More...
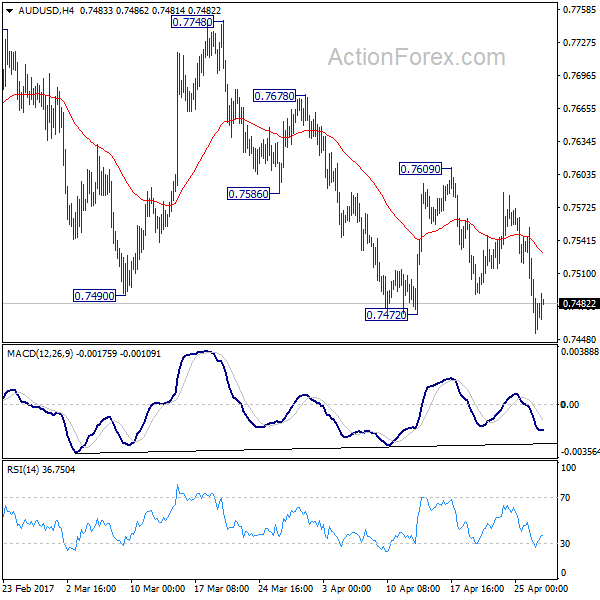
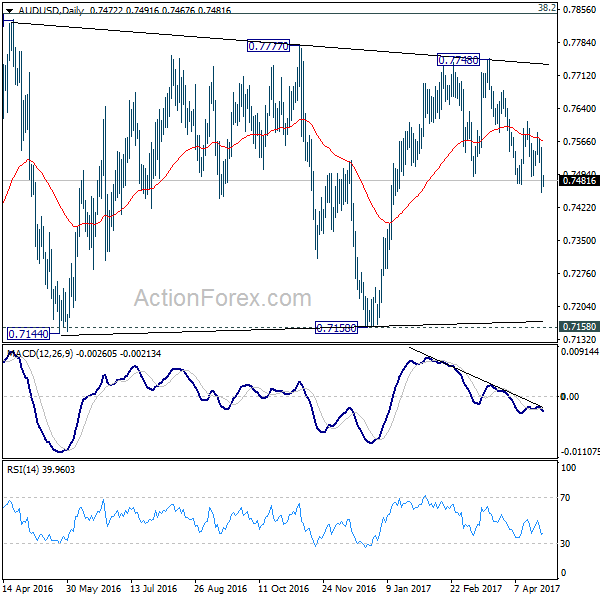
AUD/USD's break of 0.7472 support revives that case that whole rise from 0.7150 is completed at 0.7748. Intraday bias is turned back to the downside. Deeper fall is now anticipated back to test 0.7144/58 key near term support zone. On the upside, break of 0.7609 resistance is now needed to indicate completion of the fall from 0.7748. Otherwise, outlook will stay mildly bearish in case of recovery.
In the bigger picture, we're still treating price actions from 0.6826 low as a correction. And, as long as 38.2% retracement of 0.9504 to 0.6826 at 0.7849 holds, long term down trend from 1.1079 is expected to resume sooner or later. Break of 0.6826 low will target 0.6008 key support level. However, firm break of 0.7849 will indicate that rise from 0.6826 is developing into a medium term rebound, rather than a sideway pattern. In such case, stronger rise should be seen to 55 month EMA (now at 0.8144) and above.
USD/CAD Daily Outlook
Daily Pivots: (S1) 1.3568; (P) 1.3568; (R1) 1.3647; More....
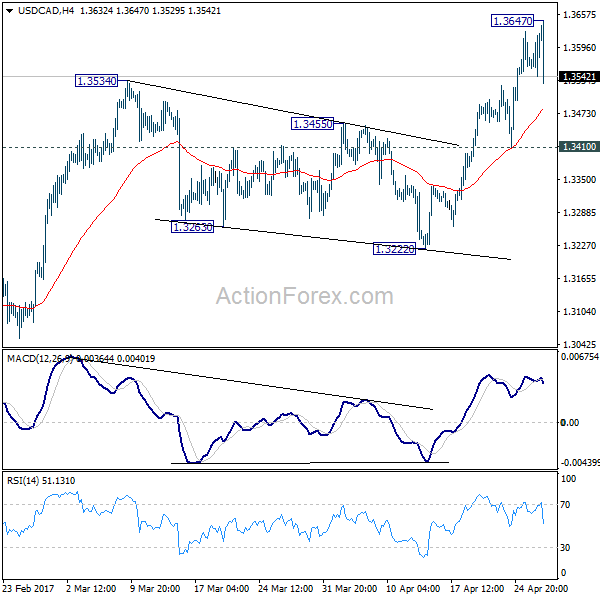
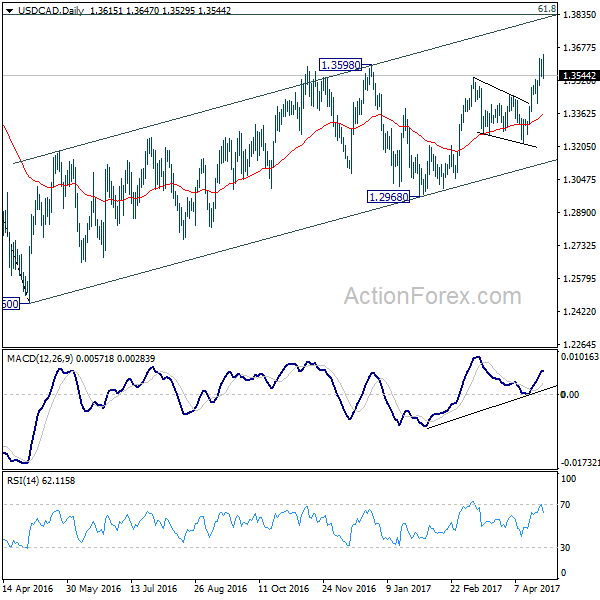
A temporary top is in place at 1.3647 after USD/CAD fails to sustain above 1.3598 key resistance. Intraday bias is turned neutral first. Some consolidations should be seen but downside of retreat would be contained by 1.3410 support to bring another rally. Break of 1.3647 will extend the whole medium rise from 1.2460 to next medium term fibonacci level at 1.3838. However, break of 1.3410 will turn bias back to the downside for 1.3222 support instead.
In the bigger picture, price actions from 1.4689 medium term top are seen as a correction pattern. The first leg has completed at 1.2460. The second leg from 1.2460 is likely still in progress and could target 61.8% retracement of 1.4689 to 1.2460 at 1.3838. We'd look for reversal signal there to start the third leg. However, break of 1.2968 will argue that the third leg has already started and should at least bring a retest of 1.2460 low. Meanwhile, sustained trading above 1.3838 would pave the way to retest 1.4689 high.
Markets Shrug Trump’s Tax 1-Page Tax Plan, CAD Rebounds on NAFTA News, Yen Steady after BoJ
The financial markets had very little reaction to the highly anticipated announcement of tax reforms by US President Donald Trump. DJIA reversed earlier gains and closed slightly lower by -0.1% at 20975.09. S&P 500 also closed down -0.05% at 2387.56. Both were held below record intraday highs of 21169.11 and 2400.98 respectively. 10 year yield also closed lower, losing -0.016, at 2.311. The dollar index struggled to find follow through buying above 99 and is back at 98.90 in Asian session. In the currency markets, Euro remains the strongest major currency for the week, followed by Sterling and Swiss Franc. Yen remains the weakest one after BoJ stands pat, raised growth forecast but lowered inflation projections. Canadian dollar is still trading down for the week but is given a mild boost on news that US will stay with NAFTA for the moment.
Trump delivered a 1-page tax plan
Trump gave a one-page handout to reporters at the White House outlining the tax proposals. The plan includes sections on business and individual reforms. Top corporate tax rate of all businesses will be lowered from 35% to 15%. There will be a "one-time" tax on dollars held by corporations overseas but the rate is not decided yet. Tax breaks for special interests will eliminated. For the individuals, seven tax brackets will be reduced to three of 10%, 25% and 35%. Standard deduction will be doubled and there will tax relief for families with child and dependent care expenses.
Canadian Dollar rebound as NAFTA stays
Canadian Dollar rebounds after the White House said that Trump will not terminate the participation in the North American Free Trade Agreement immediately. The White House said in a statement that there were "pleasant and productive" conversations with leaders of Mexico and Canada. And Trump agreed not to terminate NAFTA at this time and the leaders agreed to "proceed swiftly, according to their required internal procedures, to enable the renegotiation of the Nafta deal to the benefit of all three countries." Commerce Secretary Wilbur Ross said earlier this week that the administration is working with the Congress to start renegotiation of NAFTA as Trump has been openly criticizing the deal. But some Republicans are clearly in objection to scrapping NAFTA.
BoJ raised growth forecast, cut inflation estimate
BoJ left monetary policies unchanged today as widely expected. In the quarterly report of Outlook for Economic Activity and Prices, the central bank lowered inflation forecast for the current fiscal year to 1.4%, down from January's projection of 1.5%. Inflation forecast for fiscal 2018 was held unchanged at 1.7%. On the other hand, growth forecast for fiscal 2017 was revised up to 1.6%, from 1.5%. For fiscal 2018, growth is projected to be at 1.3%, up from prior estimation of 1.1%.
UK PM May held constructive talk with EC President Juncker
UK Prime Minister Theresa May met with European Commission President Jean-Claude Juncker yesterday on a discussion over Brexit. UK's main negotiator David Davis and EU's negotiator Michel Barnier were also present. May's spokesperson said in a statement that the meeting was "constructive" and May "reiterated the UK's commitment to achieving a deep and special partnership with the European Union." EC also said in a statement that the meeting was "constructive" and addressed "issues of strategic interest". No detail about the conversation was released. EU leaders will meet this Saturday to work on their own negotiation plan and official talk will start after UK election on June 8. Barnier noted that the negotiations must be concluded within 18 months to allow time for approval by respective parliaments.
CBI director general warned no trade deal should be Plan Z
CBI director general Carolyn Fairbairn warned that the long term trading relationship between UK and EU is "the real prize", "dwarfing any potential divorce settlement." And, "a one-off EU divorce bill of, some suggest, tens of billions of euros, compared with EU-UK trade worth well over €600bn euros every year, the economic case for making rapid progress on a trade agreement is clear." She urges that "economics cuts through the politics" in the discussions. And, "the business community - in the UK and the EU - is united in wanting an agreement with as few barriers as possible. Yet without an agreement, we'd lose together." And, "for both sides, leaving the negotiating table without a deal shouldn't be 'Plan B' but 'Plan Z'".
ECB to stand pat today
ECB is widely expected to keep monetary policies unchanged today. The first round result of French presidential election, and centrist Emmanuel Macron's high chance of winning the run-off should give ECB much relief. Nonetheless, the central bank is still not ready to hint on any stimulus exit yet. ECB President Mario Draghi has stressed enough that there are much downside risks to the economy, and underlying inflation stayed low. Risks are still tilted much to the downside in spite of the French election results. Meanwhile, various ECB officials have clearly expressed that the course of monetary policies are set for 2017. The central bank will continue with its EUR 60b per month asset purchase till the end of the year. And it's unlikely that policy makers will opt for a rate hike before the asset purchase ends. We'd expect the speculation and debate on exit to start heating up again in June.
Elsewhere
Australia import price index rose 1.2% qoq in Q1, much higher than expectation of -0.5% qoq. Swiss will release trade balance in European session. Germany will release Gfk consumer sentiment and CPI. Eurozone will release confidence indicators. UK will release CBI reported sales. From US, trade balance, wholesale inventories, durable goods orders, jobless claims and pending home sales will be featured.
USD/CAD Daily Outlook
Daily Pivots: (S1) 1.3568; (P) 1.3568; (R1) 1.3647; More....
A temporary top is in place at 1.3647 after USD/CAD fails to sustain above 1.3598 key resistance. Intraday bias is turned neutral first. Some consolidations should be seen but downside of retreat would be contained by 1.3410 support to bring another rally. Break of 1.3647 will extend the whole medium rise from 1.2460 to next medium term fibonacci level at 1.3838. However, break of 1.3410 will turn bias back to the downside for 1.3222 support instead.
In the bigger picture, price actions from 1.4689 medium term top are seen as a correction pattern. The first leg has completed at 1.2460. The second leg from 1.2460 is likely still in progress and could target 61.8% retracement of 1.4689 to 1.2460 at 1.3838. We'd look for reversal signal there to start the third leg. However, break of 1.2968 will argue that the third leg has already started and should at least bring a retest of 1.2460 low. Meanwhile, sustained trading above 1.3838 would pave the way to retest 1.4689 high.
Economic Indicators Update
| GMT | Ccy | Events | Actual | Forecast | Previous | Revised |
|---|---|---|---|---|---|---|
| JPY | Monetary Policy Statement | |||||
| 1:30 | AUD | Import Price Index Q/Q Q1 | 1.20% | -0.50% | 0.20% | |
| 6:00 | CHF | Trade Balance (CHF) Mar | 3.01B | 3.12B | ||
| 6:00 | EUR | German GfK Consumer Confidence May | 9.9 | 9.8 | ||
| 9:00 | EUR | Eurozone Economic Confidence Apr | 108.1 | 107.9 | ||
| 9:00 | EUR | Eurozone Business Climate Indicator Apr | 0.82 | 0.82 | ||
| 9:00 | EUR | Eurozone Industrial Confidence Apr | 1.3 | 1.2 | ||
| 9:00 | EUR | Eurozone Services Confidence Apr | 12.9 | 12.7 | ||
| 9:00 | EUR | Eurozone Consumer Confidence Apr F | -3.6 | -3.6 | ||
| 10:00 | GBP | CBI Realized Sales Apr | 6 | 9 | ||
| 11:45 | EUR | ECB Rate Decision | 0.00% | 0.00% | ||
| 11:45 | EUR | ECB Marginal Lending Facility | 0.25% | 0.25% | ||
| 11:45 | EUR | ECB Deposit Facility Rate | -0.40% | -0.40% | ||
| 11:45 | EUR | ECB Asset Purchase Target (EUR) Apr | 60B | 80B | ||
| 12:00 | EUR | German CPI M/M Apr P | -0.10% | 0.20% | ||
| 12:00 | EUR | German CPI Y/Y Apr P | 1.90% | 1.60% | ||
| 12:30 | USD | Advance Goods Trade Balance Mar | -65.2B | -63.9B | ||
| 12:30 | USD | Wholesale Inventories Mar P | 0.30% | 0.40% | ||
| 12:30 | USD | Durable Goods Orders Mar P | 1.30% | 1.80% | ||
| 12:30 | USD | Durables Ex Transportation Mar P | 0.50% | 0.50% | ||
| 12:30 | USD | Initial Jobless Claims (22 APR) | 241K | 244K | ||
| 14:00 | USD | Pending Home Sales M/M Mar | -1.00% | 5.50% | ||
| 14:30 | USD | Natural Gas Storage | 54B |
Market Morning Briefing: Nothing Has Changed Much After The Trump Tax Plan
STOCKS
The tax plan released by Trump yesterday proposed to sharply slash business taxes. It proposed to cut income tax rate from 39.6% to 35% , reduce corporate tax from 35% to 15% and to reduce the seven tax brackets for individuals to 3-tax brackets of 10%, 20% and 35% respectively.
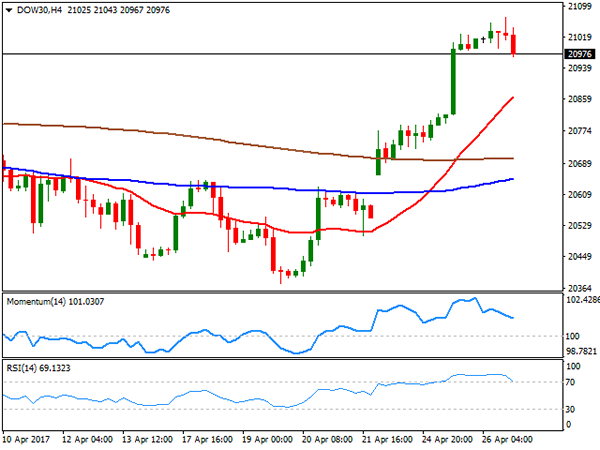
The US stocks have not really moved up at the end f the session. Dow (20975.09, -0.10%) is testing resistance on the daily and 3-day line charts and could possibly come off in the near term. However, when looked at the candle charts, there could be some scope of rising towards 21200-21400 before starting a correction.
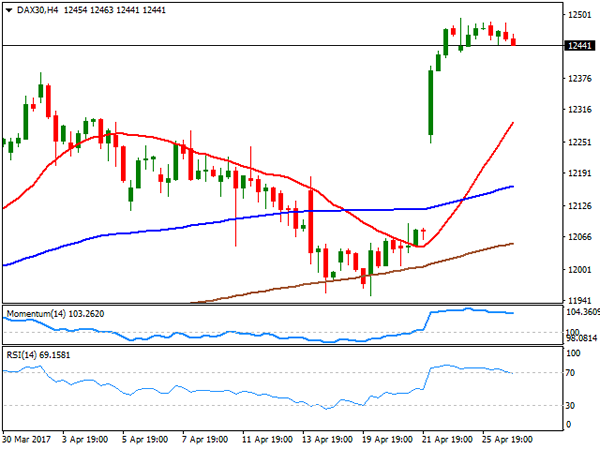
Dax (12472.80, +0.05%) could move sideways to create more scope of an upmove. For now 12532 is an important resistance and it could be tested in the next 3-4 sessions.
Shanghai (3112.40, -0.91%) has fallen sharply again coming down to test 3100 levels and looks bearish for the week. A break or bounce from levels near 3100 would decide the next course of direction.
Nikkei (19243.76, -0.24%) is stable just now but could head towards 19620 as mentioned yesterday. Immediate trend is up.
Nifty (9351.85, +0.49%) has been playing out in line with our expectation and could face rejection from resistance near 9400.
COMMODITIES
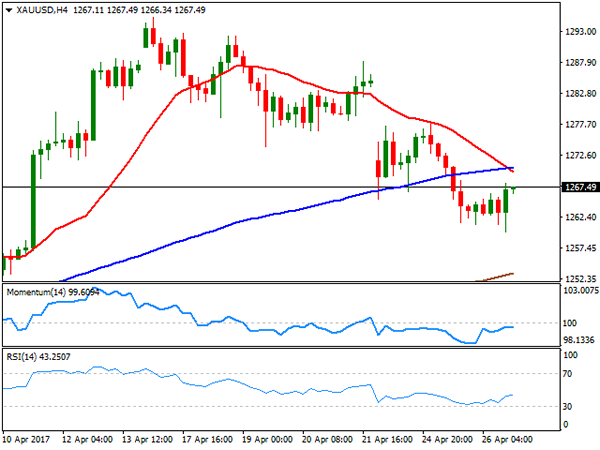
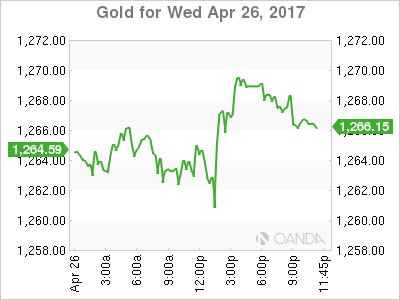
Muted price action had been seen in Gold (1266).Immediate supports are poised at 1260 and 1239 respectively. Buyers will take every dip as a further opportunity for buying while it is trading above 1239. 1285 could be a level where the price action has to be checked to assess the chances of further bounce to 1305 to 1330 levels.
Silver (17.43) is Oversold on the near-term charts and it is hovering around its crucial resistance at 17.45.A close above that could open up 17.80 levels as well. Immediate support is at 17.02 levels.
Copper (2.57) had failed to close above 2.62 levels. A close below 2.55 could open up 2.48 and 2.45 levels respectively. The bias would remain bearish while it is trading below 2.62-67 levels.
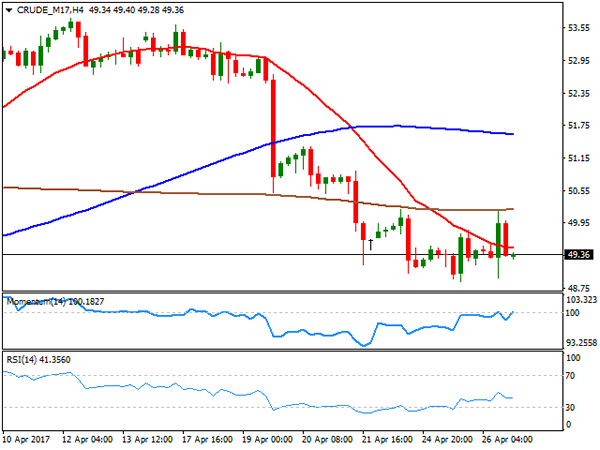
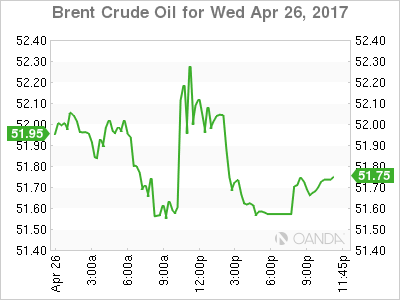
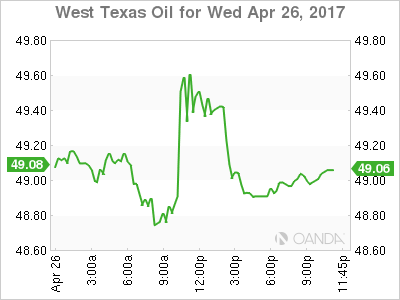
Brent (51.69) and WTI (49.42) have been well supported due to decrease (-3.6M) in U.S crude oil inventory and near term Oversold condition. In a major downtrend like this, the bounces are generally seen as fresh shorting opportunities by the big money with the speculators excited with the fast movement. While we have been expecting a bounce from 51.69 to53.80 in Brent and 49.42 to 51.50 in WTI , we prefer to wait for higher levels to create fresh short positions.
FOREX
Nothing has changed much after the Trump tax plan came out as a page full of bullet points denied all the necessary details to understand anything clearly about it and told of nothing new. It remains to be seen if the BOJ and ECB meet today can trigger any major moves.
Dollar Index (98.89) still hovers just above the make or break support of 98.50 but requires a rise above 99.35 for a confirmed reversal signal and Euro (1.0911) has again come off the highs after being rejected from the major resistance of 1.0950, keeping open the possibility of a downward correction to 1.0840 and 1.0700. Today's ECB meet may turn out to be a market driver.
It has been another quiet session for Pound (1.2870) in 1.2750-1.2900 as expected which may continue for the last 2 sessions of the week too.
Dollar-Yen (111.22), just as expected, has stalled after hitting a high of 111.77, bang in the middle of our target/resistance area of 111.50-112.00 as it waits for the BOJ meet conclusion due in a few minutes. Support remains unchanged at 110.00.
Aussie (0.7487) has tested and bounced exactly from the lower end of the range of 0.7450-0.7600. The lack of downside momentum may push it up to 0.7550 once again before any large directional move emerges.
Dollar-Rupee (64.12) has resolved the range of 64.20-70 to the downside and now, as long as the resistance of 64.35-45 holds, the path of least resistance points down. Initial support comes at 63.80 which may be revised later to 63.60-50 if needed.
INTEREST RATES
ECB Policy meet is due today. Markets await to watch if there is any indication of an eventual stimulus reduction that Draghi may signal today. The German yields could come off in the near term as they are headed towards near term resistances. The 10Yr (0.35%) could move up towards 0.40% in the coming sessions.
The US yields have fallen slightly. The 5Yr (1.84%), 10YR (2.31%) and the 30YR (2.97%) are down from previous levels of 1.86%, 2.33% and 2.98% respectively. The yields could start coming off again in the near term.
The German-US 2Yr (-1.98%) has come off and is testing the earlier resistance turned support near current levels. A bounce from here could trigger some more strength in Euro in the near term. We need to keep a close watch for further directional cues.
Elliott Wave View: USDCAD Flat Correction
Short term Elliott Wave view in USDCAD suggest the decline to 1.322 ended Intermediate wave (X). The rally from there is unfolding as a double three Elliott Wave structure where Minute wave ((w)) ended at 1.3525 and Minute wave ((x)) ended at 1.3406. Minute wave ((w)) is subdivided as a Flat Elliott wave structure where Minutte wave (a) ended at 1.3338 and Minutte wave (b) ended at 1.3258. Near term, pair is within Minutte wave (x) Flat pullback to correct the cycle from 4/24 low towards 1.346 – 1.3498 area before the rally resumes. We don’t like selling the proposed pullback and expect buyers to appear once wave (x) pullback is complete in 3, 7, or 11 swing as far as pivot at 1.3406 stays intact.
USDCAD 1 hour Elliott Wave Chart
Foreign Exchange Market Commentary: EUR/USD, USD/JPY, GBP/USD, GOLD, WTI CRUDE, DJIA, FTSE100, DAX
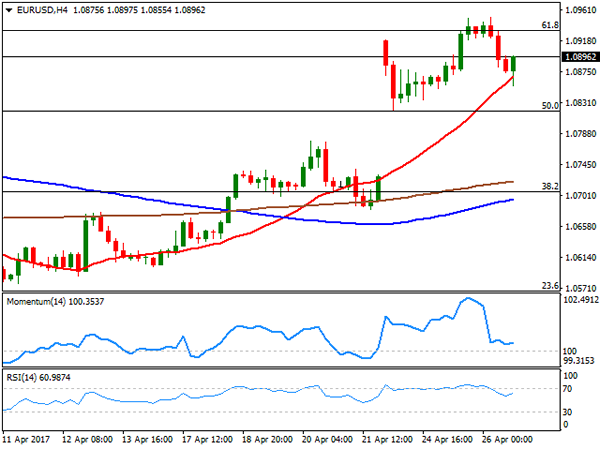
EUR/USD
The greenback closed the day higher against its major rivals, bolstered by hopes the US White House will announce the so long promised tax reform somehow during the day, rather than on the "official" release. The American dollar advanced ahead of Trump unveiling its plan, easing modestly afterwards, as the US administration failed to clarify how they plan to pay for these tax deductions, although higher taxes to imports have been mentioned. Furthermore, the plan presents different scales of reduction, benefiting the most high-income taxpayers that would receive the biggest cuts, both in dollar terms and as a percentage of income. Additionally, the actual administration is considering an executive order on withdrawing the US from the NAFTA, hitting particularly the Mexican Peso and the CAD. Market's attention is now centered on Thursday's ECB monetary policy meeting, with mounting speculation that Mr. Draghi will present a change in the bank's guidance towards future moves, as growth continued to be solid in the region.
The EUR/USD pair fell down to 1.855 its lowest for the week, but bounced modestly from the level, ending the day around the 1.0900 threshold, maintaining the positive tone, despite the intraday decline. In the 4 hours chart, technical readings support additional recoveries, as indicators have corrected extreme overbought conditions, but pared their decline within positive territory, turning modestly higher ahead of Wall Street's close, whilst the intraday decline was quickly reversed after the price briefly slide below a bullish 20 SMA. Still, the price needs to surpass the 1.0930/50 region, where the pair presents the 61.8% retracement of the post-US election decline and the recently achieved yearly high, to be able to extend its gains towards the critical 1.1000 level.
Support levels: 1.0865 1.0820 1.0785
Resistance levels: 1.0950 1.1000 1.1045
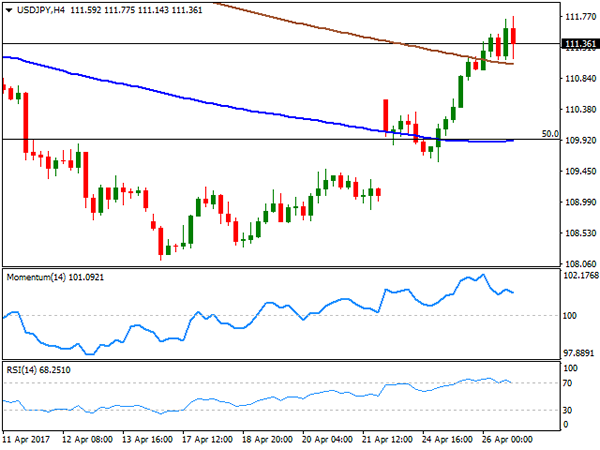
USD/JPY
The USD/JPY pair surged to its highest for this April, printing 111.77, before giving up some its daily gains, still closing in the green. The pair got a boost from a recovery in US Treasury yields, although they later give up after the US government announcement on the tax reform. The 10-year yield benchmark traded as high as 2.33% intraday, but pulled back to 2.31% after ahead of the close, weighing on the pair by the end of the US afternoon. The Bank of Japan will have its monthly monetary policy meeting during the upcoming Asian session, but is expected to maintain the status quo unchanged, with the pair's traders more focused on Thursday's US Durable Goods Orders for March. The positive tone of US equities, helped the pair to hold on to gains by the end of the day, although it's not enough to guarantee a similar advance in Asian equities. From a technical point of view, the 4 hours chart shows that the price held above its moving averages, with buying interest aligned around the 200 SMA, currently around 111.00, whilst technical indicators retreated modestly from extreme overbought readings, but are far from turning lower. Still, the pair needs to regain the 112.00 threshold to be able to extend its advance towards the 113.00 region.
Support levels: 111.05 110.65 110.20
Resistance levels: 112.00 112.45 112.85
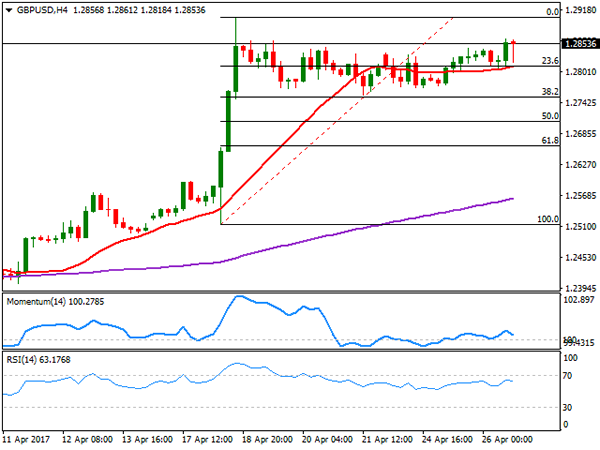
GBP/USD
The British Pound closed the day higher against its American rival, indifferent as usual to broad dollar's intraday demand. The GBP/USD pair traded as low as 1.2804 before recovering, still confined to a tight 60 pips range daily basis, amid the absence of UK macroeconomic news. In fact, UK's calendar will remain light until Friday, when the kingdom will release its preliminary Q1 GDP, with the economy expected to have grew just 0.4% in the three months to March. Trading at its highest for the week, the pair presents a neutral-to-bullish stance in the short term, given that in the 4 hours chart, the price held above the 1.2810 price zone, where the pair has is 20 SMA and the 23.6% retracement of its latest bullish run. In the same chart, technical indicators hold within positive territory, albeit with no certain directional strength, not enough to confirm further gains at the time being. The daily high was set at 1.2863, with further gains beyond it probably resulting in an advance towards 1.2903, this month high, en route to 1.2960.
Support levels: 1.2810 1.2775 1.2730
Resistance levels: 1.2865 1.2910 1.2660
GOLD
After printing a fresh 2-week low of $1,259.99 a troy ounce, spot gold managed to end the day with modest gains at 1,267.45. The mentioned low was achieved during the first half of the day, when hopes ahead of Trump's tax reform plan announcement led the dollar higher, although the momentum of the American currency faded after the official news. Limited physical demand in Asia also weighed on gold. Despite the late recovery, further weakness is expected for the bright metal, amid easing political woes around the world. From a technical point of view, the daily chart shows that the price is below a still bullish 20 SMA, this last at 1,270.90, whilst technical indicators turned flat within neutral territory. In the shorter term, and according to the 4 hours chart, however, the risk is towards the downside, given that the 20 SMA is crossing below the 100 SMA above the current level, while technical indicators lost upward strength within bearish territory, turning south ahead of the Asian opening.
Support levels: 1,259.90 1,250.70 1,242.50
Resistance levels: 1,270.90 1,278.10 1,288.20
WTI CRUDE OIL
West Texas Intermediate crude oil futures closed flat around $49.30 a barrel for a second consecutive gains, unable to hold on to intraday gains beyond the 50.00 threshold. The commodity surged up to 50.18 following the release of US stockpiles data, as the EIA reported a drawdown of 3.6 million barrels for the week ending April 21st. According to the same report, US crude inventories stood at 528.7 million barrels at the end of last week, near the upper seasonal limit, whilst gasoline inventories rose by 3.4 and distillates by 2.7 million barrels, these last denting the positive headline. The daily chart for US oil shows that the advance was contained by selling interest around the 200 DMA, whilst technical indicators have lost their bearish momentum, but remain within negative territory, maintaining the risk towards the downside. In the 4 hours chart, the price is below all of its moving averages, whilst the Momentum indicator stands in neutral territory and the RSI flat around 41, also favoring further slides, despite the current absence of directional strength.
Support levels: 48.85 48.30 47.70
Resistance levels: 49.80 50.30 51.00
DJIA
Having traded within positive territory for most of the day, US major indexes were unable to hold on to gains after Trump's announcement on a tax reform, closing marginally lower. The Dow Jones Industrial Average lost 21 points, to settle at 20,975.09, whilst the S&P lost 0.05%, to 2,387.45. The Nasdaq Composite closed flat at 6,025.23. Stocks eased after Treasury Steven Mnuchin and National Economic Director Gary Cohn released a one-page outline of the plan, failing to provide much detail, somehow disappointing investors. Among the DJIA, United Technologies was the best performer, adding 1.27%, followed by Verizon Communications that gained 1.24%, while Procter & Gamble led decliners, shedding 2.53%. The Dow maintains a positive tone daily basis and despite the intraday decline, as its well above its moving averages, whilst technical indicators have barely lost upward strength within positive territory, but are far from anticipating a downward move. In the shorter term, the 4 hours chart technical indicators head south within positive territory, still correcting overbought readings, but the index holds well above a bullish 20 SMA, this last at 20,863.
Support levels: 20,954 20,914 20,869
Resistance levels: 21,035 21,071 22,010
FTSE100
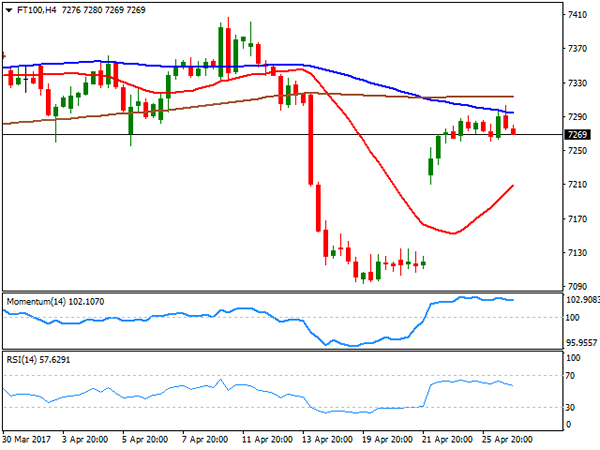
The FTSE 100 added 13 points or 0.18% to close at 7,288.72, but eased in after hours trading, heading into the Asian session at 7,263. The London benchmark benefited by a sharp advance in Standard Chartered that gained 4.01% after the release of its quarterly profit that nearly doubled from a year ago. The second best performer was chemical Croda International that gained 3.77%, also following the release of positive financial figures. Mining-related equities traded lower, after Fresnillo said that gold quarterly production decreased by 3.3%, ending the day 0.7% lower, although the worst performer was GlaxoSmithKline, down by 2.06%. Daily basis, the index is poised to fall further, as it remained contained below its 20 DMA, while technical indicators retreated from their mid-lines, although with limited bearish momentum. In the 4 hours chart, the index is below its 100 and 200 SMAs, but above a bullish 20 SMA, whilst technical indicators are correcting overbought conditions, heading lower within positive territory.
Support levels: 7,254 7,210 7,173
Resistance levels: 7,303 7,340 7,385
DAX
European equities posted a modest advance this Wednesday, with the German DAX ending the day at 12,472.80, up by 0.05%. A cautious stance prevailed ahead of the US President Trump announcement of a tax reform, with the index entering Asia with a soft tone amid easing positive mood. Deutsche Bank was the best performer, up by 2.05% followed by Infineon Technologies that added 1.05%. E.ON on the other hand, led decliners, ending the day down 1.37%. The daily chart shows that the index holds near its recent high and within a tight range, far above bullish moving averages, but with technical indicators easing within positive territory. In the 4 hours chart, technical indicators are barely correcting from extreme overbought readings, whilst the 20 SMA maintains its strong upward slope far below the current level, indicating that while the decline could extend short term, the long term outlook remains positive.
Support levels: 12,418 12,366 12,312
Resistance levels: 12,430 12,495 12,530
Commodities Tread Water In Asia
Trump's tax plans see the greenback strengthen and both oil and precious metal's rallies fizzle out.
Crude Oil
The turkey shoot that is the U.S. Crude Inventories produced another surprise overnight, with a drawdown of 3.6 million barrels against 1.75 million expected. This initially sent both Brent and WTI higher by over one dollar, with the spot levels failing just shy of 52.50 and 50.00 respectively.
The rally, however, was short-lived as traders noted that higher refinery demand had driven most of the drawdown and not end-user demand. Both contracts quickly fell back to close around 51.50 and 48.90 respectively on a spot basis.
For now, though, it is clear that the world has plenty of oil 'in stock,' making OPEC's life that much harder ahead of its June production cut rollover date.
Brent
Brent spot opens slightly higher in Asia at 51.70 with resistance at 52.50 and support at 51.20.
WTI
WTI spot opens at 49.00 with support clearly denoted at 48.70, its 200-day moving average and then 48.50 close behind. Resistance lies at the key 50.00 region, which it has tested and failed near two times this week already.
Precious Metals
Gold
Gold continued its recent trend of lower daily highs overnight, failing at the 1270 level to trade in early Asia around 1266. With the U.S. dollar resurgent after President Trump's tax announcements alongside equities, gold has struggled to make effective rallies as the previous week's geopolitical tensions fade from traders' minds.
From a technical perspective, gold still appears to be setting itself up for a meaningful correction lower with nearby support at 1254, the 200-day moving average, and then the key 1240 level. Gold has resistance at 1280 and then the 1296 area.
Intra-day, gold is locked in a 1260/1270 range with a break of either level probably seeing some stop-loss driven extension.
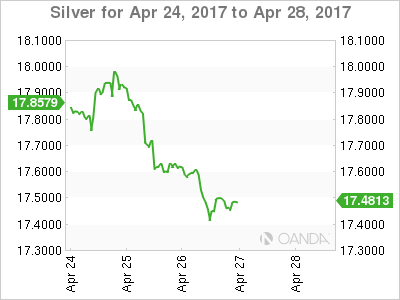
Silver
Following Tuesday's bearish outside reversal day silver continues to tread water. Like gold, it attempted a rally back over 17.6000, but this soon fizzled out. Silver is trading in Asia around its New York close at 17.4290 with support at 17.3850, the 100-day moving average. Behind this is yesterday's low at 17.3280 and then 17.2600.
Resistance lies at 17.6550 and then the 200-day moving average at 17.9660.
From a charting perspective, a daily close under the 100-dma would confirm the bearish outside reversal from Tuesday and imply that silver may see lower levels ahead.
Emerging Market Asia
Yuan
USDCNY fixed at 6.8896 today, +51 pips from last fixing and -12 pips from the previous closing at 6.8908 at 16:30 Beijing time. While the US Tax reform details remain elusive, the bottom line should be dollar positive. We’ve seen a move higher for the dollar on regional currencies as dollar demand is starting to perk up. Investor confidence in China will be fraught with uncertainty through 2017 as US interest rates are expected to rise, and mainland officials deal with the perils of deleveraging the China money ball. Restoring financial stability will be high on the politburo’s agenda.
Ringgit
The Ringgit opened lower against the US dollar this morning as the greenback picked up steam after the US tax reform announcements on Wednesday. While the Ringgit continues to benefit from the BNM proposed liberalisation of onshore markets, the currency will continue to feel the headwinds from oil price uncertainty. Regardless of the oil patch musing, outflows have subsided, and I suspect the market will re-engage the MYR for no other reason than the domestic capital markets are very much undervalued about its ASEAN counterparts.
Rupee
Inflow remains steady, and with rating upgrades perking up, we expect an increase in flow into the India Capital market that should keep the INR on a positive footing. However, with short dollar positioning a bit over stretched we could see some profit taking ahead of next week’s FOMC. With a positive interest rate carry environment, the short USDINR should remain favourable.
Won
Geopolitical headlines are weighing on the Won, and expectedly dealers were inclined to trim short dollar position. With Trump quashing the NAFTA chatter, it lessens the likelihood of Trade barrier escalation, which should be perceived as risk friendly for regional currencies