Sample Category Title
Summary 4/10 – 4/14
Monday, Apr 10, 2017
[php_everywhere] [/php_everywhere]
Tuesday, Apr 11, 2017
[php_everywhere] [/php_everywhere]
Wednesday, Apr 12, 2017
[php_everywhere] [/php_everywhere]
Thursday, Apr 13, 2017
[php_everywhere] [/php_everywhere]
Friday, Apr 14, 2017
[php_everywhere] [/php_everywhere].
Weekly Economic and Financial Commentary
U.S. Review
Smaller Job Gains Likely Temporary
- The nonfarm payroll gain for March came in at 98,000, much lower than the expected 180,000. However, the household series was unexpectedly strong. The jobless rate fell to 4.5 percent, while underemployment improved significantly, suggesting the labor market continued to absorb excess slack. Weather may have played a role in the soft payroll numbers; we expect job gains to ramp back up in coming months.
- Other data released this week point to an economy expanding solidly, though perhaps not as exuberantly as post-election sentiment measures suggested.
Reality Coming Into Focus
Since the U.S. election, we have noted that the surge in survey measures of the economy had not translated into much of an improvement in the hard data, which generally continued along a lackluster upward trend. Convergence of the two may be starting to take hold. Both ISM manufacturing and non-manufacturing headlines slipped slightly but continued to point to an expanding economy. Orders and shipments from U.S. factories continued to gain ground. The U.S. economy churned out just 98,000 jobs in March, slipping from February's strong read. A respectable drop in the unemployment rate, however, suggests improving labor market fundamentals, nonetheless. Taken together, data received this week show an economy that is expanding solidly even without the post-election bump suggested in survey data.
The six-month stretch of consecutive monthly increases in the ISM manufacturing headline ended in March, as the index dipped slightly from 57.7 to 57.2. Still, the measure of factory activity is solidly in expansion territory. Current production was the main drag on the headline, falling 5.3 points to a still-solid 57.6. Conversely, the employment index surged 4.7 points to 58.9. Factory demand was also boosted by the improving global economy; the new export orders index jumped 4 points to 59, the highest since 2013.
The ISM survey measure of non-manufacturing activity cooled more abruptly in March, with the headline index falling 2.4 points to 55.2. Current activity and new orders dipped but remained in expansion territory at 58.9. The employment index signaled slower hiring, falling from 55.2 to 51.6 in March. This morning's employment report echoed the slower hiring pace. The takeaway from both ISM surveys in March was that both sectors are firmly expanding but coming down from post-election highs.
The factory orders report this week was generally positive, with a headline gain of 1.0 percent in February while January was revised up to a 1.5 percent increase. Core capital goods orders are rising at a solid 9.4 percent three-month average annual rate, which bodes well for business spending in coming months. Core capital goods shipments, a proxy for business investment in GDP calculations, rose a solid 1.0 percent in February.
The U.S. trade balance narrowed more than expected in February. A drop in imported goods, specifically of autos and consumer products, was largely the cause of the narrowing on the month. Indicators of consumer demand have come in on the softer side thus far in 2017, and the weak Wards auto sales report for March suggested further downside risk to coming months. U.S. exports rose slightly in February, but growth was subdued, likely due to currency strength weighing on demand for U.S. made goods. On the bright side, the lower trade deficit will likely lessen the drag of net exports on Q1 GDP growth.
Robust job gains in January and February were followed by a 98,000-job gain in March, bringing the Q1 average down to 178,000 jobs. The household survey was significantly stronger, as the number of employed workers rose by 472,000 people, with fewer reporting underemployment.
U.S. Outlook
JOLTS • Tuesday
Job openings rose in January despite an outsized decline in federal government openings, perhaps reflecting the federal hiring freeze that began to start the year. Voluntary separations surged, pushing the total number of quitters to a cycle high. Through the monthly volatility, the labor market continued to add jobs in the first quarter, and the tightening labor market should spur a continued rise in the quit rate. Continued momentum in quits could presage a pickup in wage growth, which would support additional Fed rate hikes this year.
The National Federation of Independent Business Small Business Optimism Index is also released next Tuesday. As illustrated in the chart to the right, the share of small businesses claiming that positions are hard to fill is at a cycle-high, which corresponds with the steady decline in the number of unemployed persons per job opening from the JOLTS data.
Previous: 5.63M Openings
CPI • Friday
Base effects related to the slide in energy prices a year ago have driven the headline CPI higher on a year-over-year basis. Despite a modest 0.1 percent monthly gain in February, the year-ago pace of inflation jumped to 2.7 percent, the fastest since March 2012.
Through the volatility, the core index has continued to show steady gains. Core CPI inflation increased at a strong 3.0 percent annualized rate over the past three months, the fastest pace since January 2008. With both headline and core consumer prices increasing at more than a two percent pace, the Fed's belief that the inflation weakness of the past two years was transitory appears well-placed. Although the core PCE deflator, the Fed's preferred measure of inflation, remains a touch shy of the two percent mark, low inflation as a barrier to monetary policy tightening is increasingly a story of the past rather than the present.
Previous: 2.7% Wells Fargo: 2.6% Consensus: 2.6% (Year-over-Year)
Retail Sales • Friday
Upward revisions to January's retail sales reading helped offset some of the weakness in the initial February numbers. Higher energy prices have helped push retail sales higher, as gasoline station sales are up 19.6 percent year-over-year. Non-store retailers have continued their ascent, with sales up 13.0 percent over the past year. Building material, garden equipment and supply stores is another category that has outperformed of late, increasing at a robust 18.1 percent annualized rate over the past three months.
The retail sales control group, which feeds directly into GDP calculations, has increased at a 4.4 percent annualized rate over the past three months. While solid, in light of faster inflation and a slowdown in auto sales, the first quarter is likely to see a deceleration in real personal consumption from Q4. We look for real PCE to increase at just a 1.3 percent annualized rate in Q1.
Previous: 0.1% Wells Fargo: 0.0% Consensus: 0.0% (Month-over-Month)
Global Review
Foreign Economic Growth Remains Reasonably Solid
- The Tankan index of Japanese business sentiment, which has a reasonable degree of correlation with Japanese GDP growth, strengthened further in the first quarter. Acceleration in global economic activity is leading to strength in Japanese exports.
- Monthly economic indicators show that real GDP in the Eurozone grew at a modest pace in the first quarter as well, but the upcoming French presidential election poses a downside risk to the near-term economic outlook.
Foreign Economic Growth Remains Reasonably Solid
Recently released data suggest that the Japanese economy continues to expand, if only at a modest pace, in the first quarter. For example, the quarterly Tankan index, which has a fair degree of correlation with the year-over-year rate of Japanese real GDP growth, edged up in Q1 (see graph on front page). Although the outturn was not quite as strong as most analysts had expected, it represents the second consecutive quarter in which business sentiment has improved. Moreover, it suggests that real GDP growth in Japan may have strengthened a bit in the first quarter.
The Tankan survey contains a treasure trove of information about the Japanese economy, but the "headline" index measures sentiment among large manufacturers, businesses which tend to export. As shown in the top chart, real export growth in Japan strengthened in the first two months of the year, which is consistent with indicators of stronger global economic growth in recent months. Preliminary data on Japanese real GDP growth in the first quarter will be released next month, and we expect it will show some modest acceleration in economic activity in Japan. That said, our projection of 1.6 percent real GDP growth (yearover- year) is hardly "robust."
Monthly economic indicators show that real GDP in the Eurozone grew at a modest pace in the first quarter as well. Revised data confirmed that the respective purchasing managers' indices for the manufacturing and service sectors in the Eurozone remained at a 6-year high in March. Moreover, "hard" data generally point in the direction of modest economic growth in the first quarter. For example, the volume of factory orders in Germany rose 3.4 percent in February relative to the previous month. Although February's increase was not enough to compensate for the 6.8 percent decline that was recorded in January, orders are clearly trending higher. Indeed, factory orders were up 4.5 percent on a year-over-year basis in the December-to- February period (middle chart).
A rise in factory orders should signal stronger growth in industrial production (IP), which it already has as German IP rose 2.2 percent on a monthly basis in both January and February. Italy does not release its February IP data until next week, but the decline in the Italian unemployment rate to 11.5 percent in February - it was 12.0 percent as recently as November - suggests that overall economic growth in Italy was positive in Q1 (bottom chart). That said, an unemployment rate that remains in double digits indicates that economic activity in Italy, although growing at a modest pace, generally remains depressed. In that regard, the level of real GDP in Italy in Q4-2016 stood more than 7 percent below its 2008 peak.
Looking forward, we maintain a fairly constructive view for the economic outlook in the euro area, but the upcoming French presidential election poses a downside risk to the near-term economic outlook. In the seemingly unlikely event that the Eurosceptic Marine Le Pen is elected, investors would start to question the long-run viability of the monetary union. Stay tuned.
Global Outlook
U.K. Industrial Production • Tuesday
Industrial production (IP) in the United Kingdom fell 0.4 percent in January compared to a 1.1 percent print the month prior, marking the first decline in three months. Manufacturing output declined 0.9 percent month over month in January, after a 2.1 percent gain in December. Increases in utilities and energy production over the month were not enough to offset weakness in total production. However, some payback was expected after December's sharp increase, though the underlining trend still supports an increase in output. That said, markets look for IP to have grown by a 0.2 percent clip over the month and increase 3.7 percent on a year-ago basis in February.
Other data slated for release next week include producer price inflation and consumer price inflation; the latter which we expect to have increase by 2.2 percent year over year in February, a tad above the Bank of England's 2 percent target.
Previous: 3.2% Consensus: 3.7% (Year-over-Year)
Mexican Industrial Production • Tuesday
Mexican industrial production (IP) rose slightly in January, 0.1 percent from December, as the expansion of mining and manufacturing output was weighed down by declines in oil and gas production. In addition, utilities slipped over the month while construction remained flat. However, on a year-ago basis, overall production declined 0.1 percent from the slowdown in oil and gas production, which fell 11.9 percent. Manufacturing production saw a 4.3 percent gain over the year, helped by a boost in export demand and rose 0.5 percent from December. However, NAFTA renegotiations, which are expected to start later this year, could create some uncertainty in this sector.
Markets look for declining oil and gas production to constrain total production growth moving forward.
Previous: -0.1% (Year-over-Year)
Bank of Canada Bank Rate • Wednesday
Since lowering its overnight lending rate to 0.50 percent in mid- 2015, the Bank of Canada (BoC) has kept rates on hold. Economic growth in Canada has been well balanced. Consumer spending is elevated and inflationary pressures are expected to near the BoC's target range this year. Moreover, employment growth has remained firm, full-time hiring is starting to recover and the unemployment rate has fallen to its lowest rate in nearly two years. That said, we expect the BoC to keep rates unchanged at its meeting next week as the economy still has more room to grow. The BoC is also expected to release its revised economic projections for 2017 and 2018 at the meeting.
Housing starts will be released on Monday and markets look for starts to have increased to 212,000 units in March from a 210,200-unit pace in February.
Previous: 0.50% Wells Fargo: 0.50% Consensus: 0.50%
Point of View
Interest Rate Watch
FOMC Minutes: On Track For Further Rate Hikes this Year
Minutes from the March FOMC meeting released this week confirmed that the Fed has not been deterred in its plans to normalize policy by what looks to be another soft start to the year. As has become fairly typical in recent years, growth in the first quarter looks to have slowed sharply; our own estimate for Q1 GDP is currently at 0.5 percent annualized.
Echoing our own view, the first quarter slowdown in GDP looks temporary to Fed officials. As illustrated in today's household employment data, the unemployment rate continues to decline, even as participation has stabilized. Business investment is once again rising while inflation is slowly marching to the Fed's 2.0 percent target.
At the same time, risks to the outlook continue to look tilted to the upside. Although several participants looked to be coming to terms with the timing of any fiscal stimulus not occurring until 2018, most still see it as an upside risk to their forecasts.
Balance Sheet Adjustment on the Agenda
With the outlook for additional rate hikes this year on track, attention has shifted to the Fed's balance sheet. The minutes reiterated the view that the Committee would not change its current practice of reinvesting maturing debt "until normalization of the level of the federal funds rate was well under way."
However, the minutes also shed light on what the FOMC may consider "well under way." In a discussion over the balance sheet, most FOMC members viewed that adjustments to the Committee's stance on reinvestment would "likely be appropriate later this year."
The details, such as whether reinvestments would stop all at once or slowly be pared down and if Treasuries and MBS would be tackled simultaneously, have yet to be worked out. Nevertheless, the discussion, along with FOMC Vice Chair Bill Dudley's preview last week, is another sign that the FOMC's confidence in the economy is rising and the rate environment is slowly normalizing.
Credit Market Insights
Student Debt Impact on Housing
The importance of a college education has become evident through a widening earnings gap between those with a college degree and those without. With state educational funding declining and rising tuition costs, there is now a heightened dependence on student loans. It is important to understand how these trends will impact the economy moving forward, specifically the housing market.
Student loan debt represents 36 percent of all non-mortgage debt as of 2016, up from just under 12 percent in 2003. Research from the Federal Reserve Bank of New York shows educational attainment is positively correlated with homeownership, regardless of debt status. But, among college graduates, those holding student debt have lower homeownership rates than those without. Moreover, homeownership rates between graduates with upbringings above and below mean income are similar, strengthening the association between student debt and owning a home, an important source of wealth.
Homeownership's positive association with education and its negative one with student debt highlight the importance of making college financially affordable. Somewhat concerning is the increasing rate of student loan delinquencies, up to 11 percent in 2016 from just 6 percent in 2003. Changes in higher education financing could play an important role in the future of the housing market.
Topic of the Week
Boom or Bust?
The unprecedented size of the Baby Boomer generation allowed it to shape the United States economy. From the rise of female participation in the labor force to the housing bubble, the Boomers have been at the forefront of economic developments over the past half-century. As this generation approaches retirement, they will undoubtedly once again reshape the national economy.
Baby Boomers have greater retirement needs than previous generations. Boomer retirement savings will need to last an average of 19 years, or 5 years longer than the average retiree at the time of their birth. Despite this, Boomer savings accounts look to be inadequate - of those aged 55-64, median retirement savings were just $103,200, and just 60 percent of the age group have any retirement savings at all. In addition, there are signs of concern on each side of the Boomers' balance sheets. Home values, a primary source of wealth, declined by 22 percent for Boomers between 2007 and 2013. Boomers also carry more debt compared to previous generations. As of 2013, 79 percent of households age 55-64 held some type of debt, compared to roughly 67 percent in 1989. Home equity traditionally has been a primary source of both wealth and income. However, homeownership among Boomers has trended downwards and Boomer home values have yet to recover from the Great Recession.
So how will Boomers handle retirement given the above outlook? One way to ease the retirement shortfall will be for Boomers to work longer. This would not only give Boomers more income and time to save for retirement, but also decrease the number of years retirement savings would have to fund. Lastly, Boomers beginning to receive their Social Security payments will strain government finances. Social Security benefits will run dry in 2034, at which point a 21 percent cut in benefits would occur to bring spending in line with benefits.
The Weekly Bottom Line
HIGHLIGHTS OF THE WEEK
United States
- U.S. economic data disappointed on a variety of fronts this week, but much can be chalked up to weatherrelated disruptions to the data.
- A paltry 89k payrolls gain was the biggest disappointment, but we are inclined to look past one month's result and focus on a new cyclical low in unemployment and continued improvement in measures of underemployment. These should also help support a rebound in consumer spending through the remainder of 2017.
- In other news, the Fed is starting to discuss the process of unwinding its holdings of Treasuries and mortgage-backed securities (MBS). It pledged that moves will be well-telegraphed and are likely to start later this year.
Canada
- It is getting more and more difficult to ignore the good news out of the Canadian economy. This was evident again this week as labour market data showed a fourth straight month of consensus-busting job growth.
- The economy generated 19.4k jobs in March, almost all of them full-time (+18.4k). While the unemployment rate ticked up to 6.7% (from 6.6%), this was due to more people joining the labor market - arguably a good problem to have.
- Canada may have started the year with more slack than its southern neighbor, but the differential is closing. Even with a slowdown in economic growth relative to its recent torrid pace, slack is likely to continue to diminish. As it does, the case for the Bank of Canada to move off the sidelines will strengthen.
UNITED STATES - BLAME IT ON THE WEATHER
March payrolls data disappointed expectations, with only 98k new jobs in March, and downward revisions to hiring in January and February. A softer reading was expected after two heady months, but a 200+ reading in the closely watched ADP report earlier in the week had raised hopes. Hiring slowed across both the goods and services sectors, although it was more dramatic in services. Despite the unexpectedly weak payroll print, the household survey showed employment gain of 472k, pushing the unemployment rate down by 0.2 percentage points to 4.5%.
We are inclined to look past one month's payrolls disappointment. Weather played a role in the March data on two fronts. Unusually warm weather in January and February likely pulled forward activity in the construction sector. And, data on curtailment of hours due to bad weather was nearly ten times larger than average in March, impacting hours worked, earnings and potentially hiring.
The job market should continue to provide a solid foundation for consumer spending this year, with the unemployment rate near pre-recession lows in March, and continued improvement in measures of underemployment.
Other data this week confirmed that consumers took a breather once again in Q1, but we expect a rebound in spending in Q2, much like we saw last year. Q1 weakness has become a pattern. Consumer spending growth averaged 2% in Q1 over the past 4 years, while the other three quarters of the year have averaged above 3% (see chart). Eventually, this pattern will be fixed by adjustment to "seasonal adjustment," but for now we are inclined to discount Q1 weakness.
The Fed minutes also provided a peek into the FOMC's discussion of how and when it will start the process of normalizing its balance sheet, now that normalizing rates is underway. Through the course of its asset purchase program, the Fed accumulated $4.5 trillion in Treasuries and MBS. Since purchases ended, the Fed has been reinvesting the principal payments, keeping its balance sheet steady.
Although things are still at the discussion phase, Fed members already agree on a few things. First, the process of ending reinvestments should be gradual and predictable, and rely primarily on passive phasing out of reinvestments. Second, most members agreed that the change in reinvestment policy should come this year. Third, the FOMC was unanimous that any policy change should be well telegraphed to the public. Our recent forecast calls for the Fed to hike rates in two 25 basis point moves, likely in June and September, and then lay out the plan to start winding down reinvestments. Once reinvesting principal payments is completely phased out, the balance sheet will passively shrink as the securities mature.
Markets are watching closely since removing the Fed from these markets could reduce demand for these securities, lowering prices, and taking yields higher, all else equal. Our latest forecast calls for a continued rise in Treasury yields, and balance sheet normalization is one of the forces expected to take yields higher. The Fed has control of this process. If the Fed doesn't like the market reaction as it winds down reinvestments, it has the discretion to slow down or stop the pace of adjustment. This helps to mitigate the risks of an undesirable spike in yields.
CANADA - I GET KNOCKED DOWN, BUT I GET UP AGAIN
It is getting more and more difficult to ignore the good news out of the Canadian economy. This was evident again this week as labour market data showed a fourth straight month of consensus-busting job growth. The economy generated 19.4k jobs in March, almost all of them full-time (+18.4k). While the unemployment rate ticked up to 6.7% (from 6.6%), this was due to more people joining the labor market - arguably a good problem to have.
The positive turn in economic momentum has come as data in the United States has moved in the opposite direction. Job growth south of the border slowed in March to just 98k. On a year-on-year basis, employment growth in Canada has been running faster than in the United States for the past three months. The difference is not large, but it marks a change from the previous four years in which the U.S. was adding jobs at a relatively faster clip (Chart 1).
The divergence is not just a jobs story. Even with the pullback in exports in February that returned the country's trade balance to a slight trade deficit (following three months in surplus), Canada's economy is tracking growth of 3.4% (annualized) in the first quarter. Meanwhile, stateside, real GDP looks to advance by just 1.0%.
The outperformance in Canadian economic data relative to the U.S. may reflect the fact that Canada simply has a bigger hole to fill. Indeed, countries with more slack should be expected to grow relatively faster. Despite the slowdown in job growth in the U.S., the unemployment rate fell to 4.5% in March, widely considered its long-run (or natural rate).
Yet, it is not so straightforward to make the case that Canada has a lot more slack than America. On a comparable basis, the Canadian unemployment rate was 5.4% (seasonally adjusted) in March, 0.9 percentage points above the U.S. rate. But, Canadian unemployment rates have always run higher than U.S. rates. The current differential is the same as it was prior to the Great Recession, and lower than its longer-run historical average of 1.3 percentage points (Chart 2). By other metrics, the Canadian labor market is the tightest it's been since the recession. The employmentto- population ratio of core working age people (25 to 54) rose to 82.3% in March, its highest level since mid-2008.
The worry among policymakers is that Canadian economic growth is built on shaky foundations. Canada has seen false starts before - economic growth started last year with similar spark. However, that was largely an export story, and net-trade is likely to subtract from growth in the this year. At the same time, the current strength in key housing markets is unsustainable over the medium term, but there appears little on the horizon to impede near term momentum. Finally, government stimulus dollars should begin translating more meaningfully into activity this year, helping to maintain Canada's growth trajectory.
All told, Canada may have started the year with more slack than its southern neighbor, but the differential is closing swiftly. Even with a slowdown in economic growth relative to its recent torrid pace, slack is likely to continue to diminish. As it does, the case for the Bank of Canada to move off the sidelines will strengthen.
US Jobs Miss Raises Questions about Economy, Retail Sales and Inflation Next for Dollar
US jobs miss raises questions about economy
The US dollar will finish the week ending on April 7 on a high note despite the US non farm payrolls (NFP) missing expectations. The greenback is only lower against the JPY as other major pairs have fallen as risk aversion following the geopolitical events around the globe. The US airstrike against Syria in particular caused a wave of USD selling but as the day went on the currency recovered along with the risk appetite of investors. Members of the G7 will meet in Italy on Monday for a two-day prescheduled meeting that has risen in importance given current events.
US earnings seasons will kick off next week with Financials leading the charge. The sector has been one of the winners in the Trump trade and as such has suffered by the loss in momentum as the future of the pro-growth policies remains cloudy. Fed Chair Janet Yellen will speak on Monday with room for some insight on the Fed minutes released this week that show the central bank is debating on when to reduce the 4.5 Trillion bonds in its balance sheet.
The Bank of Canada (BoC) will release its monetary policy report on Wednesday, April 12 at 10:00 am EDT (2:00 pm GMT) with no change expected to the benchmark interest rate. The highlight of the week in economic data will be the US retail sales and inflation data to be published on Friday, April 14 at 8:30 am EDT (12:30 GMT). Employment gains in the United States continue to be solid despite the latest disappointing NFP report but it's worth noting that retailers lost 29,700 jobs in March after losses of 30,000 in February. Core inflation is forecasted flat at 0.0 percent while core retail sales could come in at 0.2 percent.
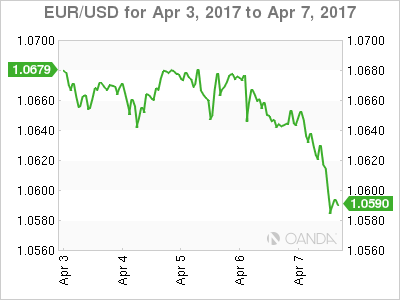
The EUR/USD lost 0.906 percent during the last five trading sessions. The single currency is trading at 1.0587 after the US dollar bounced back from overnight losses. The USD gained on both fronts against the EUR, when investors sought safety after the US airstrike against Syria they bought JPY, gold and US treasuries, even after a NFP miss the USD was bid as few institutional traders will leave longs ahead of a weekend after so much geopolitical anxiety. French elections concerns are lower after the latest televised debate, but situations in Italy and elections later in the year in Germany have not painted an encouraging scenario for European unity.
Mario Draghi said on Thursday that the policies of the European Central Bank (ECB) remain appropriate and even despite positive signs of recovery it is too soon to talk about reducing stimulus. This means that the divergence between the Fed and the ECB will only grow as the Fed slowly but surely continues on a tightening path while the ECB is still unsure when it will abandon its expansionary policies. Fed Chair Janet Yellen's words on Monday could further put the US central bank on a more proactive path than the ECB, who is still struggling with having a coordinated response when big members such as Germany haven't bought in to the long term plans.
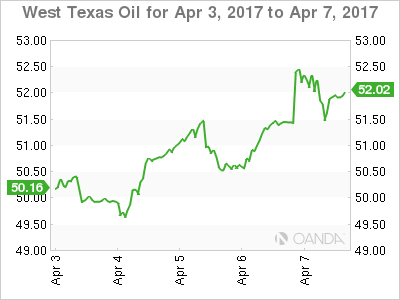
Oil prices in the US rose 3.368 percent during the last week. The price of West Texas is trading at $51.91 after the US attack on Syria made crude prices jump. Donald Trump made the call while hosting Chinese President Xi Jinping so political risk was already high.
There is ample evidence of oversupply in the market, yet the price is still rising even as there are more US producers waiting to ramp up production. Asian markets that have been limited by the OPEC cut, have turned to US oil which reduces the overall negative impact of increased US crude. China has surpassed Canada as the main destination of US oil.
A disruption in Canadian supplies after the shutdown of the Syncrude oilseeds facility in Alberta has also helped WTI march higher even before the fears of lower supply as a result of the US intervention in Syria.
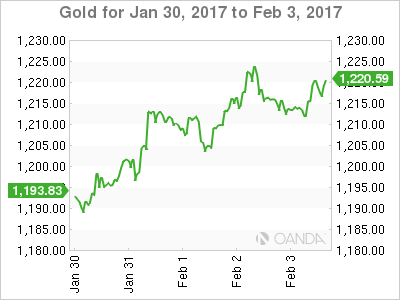
Gold rose 0.232 percent in the last five days. The price of the yellow metal is trading at $1,251.78 although intraday volatility on Friday had it as high as $1,270.64. The combined effect of the ongoing China-US summit in Florida, the US airstrike in Syria, the terrorist attack in Stockholm and the weaker than expected NFP jobs report had investors seeking a safe haven and flowing into gold.
Near the end of the Friday session the USD had managed to recover from overnight losses. The metal traded in a 2 percent range as geopolitical events reduced the risk appetite of market participants.
Market events to watch this week:
Monday, April 10
- 4:00pm USD Fed Chair Yellen Speaks
Tuesday, April 11
- 4:30am GBP CPI y/y
Wednesday, April 12
- 4:30am GBP Average Earnings Index 3m/y
- 10:00am CAD BOC Monetary Policy Report
- 10:30am USD Crude Oil Inventories
- 11:15am CAD BOC Press Conference
- 9:30pm AUD Employment Change
- Tentative CNY Trade Balance
Thursday, April 13
- 8:30am CAD Manufacturing Sales m/m
- 8:30am USD PPI m/m
- 8:30am USD Unemployment Claims
- 10:00am USD Prelim UoM Consumer Sentiment
Friday, April 14
- 8:30am USD CPI m/m
- 8:30am USD Core CPI m/m
- 8:30am USD Core Retail Sales m/m
- 8:30am USD Retail Sales m/m
*All times EDT
Elliott Wave View: Natural Gas Short-term
This is a quick update to the post from yesterday where we called blue (x) completed in Natural Gas (NG #F) at 3.235. However, price has been unable to break higher so far and after a failed test of 3.347 peak, we have seen another dip and a double three Elliott wave correction in wave (x) now seems more likely towards 3.235 - 3.208 area which is 50 - 61.8 Fibonacci retracement area of the rally from 3.122 low. From this area and as far as pivot at 3.122 low remains intact, we can expect Natural Gas to turn higher again and reach the target between 3.45 - 3.587 are from where a larger 3 wave pull back can be seen at least to correct the cycle from 3/17 (2.882) low if not from 2/22 (2.523) low.
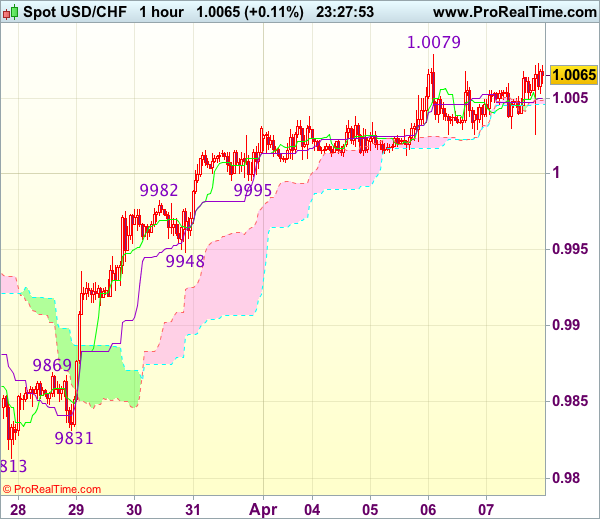
Trade Idea Wrap-up: USD/CHF – Buy at 0.9950
USD/CHF - 1.0063
Most recent candlesticks pattern : N/A
Trend : Near term up
Tenkan-Sen level : 1.0050
Kijun-Sen level : 1.0050
Ichimoku cloud top : 1.0050
Ichimoku cloud bottom : 1.0046
Original strategy :
Buy at 0.9950, Target: 1.0050, Stop: 0.9915
Position : -
Target : -
Stop : -
New strategy :
Buy at 0.9950, Target: 1.0050, Stop: 0.9915
Position : -
Target : -
Stop : -
The greenback remained confined within near term established range and further sideways trading is in store before recent rise from last week’s low at 0.9813 resumes, above resistance at 1.0079 would extend further gain to previous resistance at 1.0109, however, loss of upward momentum should prevent sharp move beyond latter level and reckon 1.0140-50 would hold, risk from there has increased for a retreat to take place later.
In view of this, would not chase this rise here and would be prudent to buy dollar on pullback as support at 0.9948 should limit downside. Below 0.9925-30 would abort and signal top is formed instead, bring correction to 0.9905-10 but reckon previous resistance at 0.9869 would hold from here.
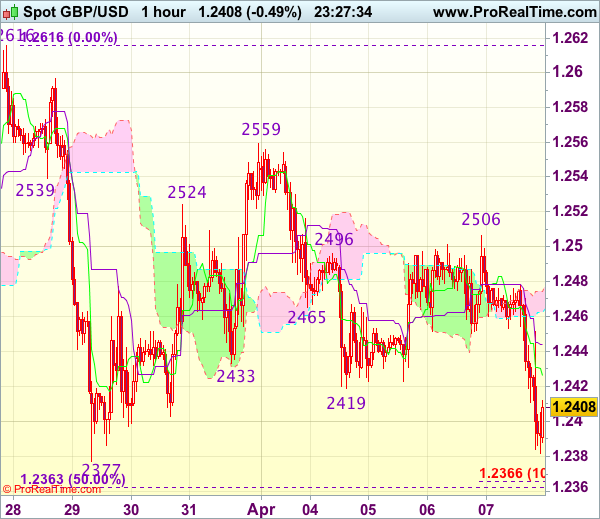
Trade Idea Wrap-up: GBP/USD – Sell at 1.2450
GBP/USD - 1.2399
Most recent candlesticks pattern : N/A
Trend : Near term down
Tenkan-Sen level : 1.2426
Kijun-Sen level : 1.2441
Ichimoku cloud top : 1.2478
Ichimoku cloud bottom : 1.2465
Original strategy :
Sell at 1.2450, Target: 1.2350, Stop: 1.2485
Position : -
Target : -
Stop : -
New strategy :
Sell at 1.2450, Target: 1.2350, Stop: 1.2485
Position : -
Target : -
Stop : -
As the British pound has dropped again and broke below indicated feel at 1.2400, adding credence to our view that rebound from 1.2377 has ended at 1.2559 and reset of this level would be seen, however, break there is needed to confirm early fall from 1.2616 has resumed for weakness to 1.2350, then towards 1.2325-30 but near term oversold condition should limit downside today and reckon 1.2300 would hold from here.
In view of this, would not chase this fall here and would be prudent to sell cable on recovery as 1.2450-60 should limit upside. Above 1.2480 would defer and suggest low is formed instead, risk test of resistance at 1.2506 first, break there would confirm, then a stronger rebound to 1.2525-30 would follow.