Sample Category Title
Foreign Exchange Market Commentary: EUR/USD, USD/JPY, GBP/USD, GOLD, WTI CRUDE, DJIA, FTSE 100, DAX
EUR/USD
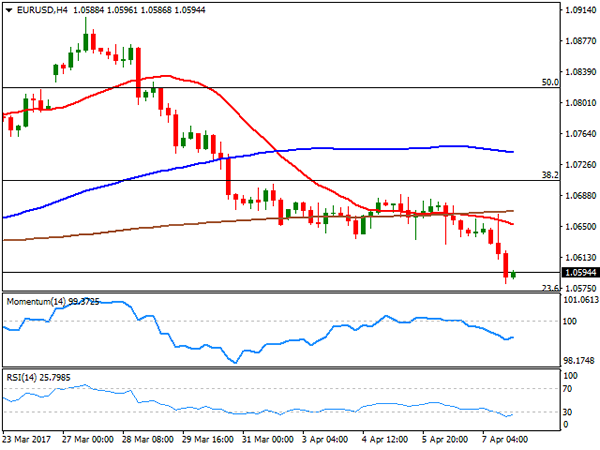
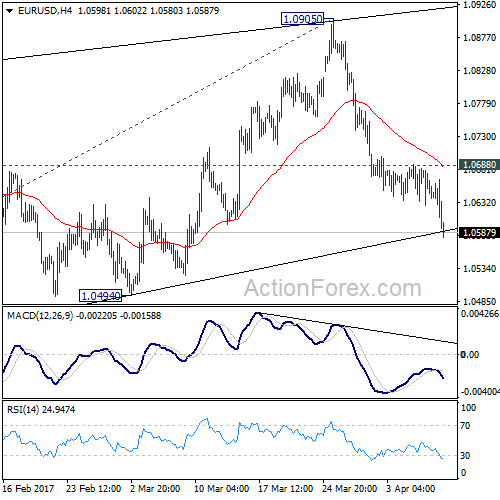
The EUR/USD pair broke below the 1.0600 level and reached a fresh 4-week low of 1.0580 in the US afternoon, with the greenback ending the week higher against most of its major rivals, with the exception of the Japanese yen. At the end of quite a choppy trading week, the American dollar gathered momentum, even despite the release of a soft US employment report. According to official numbers, the US economy added 98,000 new jobs in March, whilst February figure was downwardly revised from 235K to 219K. The unemployment rate fell to 4.5%, its lowest in near ten years from previous 4.7%. Wages rose by 0.2% in the month, while average hourly earnings up 2.7% on an annualized basis. The disappointment was quickly blamed to bad weather, and read as not enough to pushed the Fed away from its tightening path, favoring an already demanded greenback.
Risk aversion has also benefited the American currency during the first half of the day, after Trump launched a military strike on Syria early Asia, in response to the chemical attack from earlier this week, tautening its relationship with Russia. A terrorist attack in Stockholm fueled the negative sentiment, although a positive reaction of Wall Street to the Nonfarm Payroll report, offset the sour mood.
The EUR/USD pair is poised to extend its decline during the upcoming week, given that in the daily chart, it settled below its 100 DMA for the first time in over a month, whilst technical indicators head south within negative territory, also at fresh 1-month lows. Shorter term, the 4 hours chart shows that the price finally extended below its 20 and 200 SMAs, with the shortest gaining downward scope, whilst the RSI indicator maintains its strong downward slope near 23. The pair has quite a relevant support at 1.0565, the 23.6% retracement of the post-US election decline, with a break below it opening doors for a steeper decline afterwards, with the market then eyeing 1.0490, February monthly low.
Support levels: 1.0565 1.0525 1.0490
Resistance levels: 1.0620 1.0670 1.0710
USD/JPY
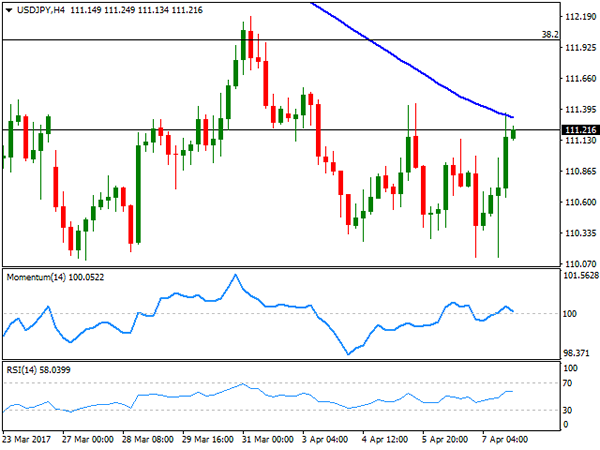
The USD/JPY pair closed the week pretty much flat around 111.20, recovering on Friday after testing 110.12 on the back of bouncing yields. US Treasury yields plunged immediately following the release of a soft US Nonfarm Payroll report to their lowest since last November, with the 10-year note benchmark tumbled to 2.29% before recovering to 2.37%. During the Asian session, news shown that Japan's leading index dropped to a 3-month low in February, to 104.4 from 104.9 in January, although the coincident index, which reflects the current economic activity, came in at 115.5 in February, in line with expectations, up from 115.1 a month ago. The pair advanced late Friday as the dollar index regained the 101.00 threshold but settled below 111.60 a strong static support. Technically, the daily chart shows that the price is still well below a flat 100 DMA around 114.40, whilst technical indicators have recovered from oversold readings, but remain within negative territory, not enough to confirm further gains. Additionally, the pair stands below 112.00 the 38.2% retracement of late 2016 monthly run, and the level to surpass to consider a more constructive outlook.
Support levels: 110.95 110.50 110.10
Resistance levels: 111.60 112.00 112.50
GBP/USD
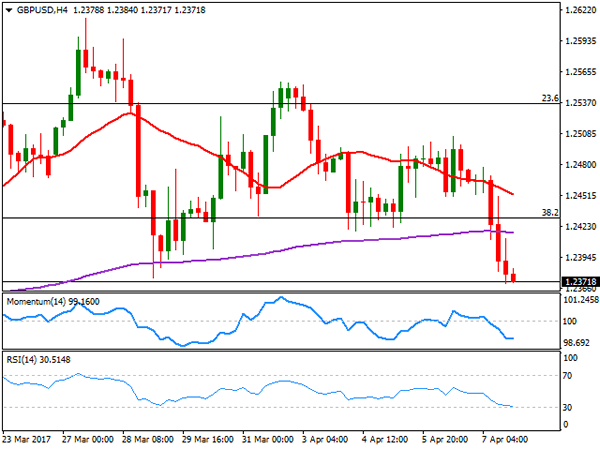
The GBP/USD pair closed the week sharply lower, settling a fresh 2-week low of 1.2370, as renewed dollar demand combined with poor UK macroeconomic data released last Friday. During February, manufacturing production fell by 0.1% monthly basis, ending up 3.3% when compared to a year earlier, while industrial production fell by 0.7% in the month, against expectations of a 0.2% advance. Also, the deficit on trade in goods and services widened to £3.7 billion in February from a revised deficit of £3.0 billion in January. Finally, the NIESR GDP estimate for the three months to March showed that the economy grew by 0.5% in the period, whilst the previous three-month figure was revised to 0.5% from 0.6%, overall indicating that the economy lost momentum by the end of the first quarter. Technical readings in the daily chart favor a bearish continuation for the upcoming days, as the price broke and accelerated below its 20 SMA, whilst technical indicators entered bearish territory, maintaining strong downward slopes. Shorter term, the 4 hours chart shows that the price extended below a bearish 20 SMA and the 200 EMA, whilst technical indicators maintain their bearish slopes near oversold territory, in line with the longer term outlook.
Support levels: 1.2330 1.2290 1.2250
Resistance levels: 1.2410 1.2450 1.2495
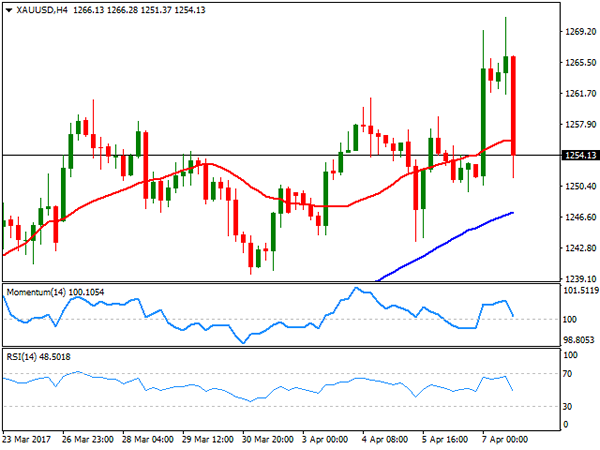
GOLD
Gold surged to a fresh 2017 high of $1,270.94 a troy ounce, underpinned by risk aversion at the beginning of the day. The US strike on a Syrian airbase pushed investors into safe-haven assets, but sentiment flipped after the release of US employment data, tepid, but not enough to deviate Fed's from the raising rates' path, which resulted in a stronger USD and a recovery in US equities. The bright metal trimmed most of its daily and weekly gains, but managed to close marginally higher in both cases. From a technical point of view, the metal held above all of its moving averages, with the 20 DMA heading north around 1,246.20, whilst the Momentum indicator is aiming to bounce from its 100 level and the RSI indicator turned modestly higher around 60. In the 4 hours chart, the price settled below a bullish 20 SMA whilst technical indicators turned sharply lower and are crossing their mid-lines towards the downside, indicating that the commodity may extend its slide, particularly on a decline below the mentioned 1,246.20 level.
Support levels: 1,246.20 1,239.60 1,230.00
Resistance levels: 1,258.30 1,263.80 1,271.00
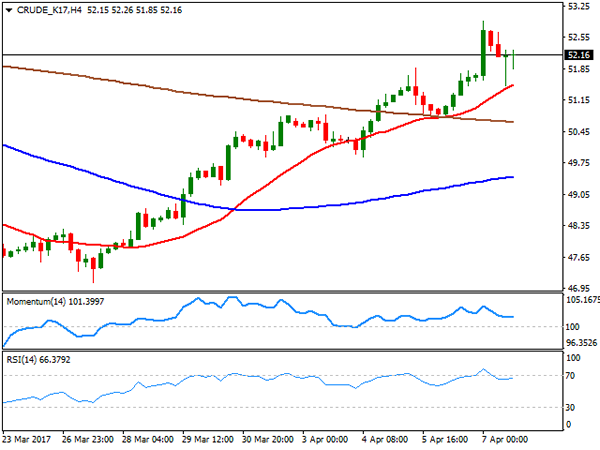
WTI CRUDE
Crude oil prices rallied to fresh 1-month highs this Friday on news that the US fired missiles at a Syrian government air base, raising concerns over a possible output disruption in the oil-rich region. West Texas Intermediate futures traded as high as $52.92 a barrel, but eased from the level as the dollar strengthened in the US session, whilst the Baker Hughes report showed that the number of active rigs drilling oil in the world's largest economy rose by twelfth consecutive week, up by 10 to 672. The black gold settled above 52.00, bullish according to technical readings, given that in the daily chart, it settled around its 100 DMA whilst the Momentum indicator stands flat well above its 100 level, but the RSI indicator keeps heading north around 64. In the 4 hours chart, an early decline was contained by a bullish 20 SMA, whilst technical indicators have lost directional strength, but hold within positive territory, all of which maintains the risk towards the upside.
Support levels: 51.30 50.80 50.30
Resistance levels: 52.20 52.90 53.6
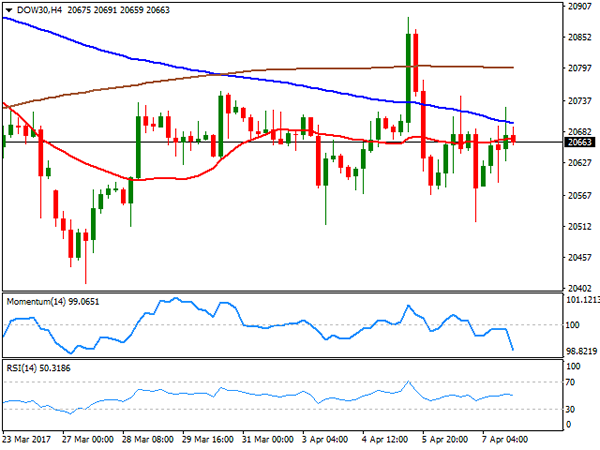
DJIA
Wall Street closed flat on Friday, daily and weekly basis, with the DJIA down 6 points, to 20,655.96, and the Nasdaq Composite and the S&P shedding 1 point each, to end at 5,877.81 and 2,355.55 respectively. Stocks were unable to find direction, on hold at the beginning of the week amid pending first tier-data and trapped on Friday between risk aversion, and a stronger dollar, resilient to tepid employment figures. Most members were up within the Dow, with Wal-Mart leading advancers by gaining 2.10%, while El du Pont was the worst performer, ending the day 0.79% lower. The index heads into the next week with a neutral stance, as in the daily chart, it held right below a modestly bearish 20 DMA, whilst technical indicators remain stuck within their mid-lines, lacking directional strength. In the 4 hours chart, the index hovers around a flat 20 SMA but below a modestly bearish 100 SMA, whilst technical indicators head south within bearish territory, leaning the scale towards the downside.
Support levels: 20,616 20,562 20,515
Resistance levels: 20,720 20,754 20,790
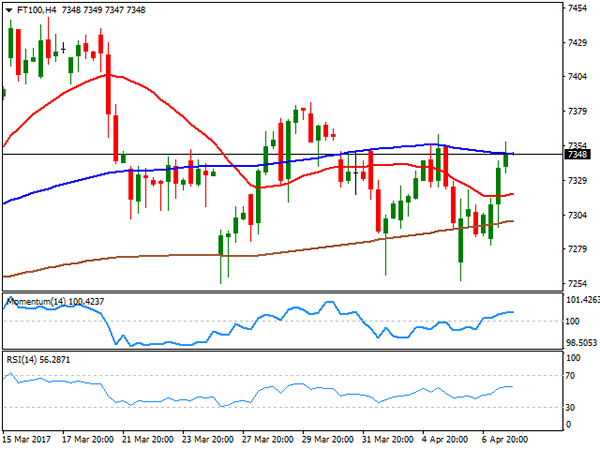
FTSE 100
The FTSE 100 closed higher on Friday, adding 46 points or 0.63% and ending the week at 7,349.37, backed by a strong advance in defense stocks. Randgold Resources was the best performer, adding 4.29% on gold's rally to fresh yearly highs amid ongoing risk aversion, followed by Standard Life, which added 3.63%. Financial and health care-related equities were the worst performers, with EasyJet leading losers' list, down by 1.60%, followed by Lloyds Banking Group that lost 0.90%. The index ended the week pretty much flat, and with a limited upward potential according to the daily chart, as the advance was contained by a horizontal 20 SMA, whilst technical indicators turned modestly higher within negative territory, with not enough strength to confirm further advances. In the 4 hours chart, the benchmark maintains a neutral stance, contained between its 100 and 200 SMAs, and with technical indicators flat right above their mid-lines.
Support levels: 7,254 7,210 7,173
Resistance levels: 7,357 7,385 7,434
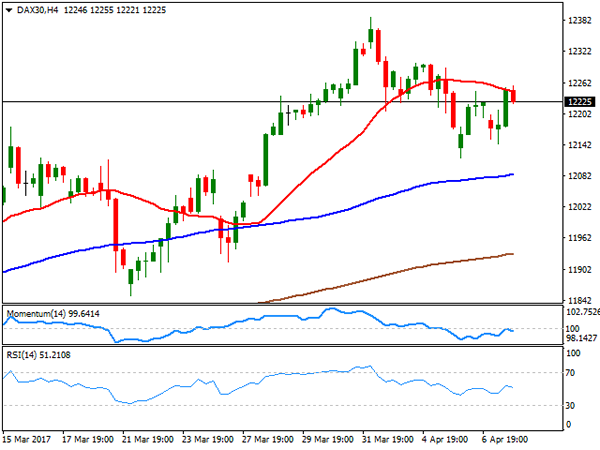
DAX
European indexes closed mixed on Friday, and not far from their daily openings, as a mixed US employment report offset early risk aversion. The German DAX closed at 12,225.06, down roughly by 6 points, helped by upbeat local data, as Industrial production rose 2.2% surpassing expectations of a slight contraction, whilst the trade balance printed a €19.9bn surplus on rising exports. Vonovia led advancers, adding 0.96%, followed by Heidelberg Cement that added 0.87%. Deutsche Lufthansa was the worst performer, ending down 2.53%, followed by Commerzbank that shed 0.87%. The index settled lower for the week after posting a fresh 2-year high, but overall the movement seems corrective, as the dominant bullish trend remains firm in place, given that in the daily chart, the benchmark is far above a strongly bullish 20 DMA, whilst the RSI indicator consolidates within neutral territory. In the 4 hours chart, however, the index remained contained by a bearish 20 SMA, whilst technical indicators retreated modestly after failing to overcome their mid-lines, indicating a probable downward correction ahead.
Support levels: 12,195 12,137 12,096
Resistance levels: 12,245 12,290 12,341
Market Morning Briefing: Despite Weaker Than Expected
STOCKS
The 20780-20410 range is holding well for Dow (20656.10, -0.03%) just now. The last 2 daily candle formation indicates a stable movement in the near term. We may expect some sideways consolidation in the coming sessions.
Dax (12225.06, -0.05%) is trying to move up towards 12400 while above support near 12090. Near term looks bullish.
Shanghai (3279.17, -0.23%) is trading just below 3300 levels last seen in Nov’16 and if no immediate rejection is seen, it could rally towards 3400 in the near term.
Nikkei (18786.72, +0.65) has bounced back above 18650 and could move up towards 19150 levels in the near term. While the dollar remains strong, Nikkei could remain stable in the broad 19200-18650 region for some time.
Nifty (9198.30, -0.69%) has immediate support near 9150-9100 region which if holds could take the index to higher levels in the coming sessions. Near term looks potentially bullish.
COMMODITIES
Gold (1250) was almost unchanged and trading within a range of 1236-62. We continue to look for a close above 1260 levels in the near term to take fresh buy positions. But before that it may spend a few sessions within the 1236-62 regions.
Silver (17.95) has tested its resistance at 18.50 but unable to gather momentum to close higher. Immediate trading range could be 17.80-18.30. Overall we need to wait for confirmation for immediate directional clarity.
Copper (2.62) has been stuck in the range of 2.55-2.70 for 6th consecutive week running with no visible intent for a breakout. The horizontal trading may go on for another week. In the medium term 2.55-57 are going to be a strong support now but a close below that could open up 2.50 and 2.45 levels respectively.
Oil prices were firm, supported by geo-political uncertainty in Syria, although another rise in U.S. drilling activity kept a lid on gains.
Brent (55.30) and WTI (52.34) are hovering around their major resistances of 55.50 and 52.50 respectively, and a close above that could open up higher resistances of 57 and 54. While 55.50 for Brent and 52.50 for WTI may hold for a few sessions, considering the short term overbought state, but the chances of seeing higher levels can't be ruled out.
In case of any surplus in U.S crude inventories, the upside in the near term may be limited to 56 and 53. The trend is bullish in the near term time frame and any corrective fall may add fresh longs at the lower levels.
FOREX
Despite weaker than expected jobs report last Friday and geopolitical tension over Syria and North Korea, the markets are resilient and showing increased risk appetite, boosting the Dollar and weakening the Yen.
Dollar Index (101.32) has achieved our immediate upside targets of 101.35 and now may test the resistance of 101.55-75 before it can attempt 102.10-25 levels.
Euro (1.0575) has met all our downside targets till 1.0580 but if the immediate support 1.0550 fails to hold, then further decline to 1.0450 is possible too. Euro bulls need to defend 1.0550.
Not taking any firm bearish stance in Dollar Yen (111.48) paid off as it bounced exactly from our support of 110.10 but it must overcome the immediate resistance near 111.60 before further upside to 112.20 and higher levels come into consideration.
Pound (1.2377) has resolved the Triangle pattern discussed last week to the downside but the support of 1.2350 is intact yet below which comes the major support of 1.2300. To keep any upside possibilities open in the near term, the support of 1.2300 must hold, otherwise much lower levels may open up.
Aussie (0.7478), contrary to expectations, has broken below the support of 0.7500 and now the decline may extend to 0.7450 or even 0.7375 in the coming days, especially if Copper (2.627) breaks below the support of 2.60-57 (Check Commodities section)
Dollar-Rupee (64.28) has achieved all our downside targets till 64.20 and now there are chances of seeing 64.60 in the next 1-2 sessions but higher levels may come into consideration only on a rise above 64.60. In case 64.20-15 fails to hold, the decline may extend to 64.00 and then 63.65-55.
INTEREST RATES
The US yields have bounced from support levels as expected and could continue to rise in the coming sessions. The 5Yr (1.94%), 10YR (2.40%) and 30Yr (3.02%) are up from 1.92%, 2.38% and 3.01% and could rise towards 2%, 2.5% and 3.105 respectively.
The German-Us 2Yr (-2.11%) and the 10Yr (-2.16%) are both falling sharply and if it continues to fall, it could push euro towards 1.050 in the near term.
The US-Japan 10Yr (2.35%) has risen from horizontal support coming from Feb’17 near 2.25% and while that holds, it could move up towards 2.4% keeping the Yen weak and Nikkei at higher levels.
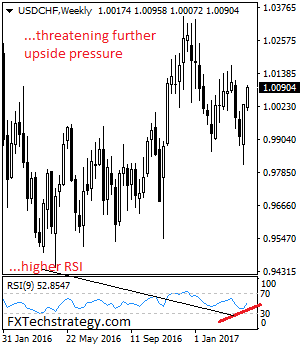
USDCHF – Bullish, Recovers Further Higher
USDCHF - The pair looks to recover further following a follow through higher the past week. On the downside, support lies at the 1.0000 level. A turn below here will open the door for more weakness towards the 0.9900 level and then the 0.9950 level. On the upside, resistance resides at the 1.0150 level where a break will clear the way for more strength to occur towards the 1.0200 level. Further out, resistance comes in at the 1.0250 level. Its weekly RSI is bullish and pointing higher suggesting further strength. All in all, USDCHF faces further price recovery.
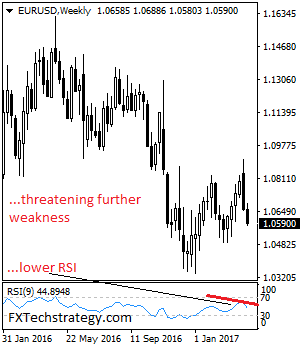
EURUSD – Bearish, Sees Second Weak Of Weakness
EURUSD - With the pair weakening further the past week, more decline is envisaged in the new week. Resistance comes in at 1.0650 level with a cut through here opening the door for more upside towards the 1.0700 level. Further up, resistance lies at the 1.0750 level where a break will expose the 1.0800 level. Conversely, support lies at the 1.0550 level where a violation will aim at the 1.0500 level. A break of here will aim at the 1.0450 level. Its weekly RSI is bearish and pointing lower supporting this view. All in all, EURUSD faces further bear threats in the new week.
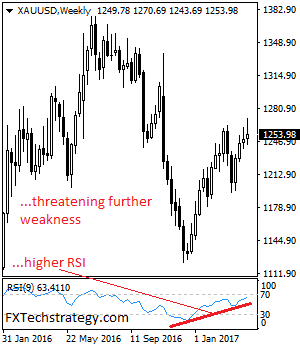
GOLD – Rejects Higher Prices, Vulnerable
GOLD - The commodity faces downside pressure after rejecting higher prices the past week. as it retains its medium term uptrend. On the downside, support comes in at the 1,250.00 level where a break will turn attention to the 1,240.00 level. Further down, a cut through here will open the door for a move lower towards the 1,230.00 level. Below here if seen could trigger further downside pressure targeting the 1,220.00 level. Conversely, resistance resides at the 1,260.00 level where a break will aim at the 1,270.00 level. A turn above there will expose the 1,280.00 level. Further out, resistance stands at the 1,290.00 level. All in all, GOLD looks to strengthen further but with caution.
EUR/USD Weekly Support Into French Election
With forex brokers and traders all talking about the upcoming French Election, it is an ideal time to take a closer look at EUR/USD.
Starting with the higher time frame, weekly chart, we can see that EUR/USD has depreciated sharply over the last couple of years, with exaggerated moves following Brexit and the Trump election.
The top of the above weekly support zone is just this EUR/USD 4 hourly support that we spoke about on the blog following the Fed's rate hike and subsequent small rip (you can click that highlighted link to go back and view the charts we from the start of March and then carry on to what we see today), but overall EUR/USD has been in overall decline for a very long time:
EUR/USD Weekly:
Drilling in a little further and taking a look at an intraday, 4 hourly chart, we can see that on the way back down toward the support zone, it is now also testing trend line support:
EUR/USD 4 Hourly:
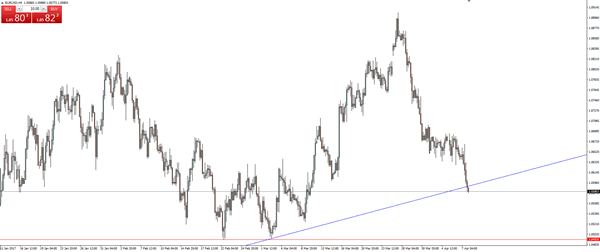
Zoom out on your own MT4 charts and you can clearly see the lows that I used to draw the line. There are obviously a few slight variations that you could use to draw the line, but that's just the subjective nature of trend lines and part of the game.
The trend line is obviously very subjective, so for me it's now all about whether EUR/USD can bite here while it's still above the weekly support zone and ultimately find some short term resistance turned support to kick off of.
There are a few scenarios that we will look to go over on social media, so make sure you send us some screenshots of your charts so we can share them with the forex trading community.
Dollar Surged and Yield Rebounded after a Dramatic Week of Negative News, More Upside ahead
Action Insight Weekly Report
Dollar Surged and Yield Rebounded after a Dramatic Week of Negative News, More Upside ahead
"The market is always right". That's by no means saying that the market is efficient, that's a topic for the academics. But, the market always move with certain underlying forces. We may or may not always understand why stocks, yields, currencies commodities move that way. It doesn't matter. And indeed, the voice of the market is usually the loudest when it does something that doesn't make sense. It's up to us to hear it or ignore it. And, reading news is not about reading the news but the reactions to the news. It's our choice to see the reactions, or just to criticize the reactions.
So coming back to "reality", we've got a very dramatic week, especially towards the end. And news were indeed rather negative to Dollar. US launched military strike in Syria and relationship with Russia tensed up after that. Russia even condemned that US is just "one step away" from war. The highly anticipated summit between US President Donald Trump and Chinese President Xi Jinping ended with "very frank, very candid" discussions. But then? Nothing more. Non-farm payroll grew a mere 98k in March even though unemployment rate dropped to 10 year low.
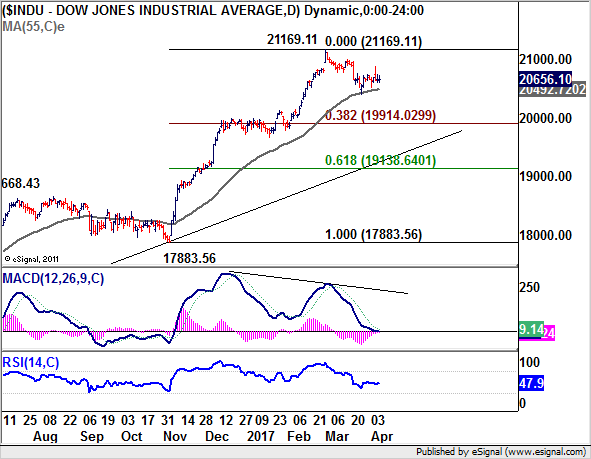
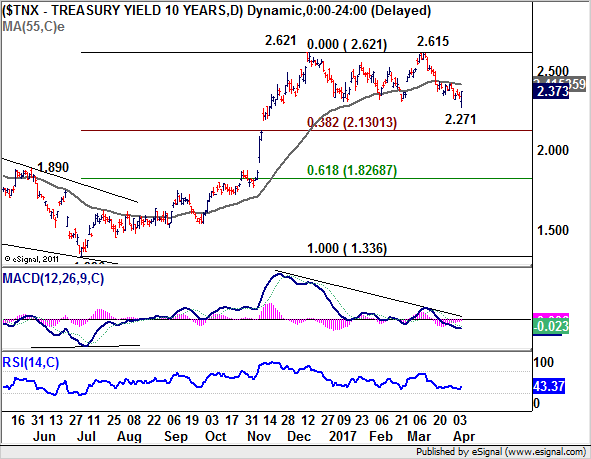
How did the markets respond? DJIA closed down -0.03% on Friday at -20656.10, and down -7.12 pts only for the week. S&P 500 closed down -0.08% on Friday to 2355.54, down the week by -7.18 pts for the week. 10 year yield dived to as low as 2.271 on Friday but closed the day up 0.030 at 2.373, down -0.023 for the week. Dollar index gained 0.46 on Friday to close at 101.13, up from prior week's 100.56. The resiliences in stocks, rebound in yields and the surge in Dollar were impressive. And these developments argue that, maybe those news were not bad news at all.
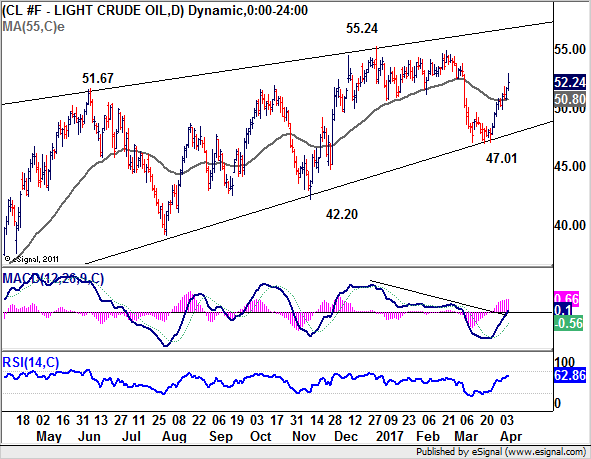
One of the explanations could be found in the jump in oil price on geopolitical risks. Energy stocks' rally somewhat offset losses in financial stocks. And technically, WTI crude oil maintained a higher high, higher low pattern and is back above 55 day EMA. It should now be heading back to 55.24 resistance and above to extend the larger up trend. And with that, upside pressure on headline inflation could be revived that would eventually pass through to underlying inflation.
DJIA's rebound attempt failed after hitting 20887.50 last week and retreated. While we expected a deeper decline in the index to extend the fall from 2116.11, it didn't happen. Instead, DJIA is holding well above 55 day EMA. It's far from certain that the pull back from 2116.11 is over. But the odds for testing 2116.11 or 19914.03 fibonacci level look even at this point.
10 year yield breached 2.314 and fell to as low as 2.271. But the single day reversal on Friday now suggests short term bottoming. Focus is back on 55 day EMA at 2.415 this week. And decisive break there will pave the way back to retest 2.615 high.
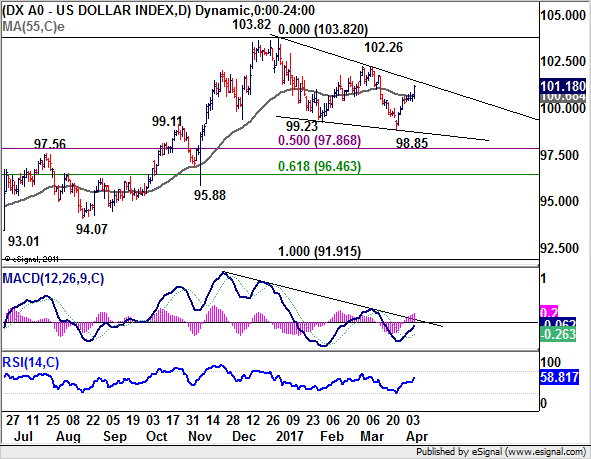
The rebound in TNX was also accompanied by strong rally in Dollar index. 55 day EMA is firmly taken out. And the development now favors the case that pull back from 103.82 is already completed with three waves down to 98.85. Focus will now be on 102.26 resistance this week and break there could pave the way through 103.82 high to resume the larger up trend.
Overall, with bearish dollar news in the back ground, the bullish development in Dollar and yields suggest that the greenback could be ready for a sustainable rise, at least in near term. We'll closely monitor the developments. But for now, we'll be looking at Dollar long opportunities.
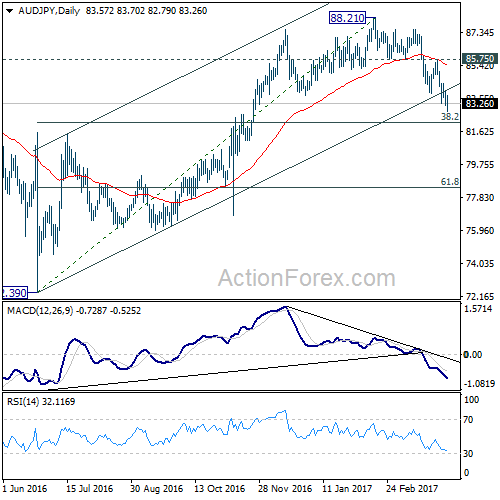
To close AUD/JPY short
Regarding trading strategy (refer to last week's report), we sold AUD/JPY at weekly open at 84.90 last week. The bearish view proved to be correct so far as the cross dived to as low as 82.79 before closing at 83.26. Technically, we still believe that AUD/JPY's rebound from 72.39 has completed at 88.21. And deeper fall would be seen to 38.2% retracement of 72.39 to 88.21 at 82.16 and below. However, considering the possibility of reversal in treasury yield, a rebound in USD/JPY could pull other yen crosses higher. Therefore, we'll just close the AUD/JPY short position at market this week to capture the profits first.
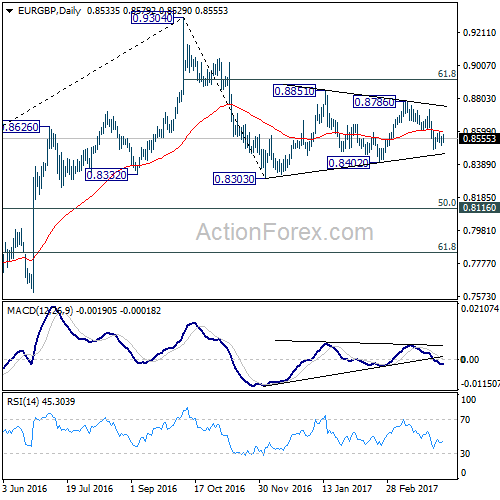
To close EUR/GBP short too
Also, we sold EUR/GBP at 0.8550 (stop at 0.8610) as the cross recovered. The cross engaged in sideway trading most of the week. Technically speaking, we're favoring the case that consolidation pattern from 0.8303 is completed at 0.8786 already. But we cannot ruled out the case of one more rising leg before fall from 0.9304 resumes. Also, we'd anticipate market's focus to return to Dollar strength this week. And, EUR/GBP would possibly just stay sideway, with prospect of a stronger rise. Hence, we'll close the position at market when the week opens and look for opportunity elsewhere.
To sell EUR/USD for 1.0339 and below
Instead, we'll sell EUR/USD at market this week, with a stop at 1.0690, above 1.0688 resistance. 1.0494 support is the first target. But we're actually looking at holding the short position through 1.0339 low if it develops as we expect.
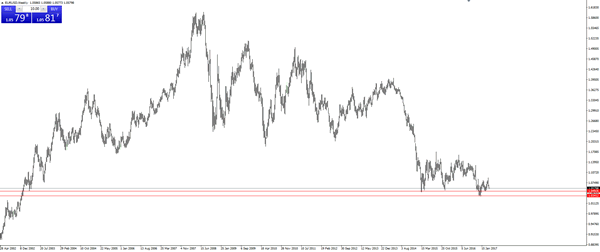
EUR/USD Weekly Outlook
EUR/USD's fall from 1.0905 extended to as low as 1.0580 last week. The development affirmed the case that corrective rise from 1.0339 is finished after being rejected by 55 week EMA. And, the larger down trend is likely ready to resume. Deeper fall is expected in near term and break of 1.0494 support should confirm this bearish case.
Initial bias in EUR/USD remains on the downside this week for 1.0494 support. Break should confirm completion of the corrective rise from 1.0339. And, larger down trend is likely resuming in this case. Break of 1.0339 will confirm down trend resumption and target 100% projection of 1.1298 to 1.0339 from 1.0905 at 0.9946. On the upside, break of 1.0688 resistance will delay the bearish case and turn focus back to 1.0905 resistance instead.
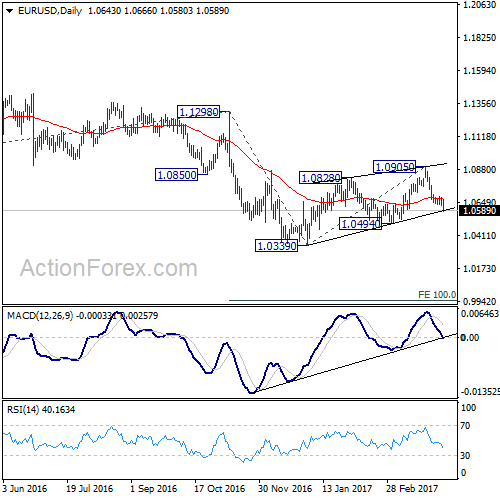
In the bigger picture, as long as 1.1298 key resistance holds, whole down trend from 1.6039 (2008 high) is still expected to continue. Break of 1.0339 low will send EUR/USD through parity to 61.8% projection of 1.3993 to 1.0461 from 1.1298 at 0.9115. However, considering bullish convergence condition in weekly MACD, break of 1.1298 will indicate term reversal. this would also be supported by sustained trading above 55 week EMA.
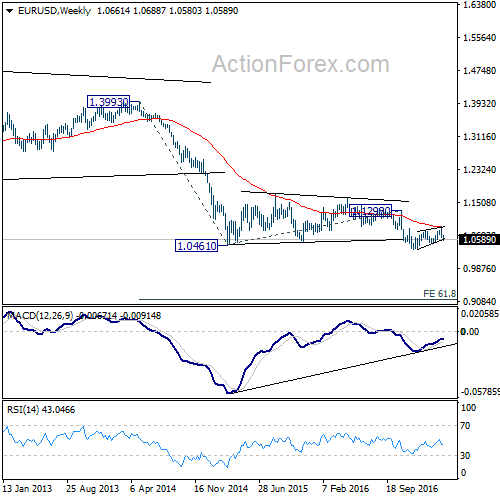
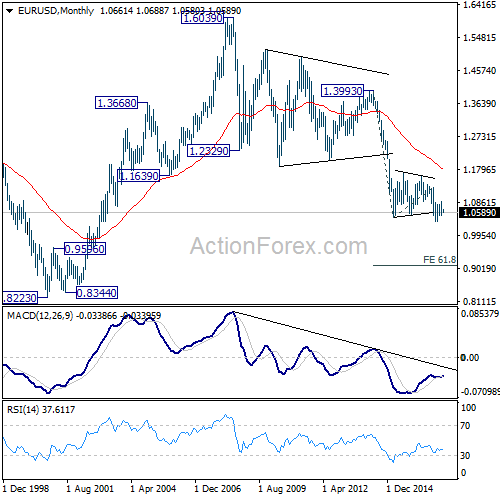
In the long term picture, the down trend from 1.6039 (2008 high) is still in progress and there is no clear sign of completion. We'd expect more downside towards 0.8223 (2000 low) as long as 1.1298 resistance holds. However, firm break of 1.1298 should now confirm long term reversal.
EUR/USD Weekly Outlook
EUR/USD's fall from 1.0905 extended to as low as 1.0580 last week. The development affirmed the case that corrective rise from 1.0339 is finished after being rejected by 55 week EMA. And, the larger down trend is likely ready to resume. Deeper fall is expected in near term and break of 1.0494 support should confirm this bearish case.
Initial bias in EUR/USD remains on the downside this week for 1.0494 support. Break should confirm completion of the corrective rise from 1.0339. And, larger down trend is likely resuming in this case. Break of 1.0339 will confirm down trend resumption and target 100% projection of 1.1298 to 1.0339 from 1.0905 at 0.9946. On the upside, break of 1.0688 resistance will delay the bearish case and turn focus back to 1.0905 resistance instead.
In the bigger picture, as long as 1.1298 key resistance holds, whole down trend from 1.6039 (2008 high) is still expected to continue. Break of 1.0339 low will send EUR/USD through parity to 61.8% projection of 1.3993 to 1.0461 from 1.1298 at 0.9115. However, considering bullish convergence condition in weekly MACD, break of 1.1298 will indicate term reversal. this would also be supported by sustained trading above 55 week EMA.
In the long term picture, the down trend from 1.6039 (2008 high) is still in progress and there is no clear sign of completion. We'd expect more downside towards 0.8223 (2000 low) as long as 1.1298 resistance holds. However, firm break of 1.1298 should now confirm long term reversal.
USD/JPY Weekly Outlook
USD/JPY engaged in range trading in 110.10/112.19 last week and outlook is unchanged. The pair is staying well in side a near term falling channel and well below 55 day EMA (now at 112.52). More downside is mildly in favor. But the pair is also pressing 55 week EMA (now at 111.15). Hence, we'd be cautious on reversal from the current point.
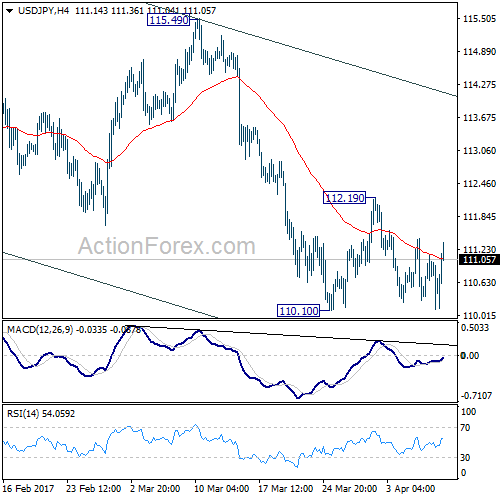
Initial bias in USD/JPY remains neutral this week first. On the downside, break of 110.10 will extend the whole decline from m 118.65 and target 50% retracement of 98.97 to 118.65 at 108.81. On the upside, however, break of 112.19 resistance will indicate short term reversal and turn bias back to the upside for 115.49 resistance.
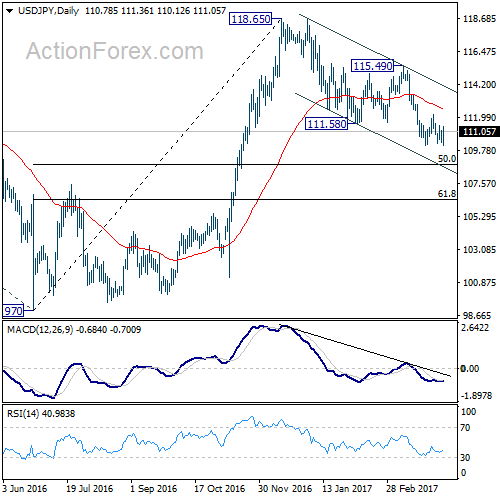
In the bigger picture, price actions from 125.85 high are seen as a corrective pattern. The impulsive structure of the rise from 98.97 suggests that the correction is completed and larger up trend is resuming. Decisive break of 125.85 will confirm and target 61.8% projection of 75.56 to 125.85 from 98.97 at 130.04 and then 135.20 long term resistance. Nonetheless, sustained trading below 55 week EMA (now at 111.15) will extend the consolidation from 125.85 with another fall through 98.97 before completion.
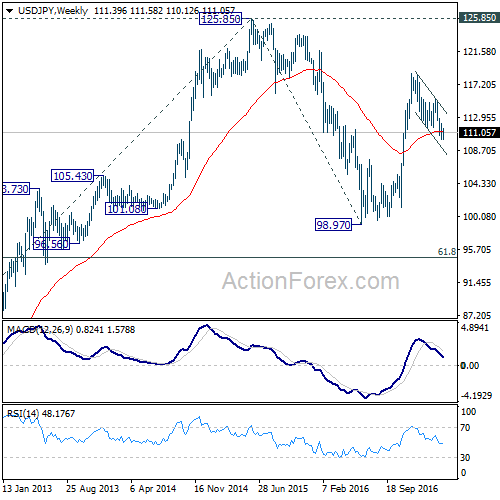
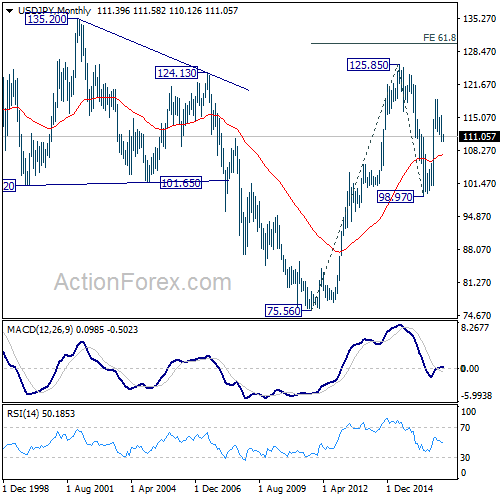
In the long term picture, the rise from 75.56 long term bottom to 125.85 medium term top is viewed as an impulsive move. Price actions from 125.85 are seen as a corrective move which could still extend. But, up trend from 75.56 is expected to resume at a later stage for above 135.20/147.68 resistance zone.
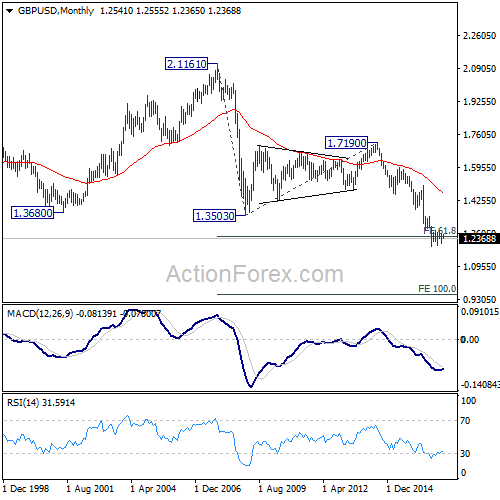
GBP/USD Weekly Outlook
GBP/USD's sharp fall and break of 1.2376 support last week should confirm completion of rise from 1.2108 at 1.2614. More importantly, the triangle pattern from 1.1946 could be finished with five waves to 1.2614 too. And the larger down trend is resuming. Deeper fall should be seen back to 1.2108 support to confirm this bearish case.
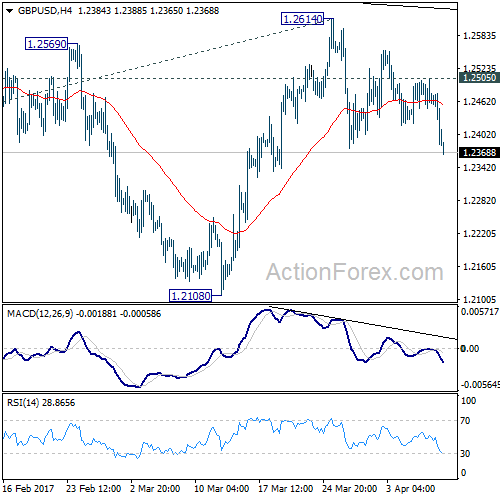
Initial bias in GBP/USD remains on the downside this week for 1.2108 support first. Decisive break there will argue that medium term down trend is resuming. In that case, GBP/USD should take out 1.1946/1986 support zone to 61.8% projection of 1.5016 to 1.1946 from 1.2614 at 1.0717. On the upside, however, break of 1.2505 resistance will invalidate this immediately bearish case. Then, it will turn bias back to the upside for 1.2614 resistance instead.
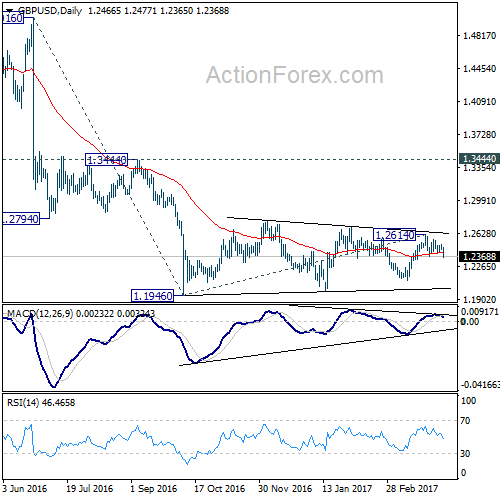
In the bigger picture, fall from 1.7190 is seen as part of the down trend from 2.1161. There is no sign of medium term reversal yet. Sustained trading below 61.8% projection of 2.1161 to 1.3503 from 1.7190 at 1.2457 will target 100% projection at 0.9532. Overall, break of 1.3444 resistance is needed to confirm medium term bottoming. Otherwise, outlook will remain bearish.
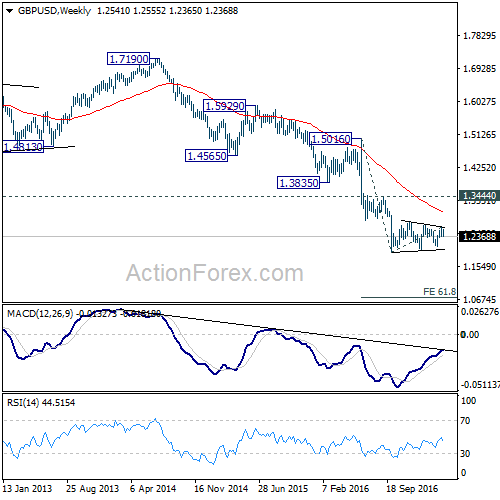
In the longer term picture, no change in the view that down trend from 2.1161 is still in progress. Current momentum suggests that the down trend will go deeper than originally expected to 100% projection of 2.1161 to 1.3503 from 1.7190 at 0.9532.