
Sample Category Title
USD/JPY Daily Outlook
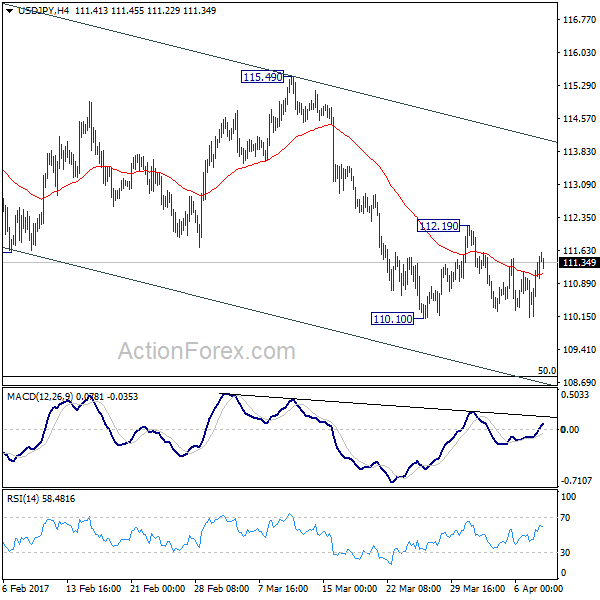
Daily Pivots: (S1) 110.29; (P) 110.83; (R1) 111.57; More....
Intraday bias in USD/JPY remains neutral for the moment. The pair is staying in the near term falling channel and the correction from 118.65 could extend lower. Below 110.10 will turn intraday bias to the downside for 50% retracement of 98.97 to 118.65 at 108.81. On the upside, however, break of 112.19 resistance will indicate short term reversal and turn bias back to the upside for 115.49 resistance.
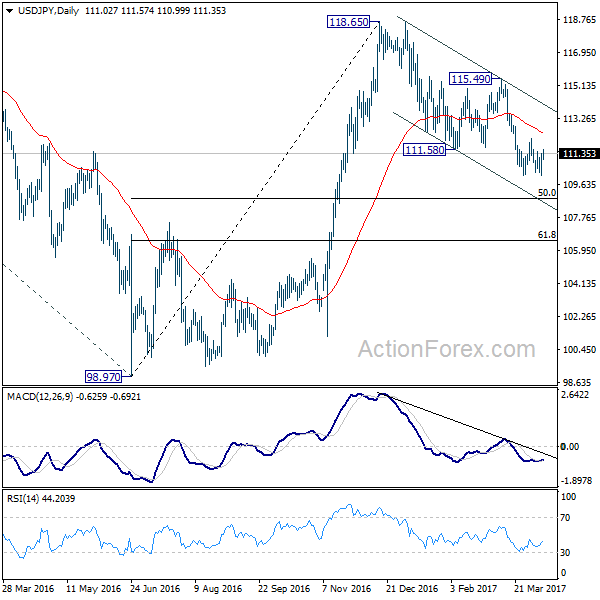
In the bigger picture, price actions from 125.85 high are seen as a corrective pattern. The impulsive structure of the rise from 98.97 suggests that the correction is completed and larger up trend is resuming. Decisive break of 125.85 will confirm and target 61.8% projection of 75.56 to 125.85 from 98.97 at 130.04 and then 135.20 long term resistance. Nonetheless, sustained trading below 55 week EMA (now at 111.15) will extend the consolidation from 125.85 with another fall through 98.97 before completion.
USD/CAD Daily Outlook
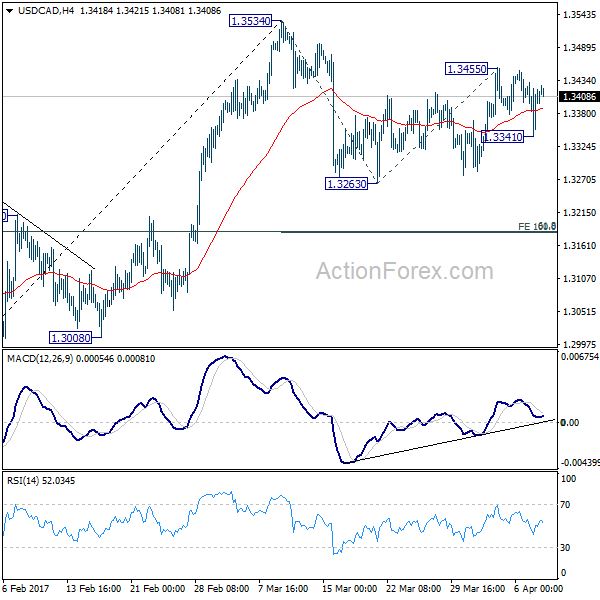
Daily Pivots: (S1) 1.3354; (P) 1.3392; (R1) 1.3443; More....
Intraday bias in USD/CAD is neutral for the moment but overall outlook is unchanged. Corrective fall from 1.3534 is not completed yet. Below 1.3341 will turn bias to the downside to 1.3263 and below. But in that case, we'd expect strong support from 1.3184 cluster level (61.8% retracement of 1.2968 to 1.3534 at 1.3184, 100% projection of 1.3534 to 1.3263 from 1.3455 at 1.3814 too) to contain downside and bring rebound. On the upside, break of 1.3455 will turn bias back to the upside for 1.3534 resistance.
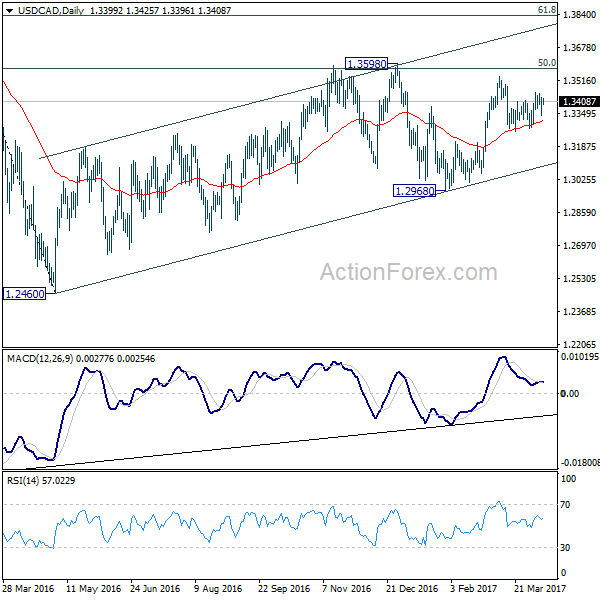
In the bigger picture, price actions from 1.4689 medium term top are seen as a correction pattern. The first leg has completed at 1.2460. The second leg from 1.2460 is likely still in progress and could target 61.8% retracement of 1.4689 to 1.2460 at 1.3838. We'd look for reversal signal there to start the third leg. However, break of 1.2968 will argue that the third leg has already started and should at least bring a retest of 1.2460 low. Meanwhile, sustained trading above 1.3838 would pave the way to retest 1.4689 high.
Will Payrolls Be Strong Enough To Restore A Better USD Bid?
Sunrise Market Commentary
- Rates: Risk off after US attack; focus on payrolls now
US Treasuries spiked higher overnight after the US conducted missile strikes against Syria, retaliating the gas attack earlier this week. The US 10-yr yield tested key 2.3% support, but a break didn't occur. Today's attention turns to the US payrolls report. With risks slightly on the upside of expectations, 2.3% should become even stronger support. - Currencies: Will payrolls be strong enough to restore a better USD bid?
The dollar stabilized yesterday after Wednesday's post-Minutes correction. Overnight, USD/JPY revisited the recent lows on headlines of the US strike against Syria, but no break occurred. Later today, the focus for USD trading will be on the US payrolls. Of late, the dollar gradually lost interest rate support. Will the payrolls be strong enough to reverse this trend?
The Sunrise Headlines
- US equities ended a dull trading session with small gains. Risk sentiment deteriorated after the US conducted missile strikes against Syria. Most Asian equity indices lose around 0.3% with Japan and China outperforming.
- The US military launched nearly 60 Tomahawk cruise missiles against a Syrian air base this morning, responding to mounting calls for a display of force in the wake of this week's suspected chemical-weapons attack in Syria.
- Under rules passed by the US Senate, lawmakers in the minority party will no longer be able to block presidential appointments to the Supreme Court a move so extreme it had been known as “the nuclear option”.
- Overtime pay in Japan, a barometer of strength in corporate activity, edged up in February for the first time in nine months, while real wages remained flat, government data showed on Friday
- The ECB has proposed that large branches of foreign banks in the EU be subject to tighter regulation and capital requirements, a move that would increase US and Asian lenders' costs and also hit British banks after Brexit.
- ECB President Draghi yesterday looked to dull speculation that the ECB will halt its negative rate experiment later this year. In a press conference later in the day, ECB VP Constâncio said that Draghi has “a lot of support” for his stance
- Today's eco calendar contains US payrolls and UK industrial production data. Euro-area finance ministers will try to break a months-long deadlock over Greece's bailout in Malta. BoE Carney is scheduled to speak.
Currencies: Will Payrolls Be Strong Enough To Restore A Better USD Bid?
USD going nowhere ahead of the payrolls
The dollar regained slightly ground against the euro and the yen yesterday after Wednesday's soft market reaction to the March Fed Minutes. EUR/USD dropped briefly on soft Draghi comments early in Europe, but the pair soon returned to wait-and-see modus ahead of today's US payrolls. The pair closed the session at 1.0644 (from 1.0663). USD/JPY reversed early losses to finish the session at 110.81 (from 110.70).
Overnight, Asian markets were hit by a (temporary?) risk-off reaction as the US executed a missile strike against Syria in response to the use of chemical weapons. Markets followed the ‘standard risk-off procedure'. Equities and US bond yields declined. The yen rebounded. The oil price jumped also higher as markets feared more instability in the region. However, the reaction was limited and an important part of the moves is already reversed at the time of writing. Several Asian equity markets including Japan returned already in positive territory. USD/JPY dropped close to the recent low in the low 110 area, but the test was again rejected (currently 110.60). The moves in EUR/USD were very limited. The pair is holding a narrow range in the mid 1.06 area.
Today, there are plenty of second tier eco data. However, except for the fall-out from the Syria strike, focus of (FX) trading will be on the US payrolls. Payrolls started 2017 on a strong footing (238K and 235K in January and February). We expect an ongoing healthy labour market in March, but somewhat less buoyant. The market expects a 180K net job gains. Other labour market indicators gave some mixed signals of late. Still, we put the risk somewhat to the upside of expectations with the 6m and 12m average of 195K as our guesstimate. The unemployment rate might have stabilized at 4.7%, while we hope to see earnings to have stabilized at 2.8% Y/Y (consensus 2.7% Y/Y).
Of late, US bond yields drifted back to key support levels and this also weighed on the dollar. Our base scenario of in-line to slightly better than expected payrolls, should be good enough to prevent a sustained break lower of US yields and of the dollar. USD/JPY remains vulnerable to a downside test in case of a weak payrolls report. However, as we don't expect a sustained decline of US yields beyond key support levels(10-j < 2.30%), a real USD sell-off is unlikely. EUR/USD didn't show clear dynamics this week. We expect the topside to be rather well protected, even in case of a soft payrolls report.
Last week, the dollar decline slowed, but the subsequent rebound had no strong legs as US yields remain relatively low near key support levels. The Fed Minutes didn't help the dollar even as the Fed confirmed its intention to continue policy normalization. The (FX) market apparently anticipates that reducing the balance sheet might slow the pace of Fed rate hikes. Both measures could go hand in hand if the US economy remains on track. In any case, further down the road, US monetary policy conditions will most likely be tightened which should be USD supportive.
From a technical point of view, USD/JPY last week failed to regain the 111.36/60 previous range bottom. A decline below 110 would signal more trouble ahead. We remain cautious on USD/JPY ST and first want a clear sign that a solid bottom is in place. EUR/USD extensively tested the topside of the MT range, but the test was rejected last week. The 1.0874/1.0906 area now looks a solid resistance. EUR/USD might return lower in the previous 1.0875/1.05 trading range
EUR/USD: perfectly calm going into the US payrolls release
EUR/GBP
Sterling stays in consolidation modus
Yesterday, sterling was driven by non-UK factors and technical considerations. EUR/GBP spiked briefly lower to the 0.8510/15 area on the Draghi headlines early in the European trading. As was the case for EUR/USD, the decline was almost immediately reversed. EUR/GBP hold a tight range in the mid 0.85 area further out (close at 0.8537 from 0.08542). Cable finished sideways at 1.2470.
Today, the UK calendar is well filled with The Halifax House prices, the production and the trade balance data. The production is expected to rebound after a poor reading in January. The trade deficit is expected more or less stable after a tentative better performance of the previous months. A further narrowing of the trade deficit might be slightly sterling supportive. BoE governor Carney will speak in London. If he says anything on the economy or on monetary policy we expect him to stress the uncertainty of the Brexit process and avoid any signal about policy tightening. Mid-March, sterling found a better bid after higher than expected UK inflation and a more hawkish tone from the BoE. We changed our short-term bias on EUR/GBP from positive to neutral. The EUR/GBP 0.88/0.84 range should guide trading for now. Since late last week, the sterling rally/shortsqueeze shows tentative signs of running into resistance, but we see no trigger for a real change in sentiment yet. Longer term, Brexit-complications remain a potential negative for sterling. We are not convinced that the BoE will raise rates anytime soon, even not after recent higher inflation data
EUR/GBP sterling short-squeeze is easing, but no sustained sterling correction yet
Copper Is Now Range Bound With Resistance About 2.70
Last Trading Room advice to Elliott Wave Gold members advised to enter short with a stop just above 2.717. Members were advised that short positions should become profitable within 24 hours, which is what happened, and that stops should have been then moved to breakeven. The whipsaw of the 5th of April should have closed short positions for no loss.
Copper is now range bound with resistance about 2.70 and support about 2.59 (with overshoots). Volatility declines as price moves sideways, ATR remains very low and flat, and ADX indicates a consolidating market.
In the short term, the very long lower wick for the candlestick of the 7th of April indicates upwards movement is likely to begin the new trading week.
TREND LINE
Copper has found very strong resistance at the green trend line, which goes back to at least August 2011. The doji candlestick for February puts the trend from up to neutral.
ELLIOTT WAVE ANALYSIS
The upper edge of the blue channel has provided resistance, with a strong overshoot for the 30th of March. Copper may be ready to move lower in a third wave at three degrees now and this should see an increase in downwards momentum.
Natural Gas
TECHNICAL ANALYSIS
Last trading advice for Natural Gas to Elliott Wave Gold members on the 31st of March was:
"A trade set up is not seen at this time. Look for price to pullback to touch the green Magee trend line on the TA chart. If that happens, then enter long with a stop just below the line. Allow for overshoots, but exit long positions if the line is breached."
The Magee trend line was touched again on the 4th of April. This was the signal to enter long according to trading advice given. That best case entry point would have been at the low of the day at 3.122, but in reality members may not have entered exactly at the price point where price touched the line. However, any long positions should now be profitable and stops may be moved up to protect a little profit.
The Magee trend line may be used now as a trailing stop for long positions.
ADX indicates an upwards trend and RSI allows further room for price to rise. Stochastics is overbought and exhibits divergence with price, but this oscillator may remain extreme for long periods of time when this 4 of 9 10/04/17, 11:08 AM market trends. The bottom line is any pullbacks may be expected to find support at the green Magee trend line.
On Balance Volume is now bound within a small range. Watch this carefully; if it breaks below the yellow support line, it would indicate a deeper pullback may be underway; if it breaks above the purple resistance line, it would indicate an increase in upwards momentum.
ELLIOTT WAVE ANALYSIS
The last Elliott wave count was invalidated with a new high this week above 3.174. Cycle wave b may be continuing higher as a double zigzag.
MACD indicates an increase in momentum to support this third wave up.
When minor wave 3 is complete, then minor wave 4 may not move into minor wave 1 price territory below 3.088.
The gold channel's lower edge is the same as the green Magee trend line on the daily technical analysis chart. Price should continue to find support at the lower edge while minor wave 3 continues.
GBPUSD
TECHNICAL ANALYSIS
Price looked like it was forming a Pennant pattern. What StockCharts data does not show today is the daily candlestick for the 7th of April that broke out of the pattern to the downside. The candlestick is shown today on FXCM data below.
VOLUME ANALYSIS
On Balance Volume gives a bearish signal with a break below the short term yellow support line. The downwards breakout from the pennant pattern has support from volume for a strong downwards day.
ELLIOTT WAVE ANALYSIS
Cycle wave c needs to complete as a five wave structure. The final fifth wave is incomplete and may only have just begun. The target expects to see the most likely Fibonacci ratio between primary waves 5 and 1.
Primary wave 4 fits perfectly as a regular contracting triangle, offering perfect alternation with the zigzag of primary wave 2. Primary wave 2 lasted 2 months and primary wave 4 lasted 6 months. Triangles are usually longer lasting structures than zigzags, so this disproportion is not only acceptable but should be expected. This wave count has the right look.
The breakout from the triangle should be down.
Within minor wave 3, no second wave correction may move beyond the start of its first wave above 1.25620.
TRADING ROOM SUMMARY TABLES
OPEN POSITIONS
Trading advice for gold given to Elliott Wave Gold members will be included in Trading Room summary tables. However, so that it remains private for Elliott Wave Gold members only, it will not be included in Trading Room posts.
CLOSED POSITIONS
AUD/USD Daily Outlook
Daily Pivots: (S1) 0.7480; (P) 0.7513; (R1) 0.7531; More...
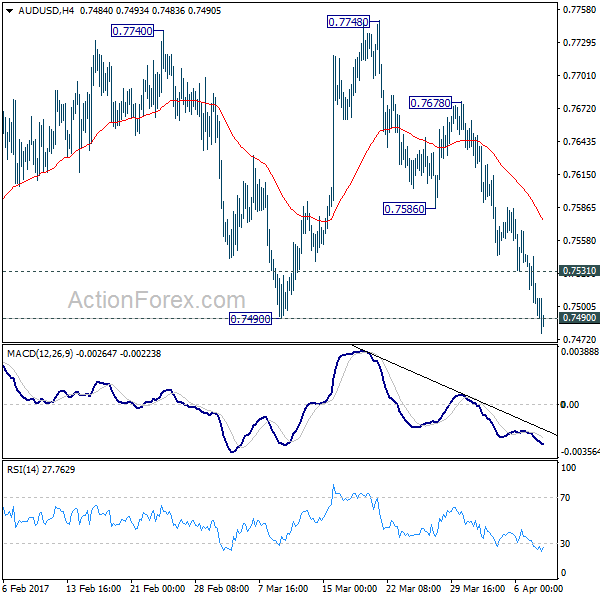
AUD/USD's fall from 0.7748 continues today and breaches 0.7490 support. The development indicates that rise from 0.7158 is already completed at 0.7748. And, near term trend has reversed Intraday bias stays on the downside for 0.7144/58 support zone next. On the upside, above 0.7351 minor resistance will turn bias neutral and bring recovery. But upside should be limited by 0.7586 support turned resistance to bring fall resumption.
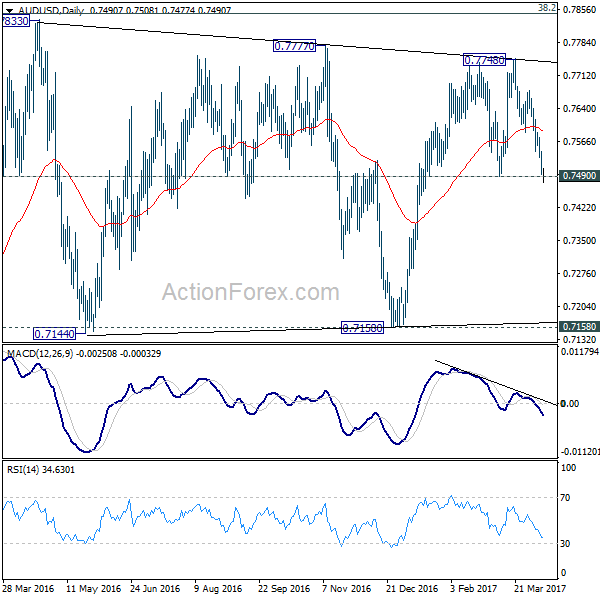
In the bigger picture, we're still treating price actions from 0.6826 low as a correction. And, as long as 38.2% retracement of 0.9504 to 0.6826 at 0.7849 holds, long term down trend from 1.1079 is expected to resume sooner or later. Break of 0.6826 low will target 0.6008 key support level. However, firm break of 0.7849 will indicate that rise from 0.6826 is developing into a medium term rebound, rather than a sideway pattern. In such case, stronger rise should be seen to 55 month EMA (now at 0.8142) and above.
US Non-Farm Payrolls Report Disappointed Market Expectations
Market movers today
It is the last week ahead of the Easter Hol iday and the data calendar is dominated by not least CPI inflation prints across the globe. Today, the inflation set is kicked off with data out of Norway and Denmark. Also, we will get Danish balance of payments data and the Swedish labour force survey release. See page 2 for more details.
In the US, today brings the first of several speeches by the FOMC scheduled in the coming weeks as Fed Chair Janet Yellen is set to speak tonight . We do not expect any major news but focus will naturally be on t he Fed's int ent ion to start quant itative tightening.
In the euro area, the Sen ix investor confidence is due to be released. Sent ix climbed from 1.7 in July 2016 to 20.7 in March, which is the highest level since the financial crisis. As noted last month, political uncertainty has derailed financial sent iment while PMIs and other survey indicators show st rength consistent ly. We therefore expect Sent ix to increase marginally to 21.0 in April as we also note that the historically high level makes further upside surprises less likely.
Selected market news
Friday's US non-farm payrolls report disappointed market expectations as the headline print of 98,000 new jobs fell far short of Wednesday's ADP report signal. Yet , despite the disappoint ing headline and negat ive revisions, we st ill think the overall picture is that of an improving US labour market . In part icular, we highlight that the weather hit job growth negat ively in March and a correct ion generally following the previous two st rong prints is not unusual. Friday's print leaves the Fed facing a 3M moving job growth average of a decent 178,000 with unemployment and underemployment falling while wage growth is slowly picking up. We therefore maintain our call for an addit ional two rate hikes this year (July, December) and that the Fed is likely to start reducing its balance sheet from Q1 18, possibly even in Q4 17.
The US-China presidential meeting between Presidents Trump and Jinping, which ended on Friday, underpinned a much needed good start to the init ial working relat ionship. Nevertheless, the meet ing was also a reminder that the disagreements between the US and China are real and that the potential implicat ions are non-negligible. Trade is a key area of disagreement and it is therefore posit ive with the seemingly first minor t rade deal following the meet ing as China prepares to ease beef import restrictions from the US and the majority stake regulat ion in finance.
Over the weekend, the Pentagon decided to divert an aircraft carrier group to waters near North Korea in a move aimed as a "show of force" according to FT.
The weekly IMM Positioning Update - investors trim JPY shorts, 10 April, revealed little change in speculative positioning although the rise in long gold bets suggest s increased investor caution. In Friday's Strategy piece, we also highlight ed how mount ing signs of the business cycle peaking should lead a pause in the equity bull market and mark the end of the bond bear market . See ‘‘Risk factors move to the fore as business cycle peaks', 7 April for more details.
Dollar Lacks Follow Through Buying to Extend Rally, But Stays Firm
Dollar edges mildly higher in early Asian session today but quickly turned mixed. The greenback is somewhat supported by comments from Fed officials. St. Louis Fed President James Bullard echoed some other officials and said Fed could start winding down its $4.5T balance sheet later this year. But in that case for Bullard, it would become less necessary to raise interest rate. On the other hand, New York Fed President William Dudley said on Friday that shrinking the balance sheet would only prompt a "little pause" in tightening.
Fed balance shrinking should be considered in March projections
We'd like to remind our readers that Dollar suffered selloff last month when Fed's new economic and interest rate projections disappointed. That was, in spite of recent solid economic data (except Friday's NFP of course), Fed maintained projection of three hikes this year and in 2018. And the minutes released last week showed FOMC members have already discussed the topic of unwinding the balance sheet. That is, Fed's rate projection should have that "little pause" Dudley mentioned considered. In other words, the talk of balance sheet normalization shouldn't alter Fed's rate path.
Fed chair Janet Yellen will speak today and markets will look into hints of her view on rate and balance sheet. But we'd like to maintain our view that economic data including inflation and employment will remain one of the two main driving forces in Fed's outlook. US President Donald Trump's implementation of his election promises of fiscal stimulus would be another factor, and possibly the more important one.
BoC rate decision to highlight the week
Bank of Canada rate decision on Wednesday will be a major focus this week. BoC is widely expected to keep interest rate unchanged at 0.50%. The tone of the statement could remain slightly dovish in spite of improvements in economic data. Nonetheless, Canadian Dollar will likely follow more on oil prices as WTI crude oil could be heading back to 55.24 resistance due to geopolitical tensions.
In addition to that, UK CPI and employment, German ZEW, China CPI, PPI and trade balance, Australia employment, US CPI and retail sales will be closely watched in a holiday shortened week, ahead of long weekend.
Here are some highlights for the week ahead
- Monday: Australia home loans; Japan economy watcher sentiment; Eurozone Sentix investor confidence; Canada housing starts; US labor market conditions index
- Tuesday: Australia NAB business confidence; UK CPI, PPI; German ZEW; Eurozone industrial production
- Wednesday: Japan machine orders, PPI; China CPI, PPI; UK employment; BoC rate decision; US import prices
- Thursday: New Zealand business NZ manufacturing; Australia employment; China trade balance; Swiss PPI; German CPI final; Canada manufacturing sales, new housing price index; UK PPI, jobless claims, U of Michigan sentiment
- Friday: US CPI, retail sales, business inventories
AUD/USD Daily Outlook
Daily Pivots: (S1) 0.7480; (P) 0.7513; (R1) 0.7531; More...
AUD/USD's fall from 0.7748 continues today and breaches 0.7490 support. The development indicates that rise from 0.7158 is already completed at 0.7748. And, near term trend has reversed Intraday bias stays on the downside for 0.7144/58 support zone next. On the upside, above 0.7351 minor resistance will turn bias neutral and bring recovery. But upside should be limited by 0.7586 support turned resistance to bring fall resumption.
In the bigger picture, we're still treating price actions from 0.6826 low as a correction. And, as long as 38.2% retracement of 0.9504 to 0.6826 at 0.7849 holds, long term down trend from 1.1079 is expected to resume sooner or later. Break of 0.6826 low will target 0.6008 key support level. However, firm break of 0.7849 will indicate that rise from 0.6826 is developing into a medium term rebound, rather than a sideway pattern. In such case, stronger rise should be seen to 55 month EMA (now at 0.8142) and above.
Economic Indicators Update
| GMT | Ccy | Events | Actual | Forecast | Previous | Revised |
|---|---|---|---|---|---|---|
| 23:50 | JPY | Current Account (JPY) Feb | 2.21T | 1.79T | 1.26T | |
| 1:30 | AUD | Home Loans Feb | -0.50% | 0.00% | 0.50% | 0.40% |
| 5:00 | JPY | Eco Watchers Survey Current Mar | 47.4 | 49.8 | 48.6 | |
| 8:30 | EUR | Eurozone Sentix Investor Confidence Apr | 21 | 20.7 | ||
| 12:15 | CAD | Housing Starts Mar | 215.5k | 210.2k | ||
| 14:00 | USD | Labor Market Conditions Index Change Mar | 1.3 |
Elliott Wave View: Dubai Index ( DFMGI )
DFMGI tracks Dubai Financial Market which is the largest financial trading exchange in the United Arab Emirates. Dubai has emerged as a global city and business hub of the Middle East , it’s contently growing bigger and becoming one of most expensive city in the world. The Dubai Financial Market (DFM) was founded on 2000, looking at it’s index chart you may say it’s quite different from the rest but we do believe in EWF that there is only one market and every instrument is related to another. Which explain having a different structure or sequence doesn’t necessarily mean that’s trading on it’s own, because the bigger cycles are the same among the different groups of the market.
DFMGI Elliott Wave View
Last year, DFMGI rallied like the rest of world Indices and we can notice that it has a bullish structure in wave (1) unfolding as 5 impulsive waves from January 2016 low followed by a flat correction during the middle of the year in wave (2) and finally it managed to resume the rally from November lows to be make new high.
The index recently ended wave 2 pullback as a double three correction reaching equal legs area 3467 – 3423 from which it bounced higher and still needs to break above February peak to open more extension to the upside. The correction in wave 2 may persist if DFMGI manage to break 03/29 low but it should remain supported while the pivot at 3195 low keeps holding.
Zooming out to the weekly chart, we can notice that early this year DFMGI broke above the descending trend-line from 2014 peak which is confirming the bullish reversal started last year. Consequently if the Index manage to resume higher then the next target for the bulls would come around 4213 – 4840 area.
In case DFMGI holds below February peak and the pivot at November low gives up , then the Index could have ended the whole cycle from 2016 low and it will be looking to do a deeper correction toward the 50%-61.8 % Fibonacci area ( 3169 – 3034 ) before it can resume the move higher.
Recap:
DFMGI is one of the important Indices in the Middle East , its sharing the same cycle with the rest of world Indices and suggesting that there should be more upside to come if it manage to hold above November 2016 low. A deeper correction may happen but the Index will remain supported as it ended a corrective cycle and has a bullish structure in the bigger time frames.
Elliott Wave View: AUDCAD Calling The Decline
In this Technical blog we are going to take a quick look at the past 1 hour Elliott wave performance of AUDCAD cycle from March 20 peak (1.0332), which we presented to our clients at elliottwave-forecast.com. We are going to explain the structure from that peak below
AUDCAD 3/29 1 Hour NY Updated Chart
The cycle from January 06 low has ended in the pair at March 20 peak (1.0332). The structure from the peak looks to be overlapping, hence suggesting it's corrective structure from the peak. First leg lower ended i.e. Minor wave W at (1.0169) & Minor wave X was expected to end in 3 swings between 50-764% Fibonacci retracement area (1.0246-1.0291) followed by extension lower.
AUDCAD March 30 1 Hour NY Updated Chart
The pair found the seller's as expected from blue box area 50-764% Fibonacci retracement area (1.0246-1.0291) & ended Minor wave X at (1.0255). While below there & most importantly as far as pivot from (1.0332) peak stayed intact, pair was expected to turn lower again initially towards 1.0176-1.0137 to see a 3 wave bounce in Minutte wave (x) against (1.0255) peak before continuation lower.
AUDCAD 1 Hour April 2, Weekend Updated Chart
The pair got the the bounce from above mentioned area & failed below the 1.0255 peak as expected. Note that, we adjusted the degree of labels but the pair keep rejecting in bounces & continues to slide lower towards 1.0126-1.0110 area lower to see a 6th swing bounce from 1.0332 peak in Minutte wave (x).
AUDCAD 1 Hour April 3, NY Updated Chart
The pair got the 3 swings bounce as expected from mentioned blue box area 1.0126-1.0110 in Minutte wave (x) & found sellers in between 1.0184-1.0212 area. Afterwards pair resumed the decline lower & while below 1.0255 peak pair should be looking for 1 more push lower towards 1.0074-1.0032 area to end 7 swings double three from 1.0332 peak before pair starts the 3 waves back.
Australia’s Home Loans Surprisingly Fell In February
For the 24 hours to 23:00 GMT, the AUD declined 0.54% against the USD and closed at 0.7499 on Friday.
LME Copper prices declined 1.7% or $100.5/MT to $5770.0/MT. Aluminium prices declined 1.4% or $26.5/MT to $1929.5/MT.
In the Asian session, at GMT0300, the pair is trading at 0.7482, with the AUD trading 0.23% lower against the USD from Friday's close.
Early morning data indicated that Australia's home loans unexpectedly dropped by 0.5% in February, compared to a revised rise of 0.4% in the prior month, while markets were expecting for a flat reading.
The pair is expected to find support at 0.7456, and a fall through could take it to the next support level of 0.7429. The pair is expected to find its first resistance at 0.7527, and a rise through could take it to the next resistance level of 0.7571.
Moving ahead, market participants focus on Australia's NAB business confidence index for March, slated to release in the early hours of tomorrow.
The currency pair is trading below its 20 Hr and 50 Hr moving averages.
