Sample Category Title
German Industrial Output Surprisingly Jumped In February, Trade Surplus Widened More Than Anticipated In The Same Month
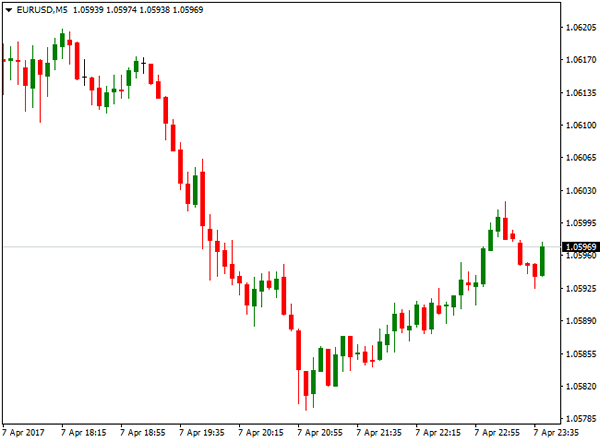
For the 24 hours to 23:00 GMT, the EUR declined 0.48% against the USD and closed at 1.0592 on Friday.
In economic news, Germany's seasonally adjusted industrial production unexpectedly rose 2.2% on a monthly basis in February, driven by robust activity in the construction sector. Industrial production registered a revised similar rise in the prior month, while markets were expecting for a fall of 0.2%. Moreover, the nation's seasonally adjusted trade surplus expanded more-than-expected to a level of €19.9 billion in February, on the back of an increase in exports, while investors had envisaged the nation to post a surplus of €17.7 billion. In the previous month, the nation had reported a revised surplus of €14.9 billion.
The US Dollar gained ground against its major counterparts on Friday, after an influential Federal Reserve official, William Dudley, stated that central bank's plan to shrink its bond portfolio later this year would prompt only a “little pause” in the central bank's rate hike plans.
The greenback initially lost ground against its major peers, after the latest jobs report painted a mixed picture of the nation's labour market.
Non-farm payrolls in the US rose less-than-anticipated by 98.0K in March, adding the least number of jobs in ten months, as inclement weather weighed on the nation's job growth. Non-farm payrolls had registered a revised gain of 219.0K in the previous month, while markets expected for an advance of 180.0K. However, the nation's unemployment rate unexpectedly fell to a nearly ten-year low level of 4.5% in March, whereas markets anticipated unemployment rate to remain unchanged at 4.7%. Also, the nation's average hourly earnings of all employees advanced 0.2% on a monthly basis in March, meeting market consensus and compared to a revised rise of 0.3% in the prior month.
In other economic news, consumer credit in the US climbed to a level of $15.2 billion in February, compared to a level of $10.9 billion in the previous month. Further, the nation's final wholesale inventories advanced 0.4% in February, in line with market expectations and following a similar rise in the preceding month.
In the Asian session, at GMT0300, the pair is trading at 1.0574, with the EUR trading 0.17% lower against the USD from Friday's close.
The pair is expected to find support at 1.0539, and a fall through could take it to the next support level of 1.0505. The pair is expected to find its first resistance at 1.0637, and a rise through could take it to the next resistance level of 1.0701.
Going ahead, investors will look forward to the Euro-zone's Sentix investor confidence index for April, slated to release in a few hours. Moreover, a speech by the US Federal Reserve Chair, Janet Yellen, due later today, will also be closely watched by traders.
The currency pair is trading below its 20 Hr and 50 Hr moving averages.

UK’s Manufacturing, Industrial And Construction Output, All Surprisingly Fell In February
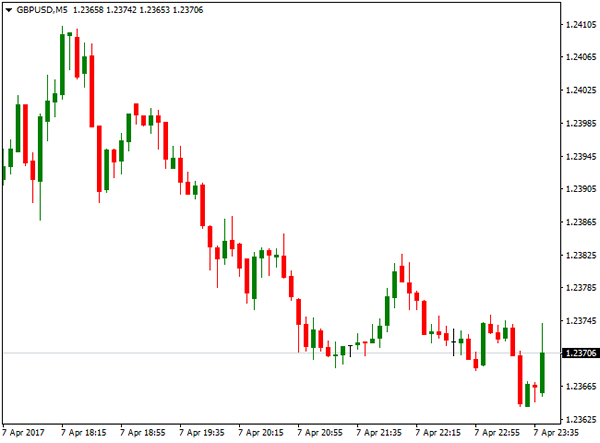
For the 24 hours to 23:00 GMT, the GBP declined 0.76% against the USD and closed at 1.2370 on Friday, after an unexpected downturn in UK's manufacturing, industrial and construction sector dented the nation's growth prospects in the first-quarter of 2017.
Data revealed that Britain's industrial production unexpectedly eased 0.7% on a monthly basis in February, defying market expectations for an advance of 0.2%. In the prior month, industrial production had registered a revised drop of 0.3%. Moreover, the nation's manufacturing production surprisingly dropped 0.1% MoM in February, compared to a revised drop of 1.0% in the prior month, while market participants anticipated for a rise of 0.3%. Also, the nation's construction output unexpectedly declined 1.7% in February, led by weakness in infrastructure activity and confounding market expectations for an advance of 0.1%. In the previous month, construction output had registered a revised flat reading.
Other economic data showed that total trade deficit in the UK surprisingly expanded to a level of £3.66 billion in February, triggered by a jump in imports of non-monetary gold and aircraft, whereas market expected the nation's trade deficit to narrow down to a level of £2.20 billion. The nation had posted a revised deficit of £2.97 billion in the previous month. Moreover, the nation's leading think tanker, NIESR estimated UK's gross domestic product (GDP) rose less-than-expected by 0.5% in the January-March 2017 period, compared to a revised similar rise in the three months ended February. Meanwhile, markets expected for an expansion of 0.6%.
In the Asian session, at GMT0300, the pair is trading at 1.2375, with the GBP trading marginally higher against the USD from Friday's close.
The pair is expected to find support at 1.2332, and a fall through could take it to the next support level of 1.2288. The pair is expected to find its first resistance at 1.2448, and a rise through could take it to the next resistance level of 1.252.
With no economic releases in UK today, investor sentiment will be governed by global macroeconomic factors.
The currency pair is trading below its 20 Hr and 50 Hr moving averages.

Japan Recorded A Trade Surplus In February
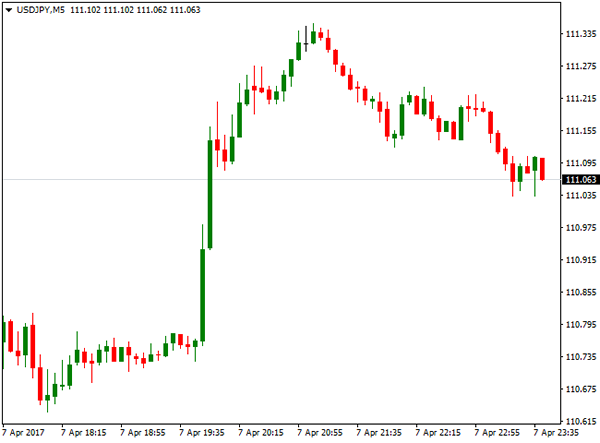
For the 24 hours to 23:00 GMT, the USD rose 0.32% against the JPY and closed at 111.19 on Friday.
In the Asian session, at GMT0300, the pair is trading at 111.43, with the USD trading 0.22% higher against the JPY from Friday’s close.
Overnight data revealed that Japan posted a more-than-expected trade surplus (BOP basis) of ¥1076.8 billion in February, compared to market expectations for the nation to post a surplus of ¥981.7 billion and following a deficit of ¥853.4 in the preceding month.
Meanwhile, the Bank of Japan Governor, Haruhiko Kuroda, vowed that the central bank will continue with aggressive easing until achieving 2.0% inflation target.
The pair is expected to find support at 110.50, and a fall through could take it to the next support level of 109.58. The pair is expected to find its first resistance at 111.96, and a rise through could take it to the next resistance level of 112.50.
The currency pair is trading above its 20 Hr and 50 Hr moving averages.

Swiss Unemployment Remained Steady In March
For the 24 hours to 23:00 GMT, the USD rose 0.35% against the CHF and closed at 1.0087 on Friday.
On the data front, Switzerland’s seasonally adjusted unemployment rate remained steady at 3.3% in March, meeting market expectations.
In the Asian session, at GMT0300, the pair is trading at 1.0099, with the USD trading 0.12% higher against the CHF from Friday’s close.
The pair is expected to find support at 1.0049, and a fall through could take it to the next support level of 1.0000. The pair is expected to find its first resistance at 1.0126, and a rise through could take it to the next resistance level of 1.0154.
The currency pair is trading above its 20 Hr and 50 Hr moving averages.

Canada’s Unemployment Rate Rose As Expected In March
For the 24 hours to 23:00 GMT, the USD declined 0.06% against the CAD and closed at 1.3408 on Friday.
Macroeconomic data showed that unemployment rate in Canada registered a rise to 6.7% in March, meeting market expectations. In the previous month, the unemployment rate had recorded a reading of 6.6%. Meanwhile, the nation's net number of people employed increased more-than-anticipated to a level of 19.4K in March, compared to a gain of 15.3K in the previous month.
In the Asian session, at GMT0300, the pair is trading at 1.342, with the USD trading 0.09% higher against the CAD from Friday's close.
The pair is expected to find support at 1.3365, and a fall through could take it to the next support level of 1.3309. The pair is expected to find its first resistance at 1.3451, and a rise through could take it to the next resistance level of 1.3481.
Ahead in the day, traders would keep a close watch on Canada's housing starts for March.
The currency pair is trading above its 20 Hr moving average and showing convergence with its 50 Hr moving average.

Will The USDJPY Remain Bullish In The Week Ahead?
Key Points:
- USDJPY likely to retain its bullish predisposition.
- RSI Oscillator bounces from oversold levels.
- Watch for a retracement back towards the 100-day MA in the coming week.
The USDJPY initially started last week in a deep slide following a disappointing Flash Manufacturing PMI result which slipped to 53.3. However, the pair's fortunes quickly turned around following the release of the U.S. Trade Balance data and the surprise fall in the unemployment rate. Subsequently, the pair largely turned bullish but it remains to be seen if it will retain this bias in the coming week. Therefore, let's review what occurred last week and what is potentially on the horizon for the venerable pair.
Last week started with a whimper as the pair slumped following a disappointing U.S. Flash Manufacturing PMI result of 53.3 which refocused the market on moving capital into the Yen as a safe haven. However, this negative sentiment quickly turned around following a surprise improvement in the U.S. Trade Balance to -43.6B which saw traders flooding back into long positions. In addition, the U.S. Labour market also impressed with the unemployment rate falling to 4.5% which sent the pair roaring to finish the week around the 111.11 mark.
The week ahead is likely to bring about further gains for the pair with a score of U.S. centric economic data due for release. In particular, the U.S. inflation data, as well as the PPI results are likely to set the pair's near term trend. The CPI result is expected to come in right on 0.2% m/m but we could see a slight uptick given the recent strength of the labour market. In contrast, the Japanese event to watch is the Core Machinery Orders data which is forecast around the 3.7% m/m mark. However, much of the other Japanese economic data is likely to prove relatively disappointing in comparison to the United States. Subsequently, expect the market to focus sharply on the U.S. inflation data and PPI and for these results to determine the pair's near term trend.
From a technical perspective, the pair's rally late in the trading week has taken price action back above the 12EMA which has also seen the RSI Oscillator rising away from oversold territory. Although the pair remains within the bounds of a falling channel, a short term rally throughout the coming week is likely and, subsequently, our initial bias is cautiously bullish. Support is currently in place for the pair at 111.22, 110.61, and 110.10. Resistance exists on the upside at 112.96, 113.74, and 114.94.
Ultimately, a return to USDJPY bullishness was always going to occur given the wide economic divide between both nations. However, the U.S. Unemployment Rate result surprised the market and subsequently the pair is likely to enter the new trading week in a relatively strong manner. The most likely scenario is a continued rally back towards the declining 100-day MA around the 112.20 mark in the coming week. However, keep a close watch on volatility around the release of the U.S. CPI figures.
Friday’s Slip Signals The NZD’s ABC Wave Is Likely To Complete
Key Points:
- Following last week's price action, another major slip could be seen this week.
- Technical and fundamental bias seems to be in line.
- We could see the 0.6861 level tested.
The NZD continues to retrace the long-term ABC wave that was mentioned last week and, after Friday's major stumble, the chances of seeing it complete are looking even better. As a result, it may be worth looking at how the Kiwi Dollar got to where it is and what is next on the agenda as this paircould have an exciting week on offer.
Starting with last week's performance, the Kiwi Dollar was in decline and experienced two major slips, one on Tuesday and the second on Friday. Starting with Tuesday, the move may have come as somewhat of a surprise given that the GDT Price Index came in at 1.6%, a second consecutive uptick for the index. However, an unexpected improvement in the US Trade Balance offset any potential buying pressure resulting from the GDT data and this saw the NZD experience a rather large slide. As for Friday's major tumble, this was an understandable response to the sharp contraction in the US Unemployment rate from 4.7% to 4.5%.
Potentially more interesting, is just how well the pair seems to be retracing the larger ABC wave. As discussed last week, the NZD remains fairly faithful to the typical wave formation which seems remarkable given the impact that fundamentals have had over the past weeks. Furthermore, now that the pair has closed below that 78.6% Fibonacci level, we may see it move to challenge the final robust zone of support around the 0.6861 handle. This move alone represents significant downside potential but, more importantly, it might mark the beginning of a severe decline over the coming weeks.
As for the impending week’s fundamental outlook, there isn’t much on the horizon on the NZ side of things, save for the Business NZ Manufacturing Index. As a result, the US data will be the key driver of the pair’s movements and should, therefore, be monitored accordingly. Of particular interest will be the US JOLTS Job Openings figure and the Unemployment Claims numbers which are expected to be fairly solid if the recent unemployment rate is any predictor. Due to this, we do expect to see the pair remain under pressure which would be in line with our expectations of seeing that 0.6861 level tested.
As for the near-term technical readings, the combination of the highly bearish EMA activity, the Parabolic SAR bias, and the recent MACD signal line crossover should see selling pressure intensify. Moreover, the neutrality of the RSI gives the pair plenty of room to sink before risking becoming oversold. Overall, this suggests that we are going to see more of that C leg form which could, in turn, lead to the forecasted breakout required for the long-term ABC wave to complete.
Ultimately, keep an eye on this pair as even if we don’t see a break out this week, there is plenty of downside action to capitalise on. As discussed, both fundamentals and technicals should be in line which makes challenging the 0.6861 handle a very achievable goal. Moreover, if this near-term bearishness is seen, chances of the wider pattern completing will be drastically improved which is also worth thinking about.
Weekly Technical Outlook And Review: EUR/USD, GBP/USD, AUD/USD, USD/JPY, USD/CAD, USD/CHF, DOW 30, GOLD
A note on lower timeframe confirming price action...
Waiting for lower timeframe confirmation is our main tool to confirm strength within higher timeframe zones, and has really been the key to our trading success. It takes a little time to understand the subtle nuances, however, as each trade is never the same, but once you master the rhythm so to speak, you will be saved from countless unnecessary losing trades. The following is a list of what we look for:
- A break/retest of supply or demand dependent on which way you're trading.
- A trendline break/retest.
- Buying/selling tails ... essentially we look for a cluster of very obvious spikes off of lower timeframe support and resistance levels within the higher timeframe zone.
- Candlestick patterns. We tend to only stick with pin bars and engulfing bars as these have proven to be the most effective.
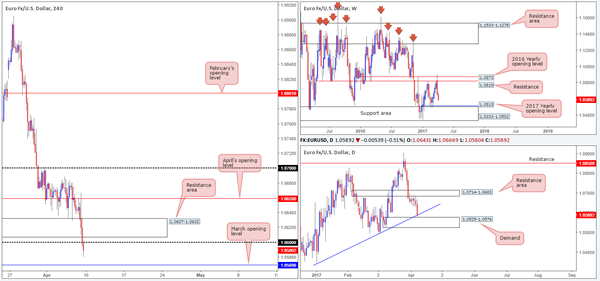
EUR/USD
Weekly gain/loss: – 67 pips
Weekly closing price: 1.0589
Last week's action shows that the EUR/USD extended its pullback from the 2016 yearly opening level at 1.0873, which could force the major to test the 2017 yearly opening level at 1.0515/support area at 1.0333-1.0502 sometime this week. With this area having been a considerable support and resistance zone in this market since late 1997, selling pressure is expected to diminish here.
Despite weekly price indicating further downside may be on the cards, daily action is seen testing a trendline support etched from a low of 1.0340, which happens to be positioned directly above a demand base at 1.0525-1.0576. While this area has a good chance of repelling price, it may be worth taking into consideration that the mentioned 2017 yearly opening level sits just beneath here, thus, a fakeout through this zone is a real possibility.
Following Friday's lower-than-expected US non-farm payrolls print at 98k, a slightly upbeat unemployment rate at 4.5% and average hourly earnings coming in as expected at 0.2%, the single currency aggressively spiked northbound and tested April's opening level at 1.0659. As can be seen on the H4 chart, buyers failed to sustain gains beyond this point and ended the day touching fresh lows beyond the 1.06 handle.
Our suggestions: A long from March's opening level seen at 1.0569 is certainly something to consider, given how it fuses with the nearby daily trendline support/daily demand area. With this being said however, there are two cautionary points to consider. Firstly, as explained above, the weekly chart suggests further selling could be seen. Secondly, there is little H4 structure seen around March's opening line. The closest place for stops here, in our view, is beyond the 9th March low at 1.0525! Therefore, in order to trade from here, we would advise waiting for a reasonably sized H4 bull candle to take shape, and place stops beyond its tail. The first take-profit from this angle can be seen at 1.06, followed closely by the resistance area planted at 1.0607-1.0632.
Data points to consider: Fed Chair Yellen speaks at the University of Michigan at 9.10pm GMT.
Levels to watch/live orders:
- Buys: 1.0569 region ([waiting for a reasonably sized H4 bullish candle to form before pulling the trigger is advised] stop loss: ideally beyond the trigger candle's tail).
- Sells: Flat (stop loss: N/A).
GBP/USD
Weekly gain/loss: – 177 pips
Weekly closing price: 1.2369
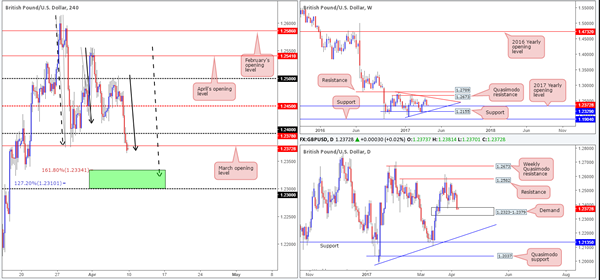
Breaking a three-week bullish phase, weekly bears rose up and took charge last week bringing the pound to within striking distance of the 2017 yearly opening level at 1.2329. Also of particular interest on the weekly timeframe is the potential bearish pennant currently in motion (1.2774/1.1986).
Climbing down to the daily candles, we can clearly see that the 2017 yearly opening level mentioned above is housed within the lower extremes of a daily demand base pegged at 1.2323-1.2379. This area held price beautifully on the 29th March, so we may see history repeat itself here.
Disappointing manufacturing and industrial production out of the UK on Friday sent the pair below the H4 mid-level support 1.2450. Further downside was seen shortly after this despite US non-farm payrolls coming in lower than expected. The week ended with the H4 candles closing beyond March's opening level at 1.2378.
Our suggestions: To make a long story short, we are currently interested in the 1.23/1.2334 (green) region for longs on the H4 chart. The reasons for why are as follows:
- There's a H4 AB=CD (filled arrows) 161.8% Fib ext. at 1.2334 taken from the high 1.2556. This denotes the top edge of our buy zone.
- There's also a H4 AB=CD (dashed arrows) 127.2% Fib ext. at 1.2310 drawn from the high 1.2615.
- A psychological barrier at 1.23, which represents the lower limit of our buy zone.
- Although this H4 buy zone slightly surpasses the daily demand at 1.2323-1.2379, we still consider this to be a plus point having this area involved.
- Housed within the buy zone and the daily demand area we have the 2017 yearly opening level at 1.2329.
To avoid any fakeout beyond 1.23, however, one may want to consider waiting for a reasonably sized H4 bullish candle to form prior to pressing the buy button. Stops can then be placed beyond this trigger candle.
Data points to consider: Fed Chair Yellen speaks at the University of Michigan at 9.10pm GMT.
Levels to watch/live orders:
- Buys: 1.23/1.2334 ([waiting for a reasonably sized H4 bullish candle to form before pulling the trigger is advised] stop loss: ideally beyond the trigger candle's tail).
- Sells: Flat (stop loss: N/A).
AUD/USD
Weekly gain/loss: – 126 pips
Weekly closing price: 0.7501
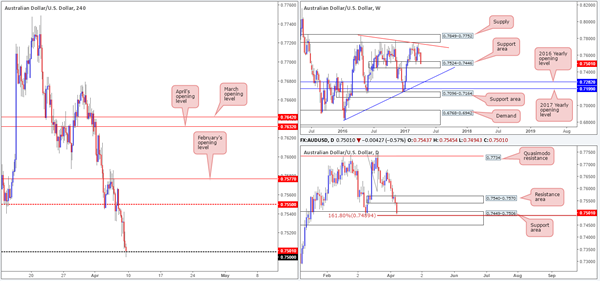
The commodity currency shredded over 100 pips last week, consequently forming a strong full-bodied weekly bearish candle. What's also notable from the weekly timeframe is that price shook hands with a support area at 0.7524-0.7446, which can be seen stretching as far back as mid-2016.
Also noteworthy on the daily timeframe is the unit crossed swords with a support area at 0.7449-0.7506. Housed within the noted weekly support area and also bolstered by a daily AB=CD (taken from the high 0.7749) 161.8% Fib ext. at 0.7489, this certainly places the bulls in a favorable position this week.
A quick recap of Friday's trading on the H4 chart shows that the Aussie tumbled down to the 0.75 handle going into the closing bell, even though US non-farm payrolls came in much lower than expected. Given that 0.75 is positioned within both the mentioned higher-timeframe support areas, we do expect to see some buying pressure emerge from here.
Our suggestions: Psychological handles are, in our humble opinion, prone to fakeouts. Seeing as how there's a 161.8% daily Fib ext. at 0.7489 lurking just 11 pips below this number, we are, therefore, anticipating a fakeout below 0.75 before buying is seen.
Should this come to fruition, and a decisive H4 close is seen back above 0.75, this would be considered a strong signal that the bulls are taking control here and may look to pull price back up to the 0.7550 neighborhood.
Data points to consider: Fed Chair Yellen speaks at the University of Michigan at 9.10pm GMT.
Levels to watch/live orders:
- Buys: Wait and see if price tests the 0.7489 level and closes back above 0.75 on the H4 chart. This is, in our view, evidence enough to justify a long position (stop loss: ideally beyond the trigger candle's tail).
- Sells: Flat (stop loss: N/A).
USD/JPY
Weekly gain/loss: – 31 pips
Weekly closing price: 111.05
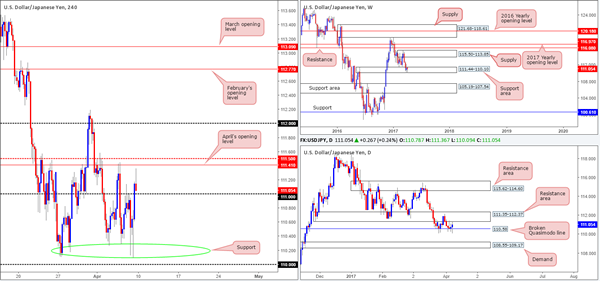
As can be seen from the weekly chart this morning, the pair continues to defend the support area at 111.44-110.10. In the event that the bulls maintain their presence here, the supply seen overhead at 115.50-113.85 will likely be the next area in the firing range. A violation of the current support area on the other hand, could set the stage for a downside move to another support area pegged at 105.19-107.54.
The story on the daily chart, nevertheless, shows that since the 23rd March the candles have been ranging between a resistance area at 111.35-112.37 and a broken Quasimodo line at 110.58. Therefore, until the resistance area is taken out we would be wary of committing to any intermediate-term buys at the moment.
The impact of Friday's disappointing non-farm payrolls data triggered an aggressive downside move to lows of 110.09. However, as you can see, there was little follow through generated after this, with price wrapping up the week closing above the 111 handle.
Our suggestions: In view of the daily range this is a challenging market to trade, in our opinion. The only area that really sparks interest this morning is April's opening level at 111.41, shadowed closely by the H4 mid-way resistance at 111.50 and the underside of the daily resistance mentioned above at 111.35. Before committing to a trade from here, we would require some form of lower-timeframe confirming sell signal (see the top of this report), since let's not forget that by shorting here, you're going against potential weekly buyers!
Data points to consider: Fed Chair Yellen speaks at the University of Michigan at 9.10pm GMT.
Levels to watch/live orders:
- Buys: Flat (stop loss: N/A).
- Sells: 111.50/111.41 region: ([waiting for a lower-timeframe confirming signal to form is advised] stop loss: dependent on where one confirms the area).
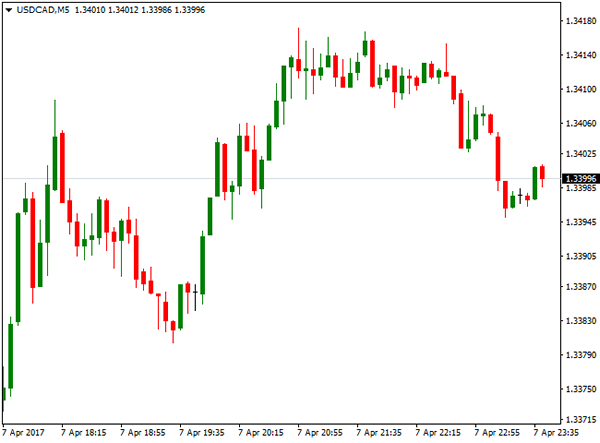
USD/CAD
Weekly gain/loss: + 89 pips
Weekly closing price: 1.3406
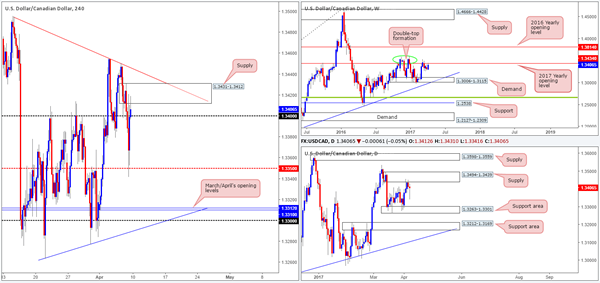
Weekly price has spent the best part of a month teasing the underside of the 2017 yearly opening level at 1.3434. Reinforcing this line is a well-defined double-top formation seen around the 1.3588 neighborhood (green circle). To the downside the next area of interest is a demand coming in at 1.3006-1.3115. A decisive push above the yearly level, however, could spark a round of buying up to the 2016 yearly opening level at 1.3814.
In conjunction with the 2017 yearly opening level there's a daily supply planted at 1.3494-1.3439 currently in motion. This is the first time this area has been tested and is so far holding firm. Should the bears continue to defend this barrier the next support area in the spotlight can be seen at 1.3263-1.3301.
On Friday, the loonie fell sharply following a poor US non-farm payrolls report, and a rather upbeat Canadian employment print. Despite this, the H4 mid-way support at 1.3350 stepped in and provided a floor for the buyers to neutralize this move! This saw the market close just above 1.34 and tag the nearby H4 supply at 1.3431-1.3412.
Our suggestions: As of the week's close, neither a long nor short seems attractive at the moment. To confirm short-term direction on the H4, we would need to see price either close above the current supply or push back below the 1.34 line.
Ultimately, given the position of weekly and daily price, we would prefer to see a close below 1.34. This would likely confirm strength from the noted higher-timeframe structures and potentially allow one to short down to 1.3350 on any retest seen to the underside of 1.34.
Data points to consider: Fed Chair Yellen speaks at the University of Michigan at 9.10pm GMT.
Levels to watch/live orders:
- Buys: Flat (stop loss: N/A).
- Sells: Watch for price to close back below 1.34 and then look to trade any successful retest thereafter (stop loss: ideally beyond the trigger candle's wick).
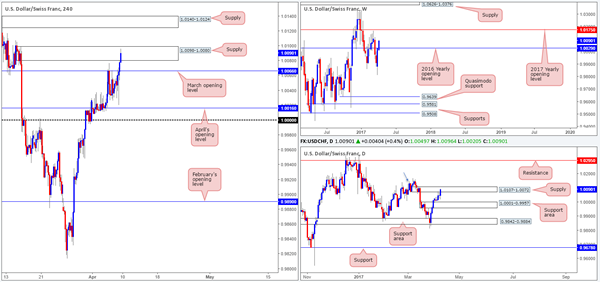
USD/CHF
Weekly gain/loss: + 64 pips
Weekly closing price: 1.0090
The Swissy, as you can see, managed to close above the 2016 yearly opening level at 1.0029 last week, following an extension of the previous week's run from weekly lows of 0.9813. A continuation move north from here could see price fake above the 6th March high at 1.0170 and unite with the 2017 yearly opening level at 1.0175.
Before the weekly buyers can lift price higher, nonetheless, daily supply at 1.0107-1.0072 will need to be consumed. Of course, a break above here will not automatically guarantee that price will rally to 1.0175, since there is a daily Quasimodo left shoulder seen marked with a blue arrow at 1.0146.
Friday's US employment report was a relatively mixed bag, with non-farm payrolls coming in much lower than expected at 98k! The aftermath saw an instant spike to lows of 1.0020, just a few pips ahead of April's opening level at 1.0016. The sellers clearly ran out of steam by this point as price reversed tracks and ended the week taking out March's opening line at 1.0066 and testing a H4 supply zone picked at 1.0098-1.0080.
Our suggestions: While we feel weekly price will drag this unit higher throughout the week, taking a long on the basis of this would be risky as there's both a H4 and daily supply currently in play! Given this factor, our desk has decided to hold fire today and wait and see if the daily bulls can print a close above the noted supply zone, before thinking about longs.
Data points to consider: Fed Chair Yellen speaks at the University of Michigan at 9.10pm GMT.
Levels to watch/live orders:
- Buys: Flat (stop loss: N/A).
- Sells: Flat (stop loss: N/A).
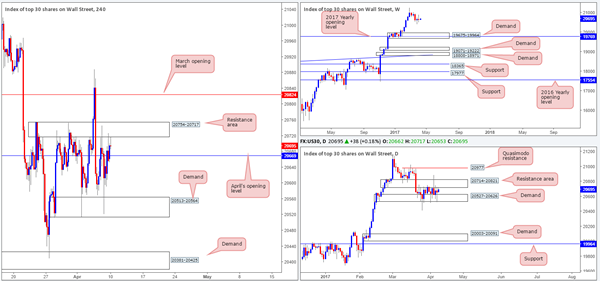
DOW 30
Weekly gain/loss: – 12 points
Weekly closing price: 20657
US equities are effectively unchanged this week, despite the index ranging 370 points! Right now, there is very little weekly structure seen until the index crosses swords with demand at 19675-19964, which happens to intersect with the 2017 yearly opening level at 19769.
Since the 22nd March, the daily candles have experienced a significant amount of choppy action between demand plugged at 20527-20626 and the resistance area at 20714-20821. A violation of this demand would likely open up the path south down to demand pegged at 20003-20091 (located just above the aforementioned weekly demand and daily support at 19964). A push above the resistance area, however, would likely place the Quasimodo resistance at 20977 in the limelight.
Jumping across to the H4 chart, we can see that price is teasing the underside of a resistance area seen at 20754-20717. Although this could encourage further selling, April's opening level at 20669 is seen relatively nearby and could potentially throw a spanner in the works.
Our suggestions: Neither a long nor short seems attractive at this time. As such, our desk has noted that they would like to see daily price breach its current range before trading this market.
Data points to consider: Fed Chair Yellen speaks at the University of Michigan at 9.10pm GMT.
Levels to watch/live orders:
- Buys: Flat (stop loss: N/A).
- Sells: Flat (stop loss: N/A).
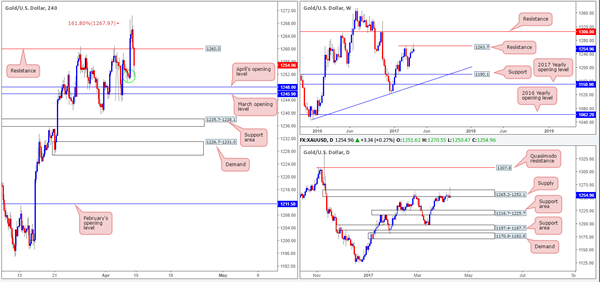
GOLD:
Weekly gain/loss: + $6.9
Weekly closing price: 1254.9
Weekly buyers printed their fourth consecutive weekly gain last week and managed to touch gloves with a weekly resistance level fixed at 1263.7. The week's close, as you can probably see, chalked up a nice-looking selling wick that could very well encourage shorts to come in a break lower.
In line with weekly flow, we can see that daily action drew in a selling wick within the walls of a supply zone at 1265.2-1252.1. This – coupled with weekly structure, could send the unit down to the support area marked at 1216.7-1225.7.
Over on the H4 candles, H4 flow is seen testing a minor demand base marked with a green circle at 1249.5-1251.6, following a selloff from the H4 161.8% Fib ext. at 1267.9 (taken from the low 1243.6). Given the higher-timeframe structure, and the fact that there are two monthly levels sitting directly below (April and March's opening lines at 1245.9/1248.0); we have absolutely no interest in trying to go long from the demand base!
Our suggestions: Although H4 price will likely bounce from between the two noted monthly levels, we would feel uncomfortable taking a position here simply because of where price is located on the bigger picture! In essence, our plan of action going into today's segment is to sit tight and reassess going into tomorrow's open.
Levels to watch/live orders:
- Buys: Flat (stop loss: N/A).
- Sells: Flat (stop loss: N/A).
European Open Briefing: Markets Remained In Risk-Off Mode Overnight
Global Markets:
- Asian stock markets: Nikkei up 0.65 %, Shanghai Composite fell 0.30 %, Hang Seng gained 0.05 %, ASX 200 rallied 0.60 %
- Commodities: Gold at $1255 (-0.20 %), Silver at $17.97 (-1.00 %), WTI Oil at $52.40 (+0.30 %), Brent Oil at $55.38 (+0.25 %)
- Rates: US 10-year yield at 2.39, UK 10-year yield at 1.08, German 10-year yield at 0.24
News & Data:
- Japanese Trade Balance BoP Adjusted (JPY) Feb: 1076.8B (exp 981.7B; prev -853.4B)
- Japanese BoP Current Account Balance (JPY) Feb: 2813.6B (exp 2615.6B; prev 65.5B)
- Australia Home Loans (MoM) Feb: -0.5% (exp -0.5%; prev 0.5%)
- PBoC Fixes USDCNY Reference Rate At 6.9042 (prev fix 6.8949 prev close 6.9010)
- BoJ Gov Kuroda: Will Maintain QE With Yield Curve Control for As Long as Needed to Achieve 2% Inflation in Stable Manner
- BoJ's Kuroda: Will Continue Expanding Monetary Base Until Core CPI Stably Exceeds 2%
- Fed’s Bullard: Job Report Consistent With 2% Growth
- Bullard: Fed Has Been Predicting Slowdown in Jobs Growth
- Bullard: Think Inflation Going to Stay About Where It Is Now
- Bullard: US Economy Not as Strong as We’d Like
CFTC Positioning Data:
- EUR short 11K vs 8K short last week. Shorts increase by 3K
- GBP short 100K vs 104K short last week. Shorts trimmed by 4K
- JPY short 46K vs 53K short last week. Shorts trimmed by 7K
- CHF short 14K vs 16K short last week. Shorts trimmed by 2K
- CAD short 30K vs 28K short. Shorts increased by 2K
- AUD long 50K vs 53K long. Longs trimmed by 3K
- NZD short 15K vs 13K short last week. Shorts increased by 2K
Markets Update:
Markets remained in risk-off mode overnight. Geopolitical tensions are weighing on sentiment, and safe havens are in demand. Euro started the new trading week at 1.0570 and managed to recover to 1.0590 later in the session. Resistance is seen at 1.0620, followed by 1.0650. GBP/USD traded in a 1.2365-85 range. Key support is seen in the area between 1.2350 and 1.2360. Should the currency pair break below it, a larger correction seems likely.
USD/JPY rallied from 111.00 to 111.60 in Asia, but ran out of momentum in the late Tokyo session. Resistance above 111.50 remains strong. Meanwhile, the Aussie Dollar extended losses and fell below 0.75. This suggests that a test of 0.74 will follow soon.
Upcoming Events:
- 09:00 GMT – Italian Industrial Production
- 09:30 GMT – Euro Zone Sentix Investor Confidence
- 13:15 GMT – Canadian Housing Starts
- 21:10 GMT – Fed Chair Yellen speaks
The Week Ahead:
Tuesday, April 11th
- 02:30 GMT – Australian NAB Business Confidence
- 09:30 GMT – UK CPI
- 10:00 GMT – German ZEW Economic Sentiment
- 10:00 GMT – Euro Zone Industrial Production
- 10:00 GMT – Euro Zone ZEW Economic Sentiment
- 15:00 GMT – US JOLTs Job Openings
- 18:45 GMT – FOMC Member Kashkari speaks
Wednesday, April 12th
- 02:30 GMT – Chinese CPI
- 07:00 GMT – German WPI
- 09:30 GMT – Bank of England Governor Carney speaks
- 09:30 GMT – UK Unemployment Rate
- 09:30 GMT – UK Claimant Count Change
- 09:30 GMT – UK Average Earnings Index
- 15:00 GMT – Bank of Canada Rate Decision
- 15:00 GMT – Bank of Canada Statement
- 15:30 GMT – US Crude Oil Inventories
- 16:15 GMT – Bank of Canada Governor Poloz speaks
Thursday, April 13th
- 02:30 GMT – Australian Employment Change
- 02:30 GMT – Australian Unemployment Rate
- 07:00 GMT – German CPI
- 07:45 GMT – French CPI
- 09:00 GMT – Italian CPI
- 13:30 GMT – US PPI
- 13:30 GMT – US Initial Jobless Claims
- 15:00 GMT – US Michigan Consumer Sentiment
Friday, April 14th
- 13:30 GMT – US CPI
- 13:30 GMT – US Retail Sales
Weekly Report: Energy, Commodities, Indices, Forex
ENERGY
WTI Oil was among the top winners, ending week above $52.00 per barrel, on the second bullish week. Oil price initially broke above psychological $50.00 barrier and accelerated higher on strong fall in Crude inventories. API report that was released on Tuesday showed stronger than expected drop in crude stocks that fell by 1.83 million barrels previous week, that improved the sentiment in the markets, as investors were also hoping on extension of OPEC and non-OPEC members agreement on keeping production limited that would ease rowing fears of global oversupply.
However, oil price was cooled by disappointing EIA weekly crude stocks report released on Wednesday that showed build in crude inventories by 1.6 million barrels in the previous week, heavily beating forcast for 435.000 barrels build.
The report slowed oil's rally and price briefly returned below $50.00 handle, however, easing was short-lived. North Korea's missile test was the initial boost for oil prices that rose on renewed political uncertainty, with US missile strikes on Syria on Friday, adding fresh support to oil price that accelerated further up. US WTI oil contact for May delivery hit fresh one-month high at $52.92 on Friday, establishing strong bullish sentiment that would boost oil price further and re-attract key med-term barriers at $55.00 zone in coming days.
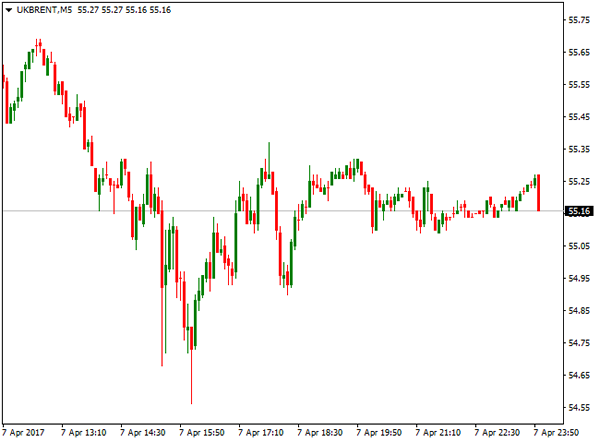
Brent Crude Oil followed positive sentiment and peaked at $56.06 per barrel on Friday, hitting the highest level in one month and ending the second consecutive week in strong bullish mode. Brent price was initially boosted by production shortage in North Sea fields, with fresh political uncertainty over newly developed political over North Korea and US attack on Syria that also cooled significantly relations between Russia and the United States, being supportive for further rise in oil prices.
COMMODITIES
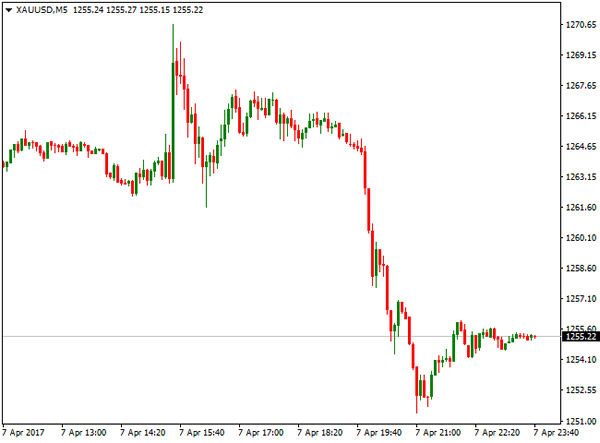
Spot gold ended week positively despite Friday's sharp pullback, after being on track stronger weekly gains. Friday's strong safe haven buying on fresh crisis over Syria, pushed gold price to new highs, hitting levels last seen in November 2016. Friday's rally broke above strong technical barriers at $1258/63 that generated bullish signals for acceleration above $1280 per once, as gold remained supported by global political uncertainty and risk-off mode that increased the appetite for safe-haven assets.
However, US jobs data that boosted the dollar, weakened strong bullish sentiment, as gold price ended week below pivots at $1258/63 and closed at $1255.
Gold was also pushed lower by unchanged hopes that Fed may hike rates again in June, after US jobs report did not dent these expectations. Gold is sensitive to moves in US interest rates and signals of increasing rates increase pressure on the yellow metal.
Technical studies remain bullish, with increasing political uncertainty, seen as supportive factor for yellow metal's action in coming days. Near-term focus remains shifted up and gold may attempt higher after completing current correction.
Solid supports lay at $1250 zone, with extended downticks seen contained above the next set of supports at $1240 zone, in order to keep bullish setup intact for renewed attempts higher.
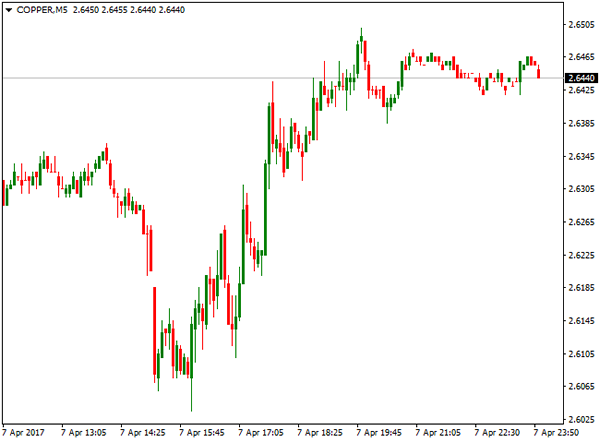
Copper contract for May delivery ended week in neutral mode, with weekly action being shaped in Doji candle, signalling strong indecision. The price ranged between $2.5935 and $2.6940 during the week, getting boosted after Chinese markets returned to business after holidays. However, gains proved to be short-lived, as bearishly aligned technical studies kept rallies limited and short-term price action holding in the range for the second week. Copper price is limited between two technical boundaries at 2.6345 and 2.6726, with clearer direction signals seen on break of either side.
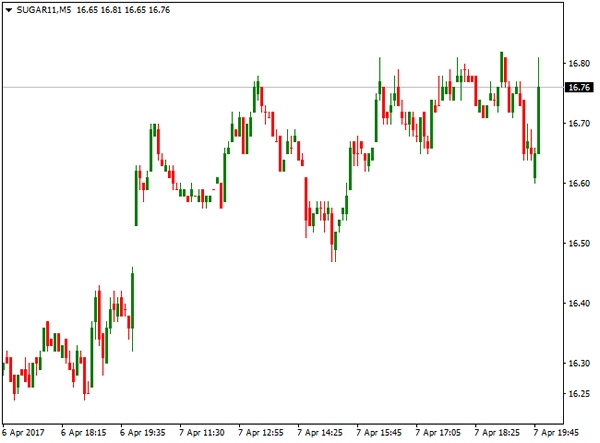
Sugar11 contract for May delivery remained in red for the fifth straight week and dipped to fresh eleven-month low at $16.04 on Wednesday. Bounce in past two days is seen as technical correction on strongly oversold conditions. Corrective rally is facing strong barrier at $17.09, which is expected to cap rallies and keep strong overall bearish picture intact. Technical studies confirm strong bearish sentiment after Head and Shoulders pattern was formed on weekly chart, indicating that sugar price may fall further. Important Fibonacci support at $16.87 has been dented that gives strong bearish signal for further easing. After correction, fresh weakness may extend next targets at $15.23 and $15.00.
INDICES
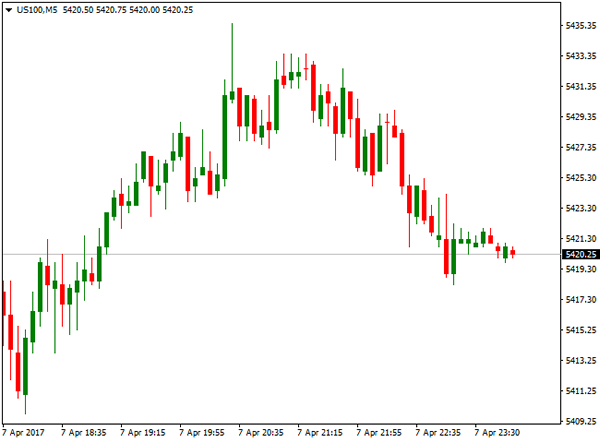
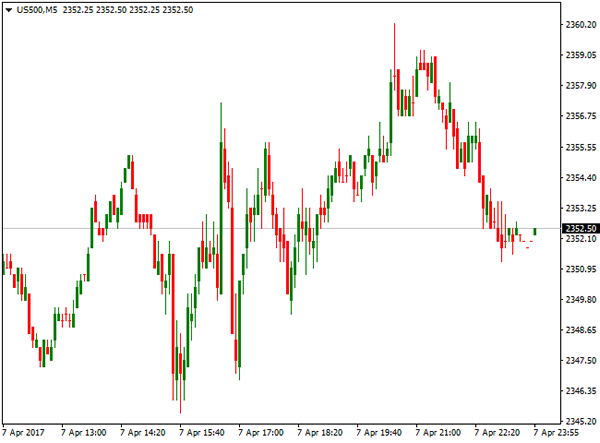
US benchmark indices: Dow Jones; Nasdaq 100 and S&P 500 ended week in positive/neutral mode. Nasdaq 100 Index hit fresh all-time high on Wednesday at 5481, as Us stocks were boosted by stellar private jobs report that underscored the strength of the economy. Positive economy outlook boosted financial stocks and calmed investors' fears about President Trump's ability to deliver on his policy plans.
Nasdaq 100 index ranged between 5382 and 5481 during the past week, but failed to hold gains and ended week lower at 5422.
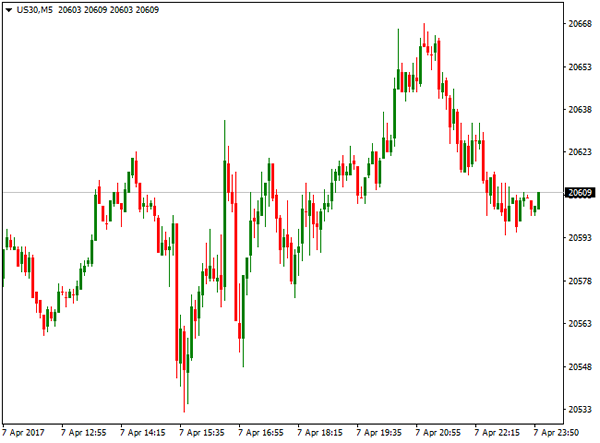
Dow Jones index ended week in neutral mode, shaped in weekly Doji candle, but remains within broader consolidation in past two weeks, after pullback from fresh record high, posted on Mar 1 showed signs of stall. Weakening daily technical studies show risk of further easing, as investors are looking for signals about the strength of the US economy, with increased political uncertainty in light of the latest US attack at Syria and stronger US dollar, seeing the index under pressure in the near-term.
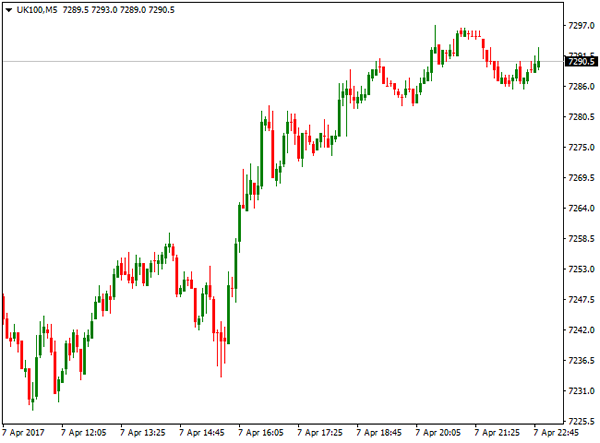
Britain's FTSE 100 index registered the second straight bullish week and enjoyed support from weaker pound. The index ended Friday's trading at 7290, slightly above important Fibonacci barrier that could be seen as a trigger for further recovery. The price remains underpinned by rising daily Ichimoku cloud and eyes next pivotal barrier at 7311, break of which would be seen as additional bullish signal.
FOREX
Series of top releases influenced money market last week. US Federal Reserve released minutes of FOMC last meeting in March on Wednesday. Minutes sent some warning signs to the markets that resulted in strong fall of the US dollar against Japanese yen that reached lows, last seen in late November 2016.
With gradual increase in interest rates being already priced in, main warning from minutes was an indication that Fed is ready to target the over bloated balance sheet. The discussions of reducing the balance sheet that is currently at $4.5 trillion, suggests double tightening policy, on higher interest rats and reduction in Quantitative Easing programme.
This is expected to be the next topic in monetary policy action, with key question of whether the Fed will be able to apply these policies without causing serious disruptions in the markets. If the US economy continues to grow, trimming of Fed's balance sheet towards the end of the year would make sense, as Fed is looking to start normalization process of its balance sheet that needs to come down significantly from its current size, but without decision on its desired levels being made so far.
The minutes of ECB's March 9 meeting were released on Thursday. The ECB kept its stance and message unchanged at the March meeting, the removal of a reference to being ready to act with all available instruments - was taken by markets as a hawkish shift, with some considering it as a signal for earlier-than-expected policy normalization. This brought forward predictions for the ECB's first interest rate increase in years, even as policymakers tried to cool those expectations, arguing that they merely signalled reduced risk, not quicker. ECB President Mario Draghi and Chief Economist Peter Praet both suggested on Thursday that the bank will stick to its policy path, including for bond buying and record-low rates, for some time to come, as they are not yet convinced the euro zone economy is back to health.
The CNB (Czech central bank) has dropped it peg with the Euro on Thursday, ending long-held currency regime. With stronger volatility being expected, on bad experience on Swiss peg debacle two years ago, reaction of Czech koruna was moderate after the decision.
US jobless claims recorded their biggest drop in nearly two years last week, pointing to further tightening in the labour market. Initial claims for unemployment benefits declined 25.000 to 234.000, in the week ended April1, in the largest drop since April 25 2015. Claims have now been below 300.00 threshold for or 109 straight week, in the longest stretch since 1970 and being currently near full employment.
The dollar appreciated against the euro and yen on better than expected jobless claims data.
The United States made unilateral action on Friday and attacked Syrian airbase from which it said a deadly chemical weapons attack was launched last week. The US army fired a dozens of cruise missiles during the attack from two US warships. The attack immediately raised tensions with Russia, as spokesman for Russian President Vladimir Putin said the strike had seriously damaged ties between Washington and Moscow. This was the toughest direct US action in six-year war that left US President Donald Trump facing his biggest foreign policy crisis since he entered the White House in January. US officials announced that the attack was the single strike and there are no plans for further escalation.
US Non-Farm payrolls report was released Friday and strongly disappointed on only 98K new jobs created in March, compared to upbeat results in first two months of 2017. Forecast for March was 180K, below 235K in February and upwards-revised numbers in January to 238K. After initial strong rise in Jan/Feb due to mild weather that mainly affected construction sector on seasonal hiring, sharp slowdown in March was seen mainly on fall in the temperatures and storms that lashed the Midwest and Northeast.
However, unemployment rate dropped to near 10-year low at 4.5% in March, down from 4.7% in the previous month, suggesting that labour market strength remained intact after miss in NFP numbers. Mixed jobs report pushed the dollar higher against the basket of major currencies, in view that June rate hike remained unaffected by release of US jobs data.
The Euro ended the second straight week in red against the dollar, after holding for most of the week within 1.0620/1.0700 congestion on mixed signals. The single currency showed no significant reaction after the second TV debate of French presidential candidates and also stayed without clear direction after speech of ECB president Mario Draghi and minutes of ECB's last monetary policy meeting.
The pair was eventually pushed lower and took out key technical supports after dollar accelerated on US jobs data. Strong bearish close on Friday suggests that the Euro may extend weakness after losing 1.0600 handle.
British pound was in a choppy mode for most of the week, being initially pressured by lower than expected UK Manufacturing and Construction PMI data that raised fears of slowdown in the economy, but received boost on upbeat Service PMI data that jumped to 55.0 in March from 53.3 in February and also beating the forecast at 53.5.
However, surveys show that UK economy probably slowed in Q1, compared to its strong growth last year. Cooling jobs market and Brexit getting underway were the main factors of slowdown. In addition, unexpected slide in British industrial output, further clouded the outlook for the UK's economy. Sterling accelerated lower strongly after \UK data, with additional pressure coming on strengthening dollar. Cable broke below cluster of strong technical supports and ended week in red for the first time after three consecutive weeks of gains, turning near-term outlook in negative mode.
Japanese yen failed to capitalize on strong safe-haven buying last week that was triggered by increased risk aversion on political uncertainty after North Korea's missile launch and US attack on Syria. Yen was well supported during the week but lacked momentum for final break below psychological 110.00 barrier against US dollar. Several strong downside rejections during last week generated signal of possible basing, as the dollar bounced strongly after jobs data on Friday and attacked the upper pivotal barrier at 111.36, weekly Ichimoku cloud top, easing mounting downside risk on several attempts at 110.00 support zone.
Canadian dollar reached four-day high against the US dollar on Friday on stronger than expected domestic employment data. Canada added 19.400 new jobs in March against forecasted 5000 new jobs. CAD's rally that peaked at 1.3340 and reversed over half of losses made during the week, proved to be short-lived, as greenback managed to recover and return back to 1.3400 zone, marking bullish end of the week.