Sample Category Title
Foreign Exchange Market Commentary
EUR/USD
European currencies saw little action this Thursday, holding within familiar ranges amid a scarce macroeconomic calendar and the absence of a major catalyst. The EUR/USD pair settled at 1.0787, pretty much unchanged daily basis, having however, set a lower low and a lower high daily basis. The market seems to have made a pause as the 'Trump trade' is undergoing a major test, given that the Obamacare repeal bill is in the Congress. A positive vote from policy makers, may revive investors hopes, somehow paving the way for policies related with tax cuts and growth.
Germany releases the GFK consumer confidence survey for April early London, showing that sentiment eased as the survey resulted at 9.8 from previous 10.0, with rising inflation denting buying power. In the US, weekly unemployment claims rose in the week to March 17th to the highest in seven weeks, printing 258K against expectations of 240K and previous revised 243K. New Home Sales, on the other hand, surprised to the upside, rising by 6.1% in February to a seasonally adjusted total of 0.592M. Attention this Friday will center in March preliminary PMIs for the EU, expected to show that both, the manufacturing and the services sectors, remain in the growth path.
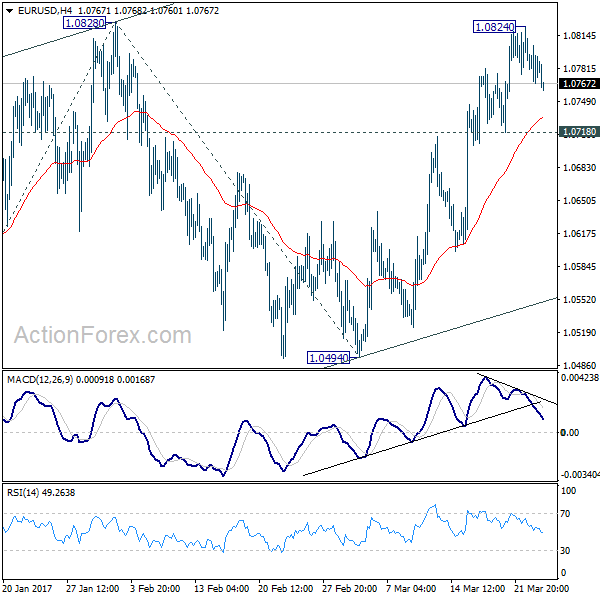
The upward strength continued fading in the short term, as in the 4 hours chart, the price is now stuck around a still bullish 20 SMA, whilst technical indicators have turned lower, with the Momentum already below the 100 level and the RSI around 54, while selling interest around 1.0820 remains strong. Still, the price needs to accelerate below 1.0765 to begin a downward corrective move, while only below 1.0700 bears will retake the lead. At this point, the pair needs to surpass 1.0828, February monthly high, to confirm a bullish extension towards 1.0870, December high.
Support levels: 1.0765 1.0730 1.0700
Resistance levels: 1.0830 1.0870 1.0910
USD/JPY
The USD/JPY pair advanced up to 111.57 at the beginning of the day, as Wall Street closed mixed, but fell afterwards to a fresh 2017 low of 110.62, to settle at 111.00. Asian share markets closed with modest gains, while European ones saw a dull session, hovering around their opening levels and settling not far away from them. US equities edged modestly higher, but that was not enough to help the pair bounce. An early recovery met strong selling interest on an approach to the 111.60 resistance from where the pair resumed its decline, indicating that speculators are now preferring to sell the rallies. Japan will releases its leading index and the March preliminary manufacturing PMI, expected at 53.5 from previous 53.3. In the 4 hours chart, technical indicators remain within oversold territory, with the RSI indicator heading modestly lower at 27, while the 100 and 200 SMAs slowly turning south far above the current level. Renewed selling pressure below 110.70 should open doors for a continued decline towards 109.90, the 50% retracement of the November/December rally.
Support levels: 110.70 110.30 109.90
Resistance levels: 111.15 111.60 112.00
GBP/USD
The GBP/USD pair managed to advance up to 1.2530, ending the day a few pips below the level as the Pound found support on strong February Retail Sales data. Sales rose by 1.4% in the month, while compared to a year earlier, sales jumped 3.7%, well above the 2.6% or the previous revised 1.0%. Excluding fuel, sales rose 1.3% MoM, following two months of decline, taking the year-on-year rate to 4.1%. The CBI survey released later in the day, showed that sales volumes grew at a steady pace in the year to March, and slightly faster than expected, with 44% of retailers saying that sales volumes were up on a year ago, whilst 35% said they were down, giving a balance of +9%, above the 5% expected but matching previous month's reading. The pair maintains its positive tone, although the intraday advance stalled a few pips below a major resistance, the 23.6% retracement of the January's rally at 1.2540, now the level to surpass to confirm additional gains. In the 4 hours chart the price is well above a bullish 20 SMA, but technical indicators are retreating from overbought levels, reaffirming the case for the need of a bullish breakout of the mentioned Fibonacci resistance before considering going long.
Support levels: 1.2500 1.2460 1.2425
Resistance levels: 1.2540 1.2585 1.2620
GOLD
Gold prices' advance extended for a sixth consecutive day, as investors continued trading against the greenback. Spot reached a daily high of $1,253.20 a troy ounce, its highest February 28th before pulling back to end the day flat at 1,242.70. The retracement came as a consequence of sharp declines in many other metals, and as the Dollar Index posted a modest recovery, alongside with US Treasury yields. Investors are now waiting for the US Congress decision over the healthcare bill to decide whether to keep buying the commodity or not. In the meantime, the daily chart shows that the price was unable to settle above the 200 DMA, but continues pressuring it for a third consecutive day. The Momentum indicator in the mentioned chart continues heading north well above the 100 level, whilst the RSI indicator turned flat around 62, indicating fading buying interest, although not enough to confirm a bearish correction from current levels. In the 4 hours chart, the price holds above a strongly bullish 20 SMA, whilst technical indicators are retreating from overbought levels, still well above their mid-lines. A downward corrective move can extend down to 1,230.00 without affecting the bullish trend, but a break below this last will turn the risk towards the downside.
Support levels: 1,242.80 1,236.80 1,230.10
Resistance levels: 1,251.30 1,263.80 1,272.80
WTI CRUDE
Crude oil prices resumed their declines this Thursday, with West Texas Intermediate futures down to $47.66 a barrel, as the focus remained on the persistent global glut. Hopes that the OPEC would deal with an oversupply market, boosted prices last November, but after three months into the output cut, the commodity has gave back most of the gains achieved after the announcement, amid increasing US production, which led American stockpiles to record highs. The daily chart for WTI shows that the 20 DMA extended its slide far above the current level, having crossed below the 100 DMA and pointing to cross below the 200 DMA, this last at 49.30, whilst technical indicators are neutral-to-bearish within oversold readings, all of which supports further slides. In the 4 hours chart, a bearish 20 SMA rejected an early advance, whilst technical indicators have extended their declines within negative territory, in line with the longer term perspective.
Support levels: 47.00 46.40 45.80
Resistance levels: 48.10 48.70 49.30
DJIA
After spending most of the day above their opening levels, US indexes turned lower ahead of the close, with all of the three major indexes closing marginally lower. Stocks fell in the last minutes of trading on news indicating that the vote of the Obamacare repeal bill was delayed, as the GOP struggles for support. The Dow Jones Industrial Average shed 4 points and settled at 20,656.58. The Nasdaq Composite closed at 5,817.69, down by 4 points, whilst the S&P lost 0.11% to end at 2,345.96. Within the DJIA, Nike was the best performer, up 2.63%, followed by El du Pont that added 1.62%. UnitedHealth Group led decliners, shedding 1.19%, followed by Travelers Cos that closed 0.74% lower. Daily basis, the Dow technical picture is bearish, as the index remained well below its 20 DMA, whilst technical indicators held within negative territory, with the RSI now turning south around 41, anticipating some further slides for this Friday. In the 4 hours chart, the 20 SMA maintains a sharp bearish slope and is about to cross below the 200 SMA above the current level, whilst the Momentum indicator has managed to correct some within negative territory, but the RSI indicator holds around 36, also maintaining the risk towards the downside.
Support levels: 20,610 20,578 20,526
Resistance levels: 20,707 20,742 20,783
FTSE 100
The FTSE 100 managed to recover some ground this Thursday, as European shares surged, following the positive lead from Asia. The Footsie closed the day 15 points or 0.22% higher at 7,340.71. Next shares led the advance, closing the day up 8.08%, despite reporting their first fall in annual profits in eight years. The news was no surprise, as the retailed warned on profits last January. Marks & Spencer followed, adding 3.82%. Mining-related equities were the worst performers, as base metals came under pressure, alongside with pharmaceuticals, ahead of the US Obamacare repeal bill vote. Randgold Resources was the worst performer, down 2.74%, followed by Glencore, down 2.40%, and Hikma Pharmaceuticals that shed 2.22%. The daily chart for the London benchmark shows that it held below its 20 DMA, with an advance up to it, at 7,346 being quickly reverted, and technical indicators holding within bearish territory, with limited downward scope. In the 4 hours chart, attempts to advance were contained by a horizontal 100 SMA, whilst the 20 SMA turned lower far above it, and technical indicators turned back south within bearish territory, all of which favors additional declines on a break below 7,301, the weekly low.
Support levels: 7,301 7,262 7,239
Resistance levels: 7,346 7,384 7,429
DAX
The German DAX settled at 12,039.68, up 137 points or 1.14%, with all European equity benchmarks closing in the green. Financials led the advance as lenders borrowed more than expected under the ECB's TLTRO program, up to 233.5 billion euros for four-year loans, in anticipation of a continued rise in lending. Within the DAX, Deutsche Lufthansa was the best performer, rising 3.23%, followed by RWE AG that added 2.40%. Volkswagen was the worst performer, shedding 0.91%, while Infineon Technologies shed 0.29%, as well as Deutsche Bank. The index eased in after-hours trading, barely holding above the 12,000 level, and with the daily chart showing that the bearish tone seen earlier this week has eased, given that the index settled above a horizontal 20 SMA, whilst technical indicators turned higher, now entering positive territory. In the 4 hours chart, however, the upward potential seems limited, as the benchmark is unable to clearly break above a bearish 20 SMA, whilst the Momentum indicator turned lower after failing to overcome its mid-line, and the RSI indicator also retreated around its mid-line.
Support levels: 11,957 11,895 11,851
Resistance levels: 12,045 12,091 12,139
Market Morning Briefing
STOCKS
Almost all equities globally has bounced yesterday as expected. Some stable movement is possible in the near term with attempts of rising further in the coming sessions.
Dow (20656.58, -0.02%) is holding above the channel support on the daily and if it continues to hold, we may see the index inch up towards 21000-21200 in the near term.
Dax (12039.68, +1.14%) has also bounced in line with expectation and could re0test resistance near 12200 in the coming sessions before again coming off towards 11900. The channel on the daily candles holds good for now.
Nikkei (19275.18, +0.99%) bounced from levels near 19000 and could move up towards 19400 in the near term. Overall the broad 19600-18600 region is expected to hold for at least a couple of weeks.
Shanghai (3248.52, 0%) is in a clear channel uptrend and while it holds above 3225-3250, near term looks bullish. There is enough room on the upside towards 3300 and even higher for the long term.
Nifty (9086.30, +0.62%) has bounced back from support on the 3-day candles and while that holds, it could possibly re-test 9100-9150 in the near term.
COMMODITIES
Gold (1243) was almost unchanged and trading within a narrow range of 1240-51. We continue to look for a close below 1240 levels in the near term to take fresh sell positions. But before that it may spend a few sessions within the 1240-55 regions.
Silver (17.57) has tested its pivot at 17.45-48 since last few sessions but unable to gather momentum to close higher. Overall we need to wait for confirmation for immediate directional clarity.
Copper (2.62) is trading within a range of 2.57-2.70. Only above 2.70, higher resistances of 2.80 can come into consideration. In the medium term 2.55-57 are going to be a strong support now and a close below that could open up 2.49 levels respectively.
Brent (50.57) and WTI (47.34) has fallen in line with our expectation. Considering the short term oversold sate, we may see some profit taking rally towards their respective resistances of 52-53 for Brent and 48.50-49.80 for WTI respectively. But the trend is still bearish. Any corrective bounce may face selling pressure at the higher levels.
FOREX
The Republicans have delayed the voting on the health care bill which may take place tonight. The markets will determine the capability of the Trump administration to deliver its pro-growth promises from the outcome of this vote and the direction of the Dollar may depend on that.
Dollar Index (99.98) is in a minor bounce with the major trend remaining down. Another leg to the downside still may be left which may take it down to 99.00-98.50, the major support. Resistance remains unchanged at 100.50-70.
Euro (1.0762) has weakened slightly and now is close to the immediate support at 1.0750 below which it may drop to 1.0700-1.0670. Downside possibilities can’t be discarded until a break above 1.0830-50 is seen.
Dollar-Yen (111.29) has made a low at 110.59, not too far away from our target of 110.00 but no sign of any bottoming action is visible yet. Some sideways consolidation in the band of 110.50-112.00 may take place for the next few sessions, which may resolve to the downside.
Pound (1.2489) is digesting its recent gains but the higher target of 1.2650-1.2700 remains unchanged with support coming at 1.2440-20.
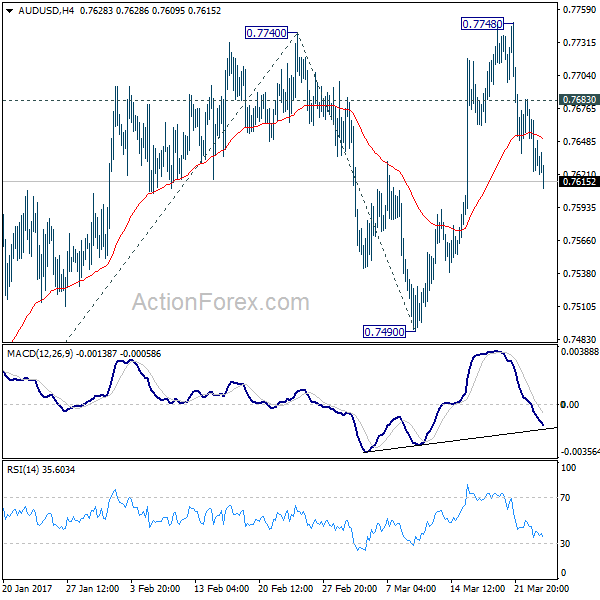
Aussie (0.7616) is close to the near term support of 0.7600-0.7585 which may hold and keep the currency in the range of 0.7600-0.7750 for a few sessions more.
Dollar Rupee (65.52) may end the week in the narrow range of 65.30-60 and may come out of the range next week only.
INTEREST RATES
The US yields have paused and is trying to rise from current levels. The 5yr (1.97%), 10YR (2.44%) and the 30Yr (3.04%) are trading slightly higher and could move up in the near term.
The US-Japan 10YR (2.37%) has bounced in line with our expectation and while it tries to move up in the near term, it could pull up Dollar-Yen along with itself.
The Japanese 5Yr (-0.15%) has risen from support just below current levels and could move higher towards -0.10% in the near term. The 10yr 90.0750 and the 30Yr (0.84%) have also slightly risen and could move higher in the near term.
GBP/JPY Daily Outlook
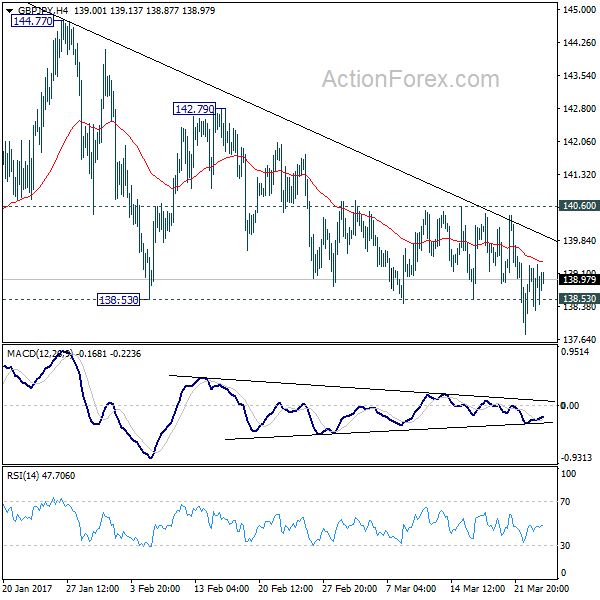
Daily Pivots: (S1) 138.33; (P) 138.82; (R1) 139.36; More...
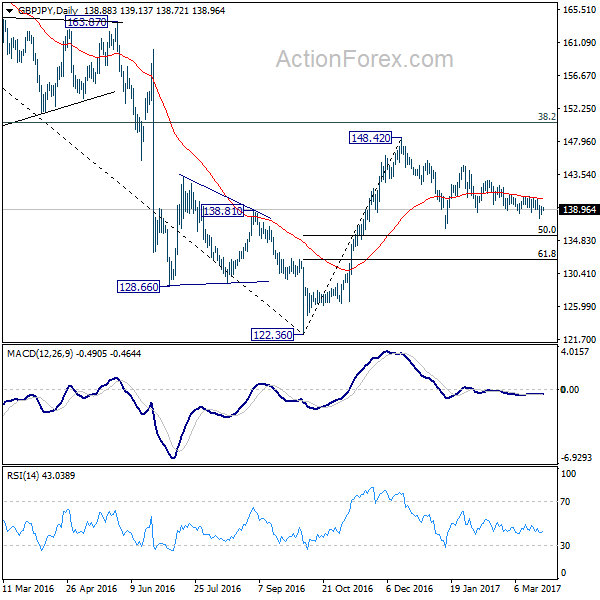
At this point, deeper decline is expected in GBP/JPY with 140.60 minor resistance intact, for 136.44 support and possibly below. Overall, price actions from 148.42 are viewed as a consolidation pattern. We'd expect 50% retracement of 122.36 to 148.42 at 135.39 to contain downside and bring rebound. On the upside, break of 140.60 resistance will turn bias to the upside and send GBP/JPY through 144.77 resistance.
In the bigger picture, price actions from 122.36 medium term bottom are still seen as a corrective pattern. Main focus is on 38.2% retracement of 195.86 to 122.36 at 150.42. Rejection from there will turn the cross into medium term sideway pattern. Or, sustained break of 50% retracement of 122.36 to 148.42 at 135.39 will turn outlook bearish for a test on 122.36 low. Though, sustained break of 150.42 will extend the rebound towards 61.8% retracement of 195.86 to 122.36 at 167.78.
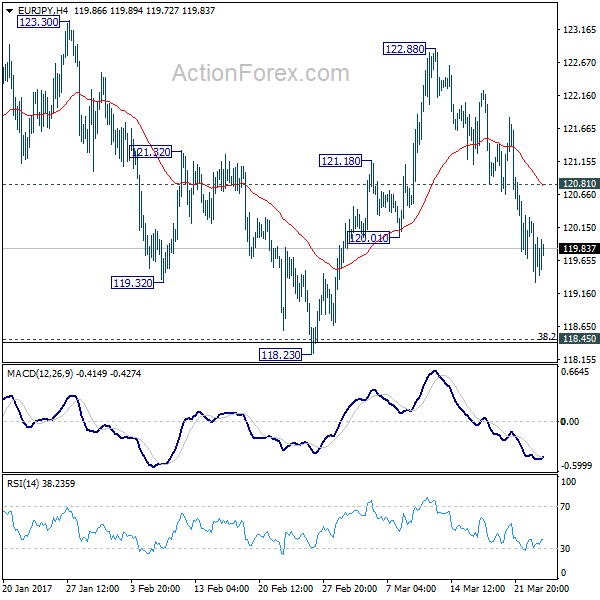
EUR/JPY Daily Outlook
Daily Pivots: (S1) 119.19; (P) 119.74; (R1) 120.17; More...
EUR/JPY drops to as low as 119.32 so far and intraday bias stays on the downside for 118.39/45 key cluster level (38.2% retracement of 109.20 to 124.08 at 118.39). Current fall is seen as part of the consolidation pattern from 124.08. We'd expect strong support from 118.39/45 to contain downside and bring rebound. On the upside, above 120.81 minor resistance will turn bias back to the upside for 122.88 and then 124.08.
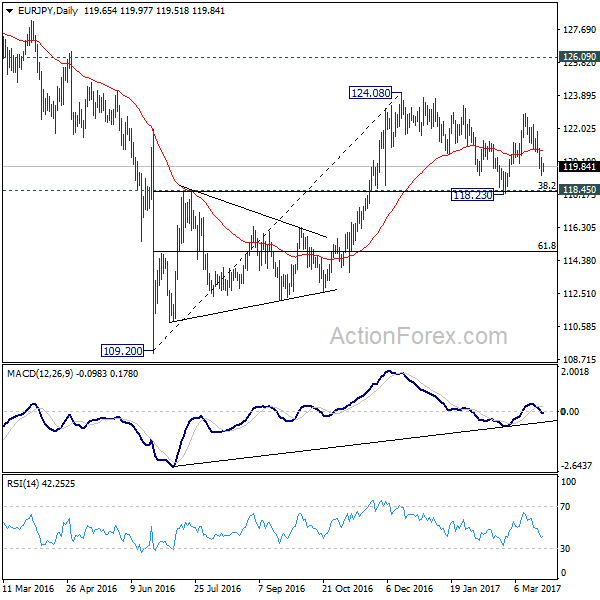
In the bigger picture, we're holding on to the view that medium term rise from 109.20 is still in progress. Focus is on 126.09 key resistance level. Sustained break will confirm completion of the whole decline from 149.76. And rise from 109.20 is of the same degree as the fall from 149.76. In such case, further rally would be seen to 104.04 resistance and possibly above before topping. Meanwhile, rejection from 126.09, or firm break of 118.45 cluster support, will likely extend the fall from 149.76 through 109.20 low.
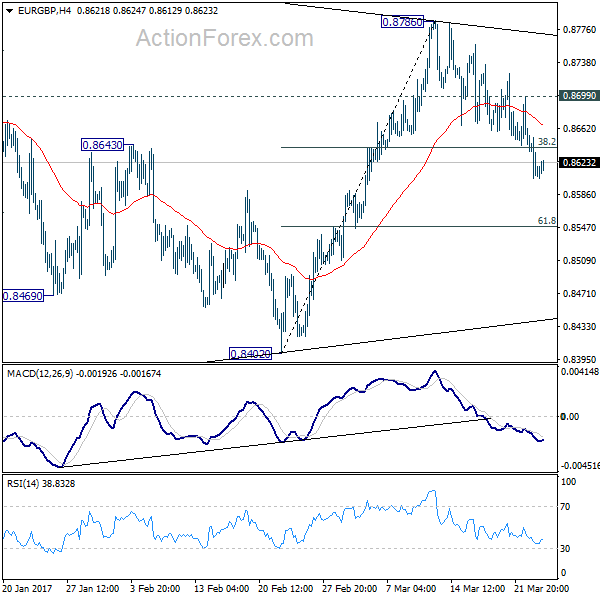
EUR/GBP Daily Outlook
Daily Pivots: (S1) 0.8593; (P) 0.8624; (R1) 0.8642; More...
EUR/GBP's fall extended to as low as 0.8604 so far. The solid break of 38.2% retracement of 0.8402 to 0.8786 at 0.8639 will now pave the way to 61.8% retracement 0.8549 and possibly below. On the upside, above 0.8699 minor resistance will turn bias back to the upside for 0.8786 resistance. Overall, price actions from 0.8303 are seen as the second leg of the corrective pattern from 0.9304. Fall from 0.9304 should resume later.
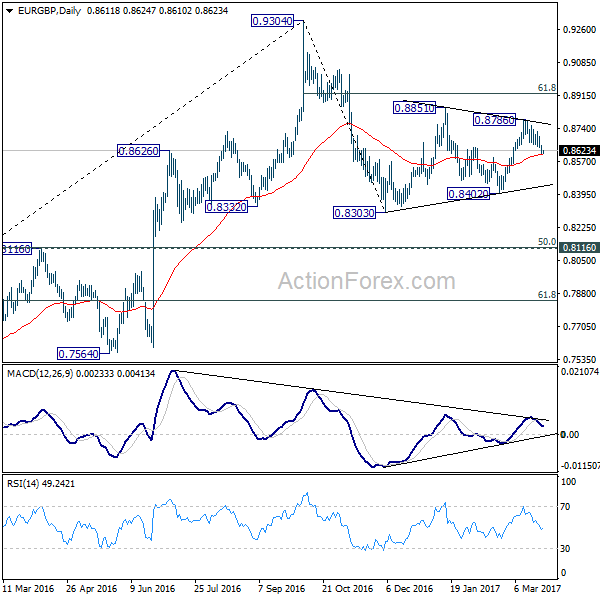
In the bigger picture, price actions from 0.9304 are viewed as a medium term corrective pattern. Deeper fall cannot be ruled out yet. But we'd expect strong support from 0.8116 cluster support (50% retracement of 0.6935 to 0.9304 at 0.8120) to contain downside. Overall, the corrective pattern would take some time to complete before long term up trend resumes at a later stage. Break of 0.9304 will pave the way to 0.9799 (2008 high).
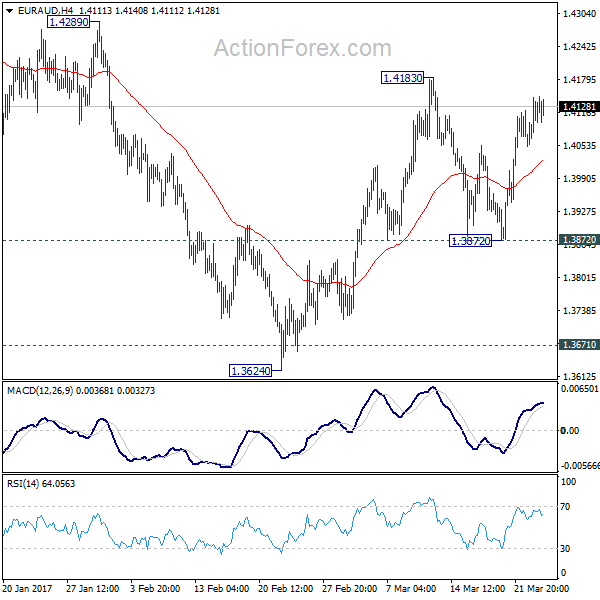
EUR/AUD Daily Outlook
Daily Pivots: (S1) 1.4076; (P) 1.4112; (R1) 1.4171; More...
Intraday bias in EUR/AUD remains neutral for the moment as it's staying in range below 1.4183. Overall, with 1.3872 intact, we're still favoring the case of trend reversal after defending key support level at 1.3671. This is supported by bullish convergence condition in daily MACD. On the upside, above 1.4183 will turn bias to the upside for 1.4289 resistance next. Break will affirm our view and target next key resistance level at 1.4721. However, break of 1.3872 minor support will invalidate our view and turn bias back to the downside for retesting 1.3624 low.
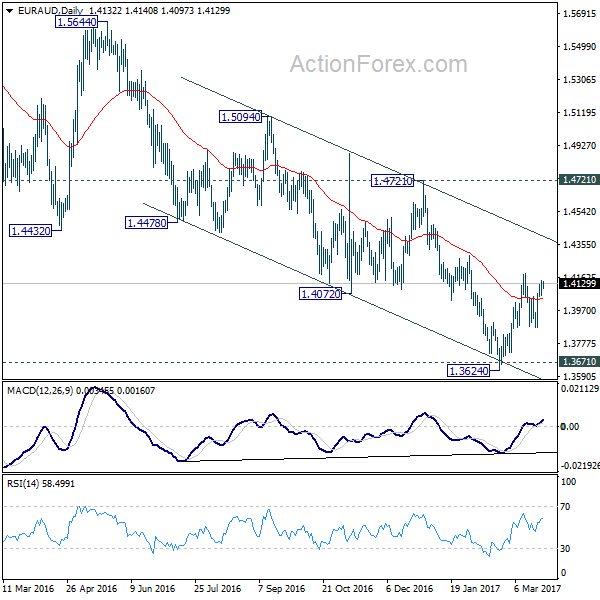
In the bigger picture, price actions from 1.6587 medium term top are viewed as a corrective pattern. We'd expect strong support from 1.3671 key level to contain downside and bring rebound. Up trend from 1.1602 should not be finished and will resume later. Break of 1.4721 resistance will indicate completion of such correction and turn outlook bullish for retesting 1.6587 high. However, sustained break of 1.3671 will invalidate our bullish view and would turn focus back to 1.1602 long term bottom.
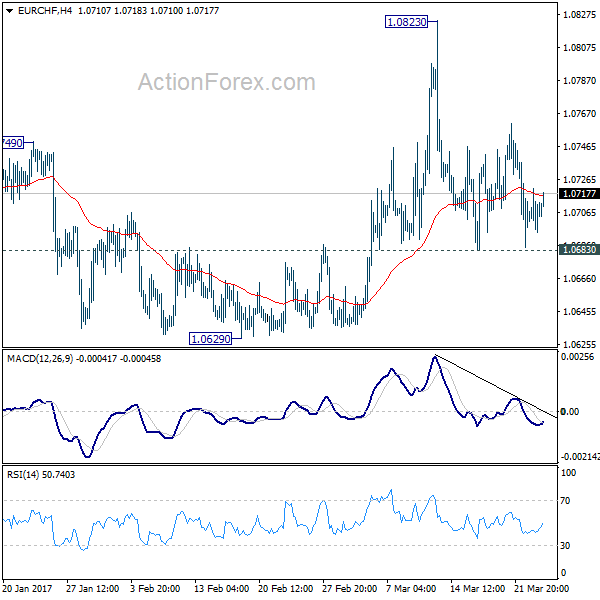
EUR/CHF Daily Outlook
Daily Pivots: (S1) 1.0696; (P) 1.0709; (R1) 1.0723; More...
Intraday bias in EUR/CHF remains neutral as range trading continues. On the upside, break of 1.0823 resistance will re-affirm the case of trend reversal. And intraday bias will be turned back to the upside for 1.0897 resistance for confirmation. However, break of 1.0683 minor support will turn bias to the downside for 1.0620 key support level again.
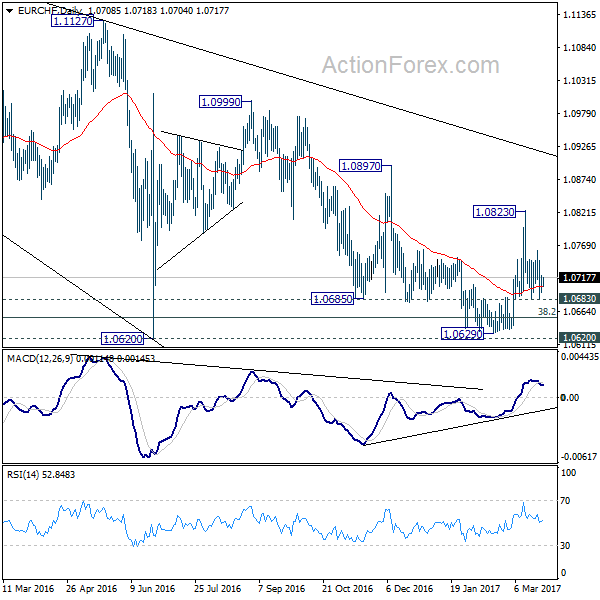
In the bigger picture, the decline from 1.1198 is seen as a corrective move. Decisive break of 1.0897 resistance should confirm that it's completed. And in that case, larger up trend is resuming for another high above 1.1198. Meanwhile, sustained trading below 38.2% retracement of 0.9771 to 1.1198 at 1.0653 will target 50% retracement at 1.0485.
AUD/USD Daily Outlook
Daily Pivots: (S1) 0.7607; (P) 0.7642; (R1) 0.7662; More...
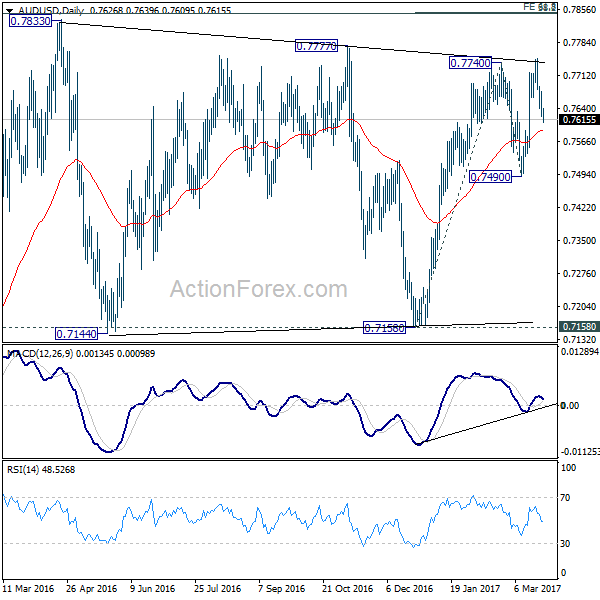
Intraday bias in AUD/USD remains on the downside for the moment. Fall from 0.7748 should target 0.7490 first. Break there will indicate completion of whole rise from 0.7158 and turn near term outlook bearish. On the upside, though, above 0.7683 minor resistance will turn bias back to the upside for 0.7748 and above. At this point, we'd continue to expect strong resistance from long term retracement level at 0.7849 to limit upside.
In the bigger picture, we're still treating price actions from 0.6826 low as a correction. And, as long as 38.2% retracement of 0.9504 to 0.6826 at 0.7849 holds, long term down trend from 1.1079 is expected to resume sooner or later. Break of 0.6826 low will target 0.6008 key support level. However, firm break of 0.7849 will indicate that rise from 0.6826 is developing into a medium term rebound, rather than a sideway pattern. In such case, stronger rise should be seek to 55 month EMA (now at 0.8169) and above.
USD/CAD Daily Outlook
Daily Pivots: (S1) 1.3325; (P) 1.3340; (R1) 1.3366; More....
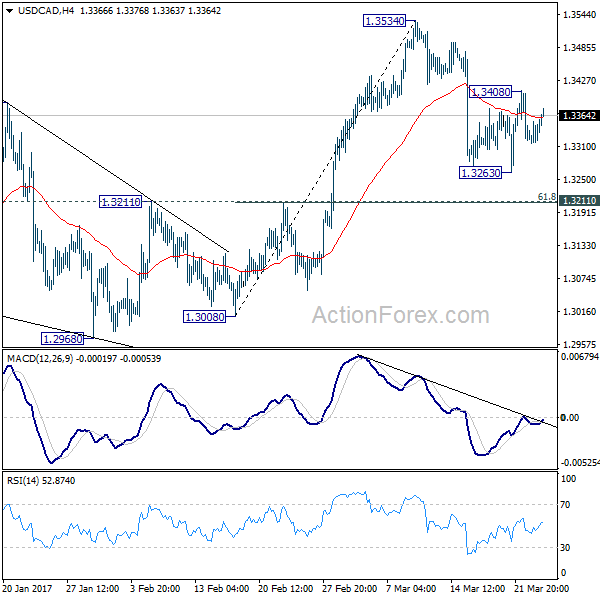
Intraday bias in USD/CAD stays neutral for the moment. On the upside, above 1.3408 will affirm the case that pull back from 1.3534 has completed. And, intraday bias will be back on the upside for retesting 1.3534. Break there will target 1.3598 high. On the downside, in case of another fall, we'd expect strong support from 1.3211 cluster level (61.8% retracement of 1.3008 to 1.3534 at 1.3209) to contain downside and bring rebound. Overall, we're still expecting the medium term rise from 1.2460 to resume later.
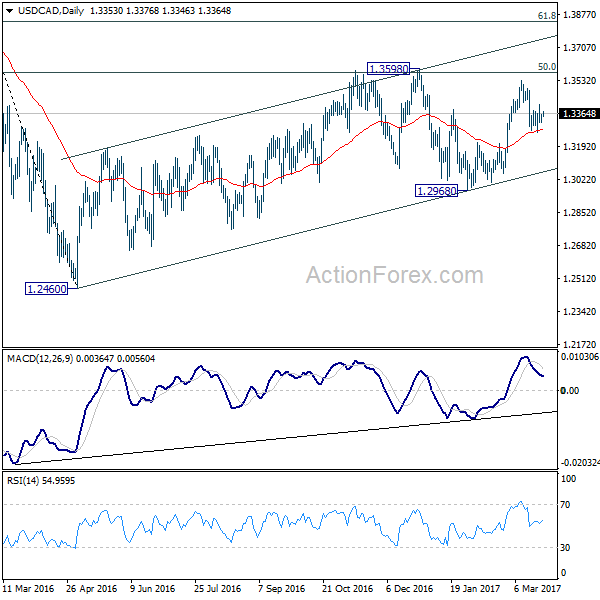
In the bigger picture, price actions from 1.4689 medium term top are seen as a correction pattern. The first leg has completed at 1.2460. The second leg is likely still in progress and could target 61.8% retracement of 1.4689 to 1.2460 at 1.3838. We'd look for reversal signal there to start the third leg. Break of 1.2968 wold at least bring at retest of 1.2460 low. However, sustained trading above 1.3838 would pave the way to retest 1.4689 high.
EUR/USD Daily Outlook
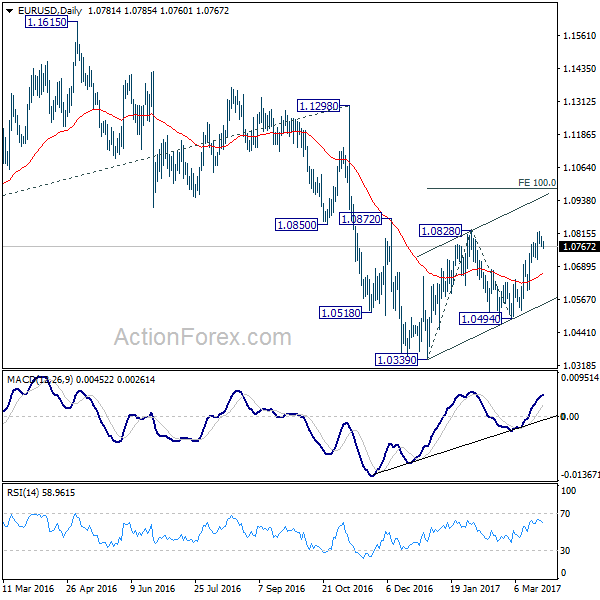
Daily Pivots: (S1) 1.0766; (P) 1.0785 (R1) 1.0804; More.....
In the bigger picture, as long as 1.1298 key resistance holds, whole down trend from 1.6039 (2008 high) is still expected to resume later. Break of 1.0339 low will send EUR/USD through parity to 61.8% projection of 1.3993 to 1.0461 from 1.1298 at 0.9115.