Sample Category Title
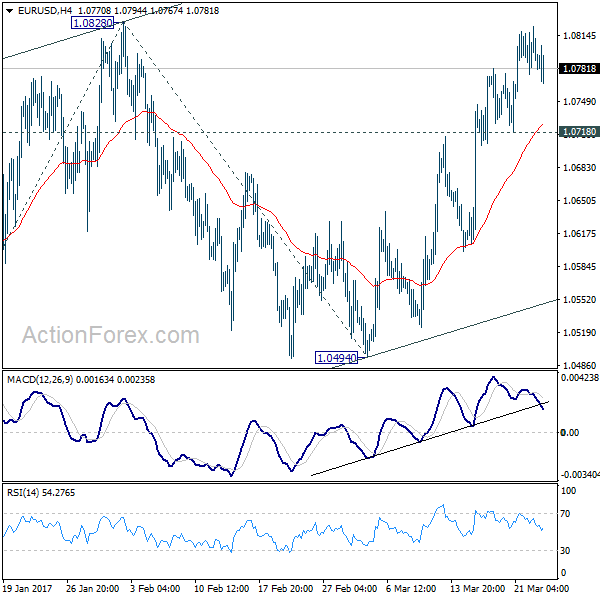
EUR/USD Mid-Day Outlook
Daily Pivots: (S1) 1.0774; (P) 1.0799 (R1) 1.0823; More.....
With 1.0178 minor support intact, further rise is still expected in EUR/USD. Break of 1.0828 resistance will target 100% projection of 1.0339 to 1.0828 from 1.0494 at 1.0983. However, as rise from 1.0339 is seen as a corrective move. We'd expect upside to be limited by 1.0983 to complete the correction. On the downside, break of 1.0718 minor support will turn bias to the downside for 1.0494 support first.
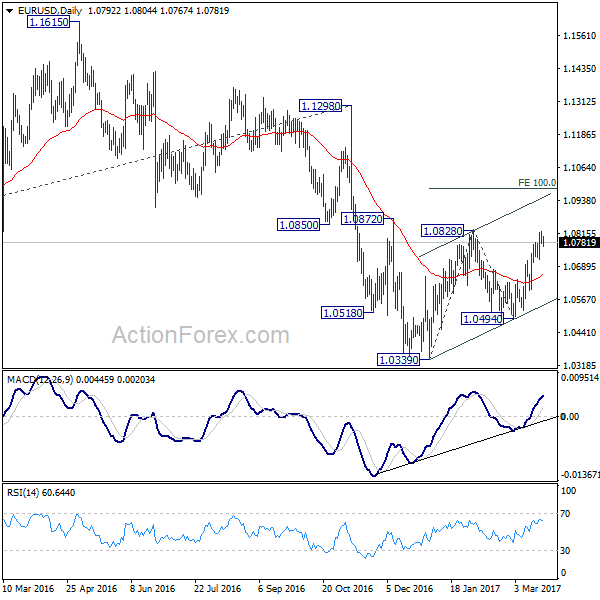
In the bigger picture, as long as 1.1298 key resistance holds, whole down trend from 1.6039 (2008 high) is still expected to resume later. Break of 1.0339 low will send EUR/USD through parity to 61.8% projection of 1.3993 to 1.0461 from 1.1298 at 0.9115.
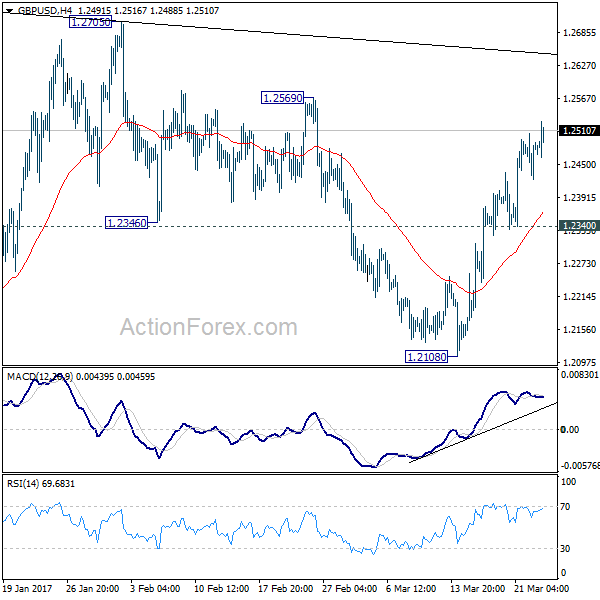
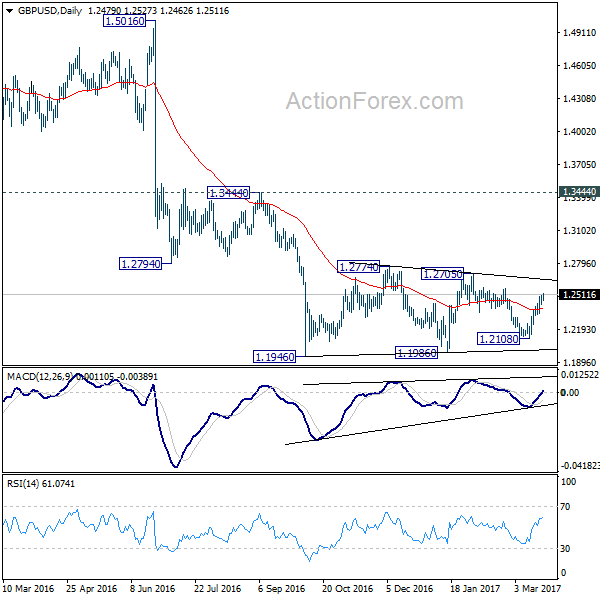
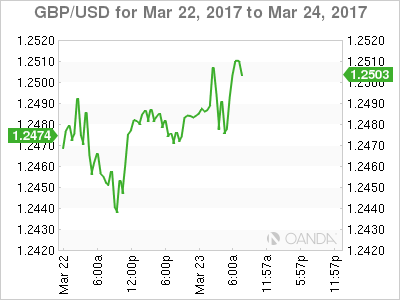
GBP/USD Mid-Day Outlook
Daily Pivots: (S1) 1.2434; (P) 1.2470; (R1) 1.2517; More...
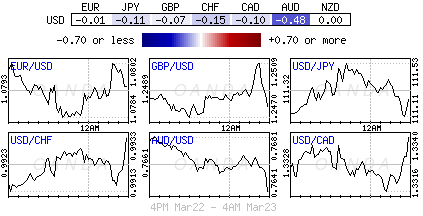
Intraday bias in GBP/USD remains on the upside for 1.2569 resistance. Break there will target 1.2705/74 resistance zone. But still, price actions from 1.1946 are seen as a consolidation pattern. Hence, we'd expect strong resistance from 1.2705/2774 to limit upside and bring down trend resumption. On the downside, break of 1.2340 support will turn bias back to the downside for 1.2108 support. Though, sustained break of 1.2774 will extend the rise towards 1.3444 key resistance level.
In the bigger picture, fall from 1.7190 is seen as part of the down trend from 2.1161. There is no sign of medium term bottoming yet. Sustained trading below 61.8% projection of 2.1161 to 1.3503 from 1.7190 at 1.2457 will target 100% projection at 0.9532. Overall, break of 1.3444 resistance is needed to confirm medium term bottoming. Otherwise, outlook will remain bearish.
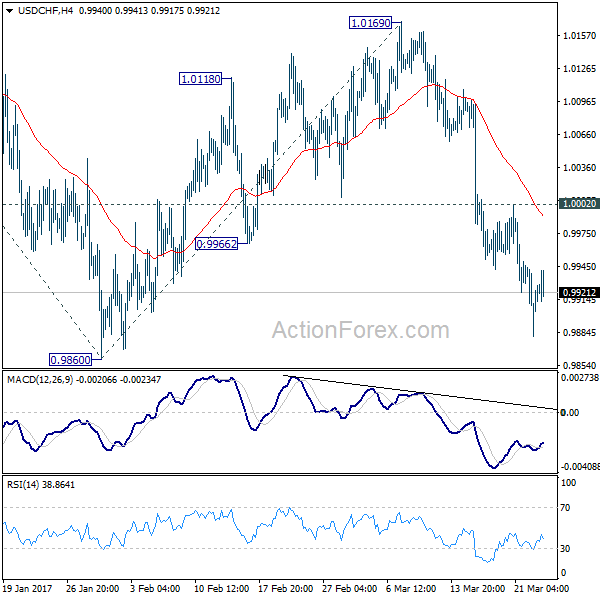
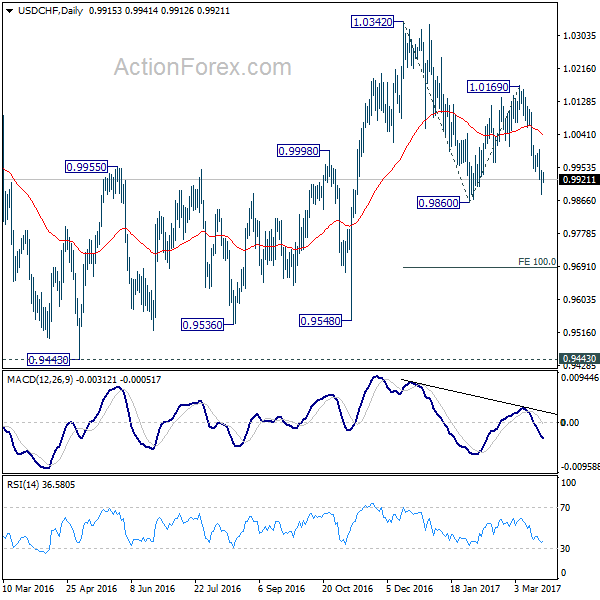
USD/CHF Mid-Day Outlook
Daily Pivots: (S1) 0.9881; (P) 0.9913; (R1) 0.9946; More.....
With 1.0002 minor resistance intact, deeper decline is still expected in USD/CHF for 0.9860 support. Break there will resume whole decline from 1.0342 and target 100% projection of 1.0342 to 0.9860 from 1.0169 at 0.9687. Nonetheless, on the upside, break of 1.0002 minor resistance will turn bias back to the upside for 1.0169 resistance instead.
In the bigger picture, USD/CHF is staying in medium term sideway pattern between 0.9443/1.0342. In any case, decisive break of 1.0342 resistance is needed to confirm underlying strength. Otherwise, we'll stay neutral in the pair first. In case of another fall, we'd expect strong support from 0.9443/9548 support zone.
Canadian Dollar Ignores Weak US Job Report, Canadian CPI Ahead
USD/CAD has edged lower in the Thursday session. Early in the North American session, the pair is trading at 1.3320. On the release front, there are no Canadian economic indicators. In the US, unemployment claims jumped to a 7-week high, rising to 258 thousand. This was well above the forecast of 258 thousand. Later in the day, New Home Sales is expected to improve to 566 thousand. Federal Reserve Chair Janet Yellen will speak at an event in Washington, and FOMC members Neel Kashkari and Robert Kaplan will also deliver speeches on Thursday. On Friday, Canada publishes CPI, one of the most important economic indicators. CPI was unexpectedly high in January, at 0.9%. The February report is expected to slip to 0.2%.
Canada's retail sales were stellar in January, indicative of a strong increase in consumer spending. Core Retail Sales jumped 1.7%, beating the forecast of 1.3%. This marked the strongest gain since February 2015. Retail Sales sparkled with a gain of 2.2%, compared to an estimate of 1.3%. The strong figures point to a strong first quarter for the economy, and weak retail sales data in December appear to be a seasonal distortion. However, the Canadian dollar was unable to take advantage and couldn't gain ground against the greenback.
With a dearth of economic releases this week, the markets have been focusing on speeches from FOMC members. Earlier this week, Chicago Fed President Charles Evans said he expected the Fed to raise rates two more times this year. This projection was in line with the Fed's dot plot (which remain unchanged) as well as last week's rate statement. Although one could make a strong case that three rate hikes in 2017 would be impressive, the markets appear disappointed, and would like four hikes, given the strong performance of the US economy. The Fed's cautious approach has soured sentiment towards the greenback, resulting in the dollar heading lower against its major rivals.
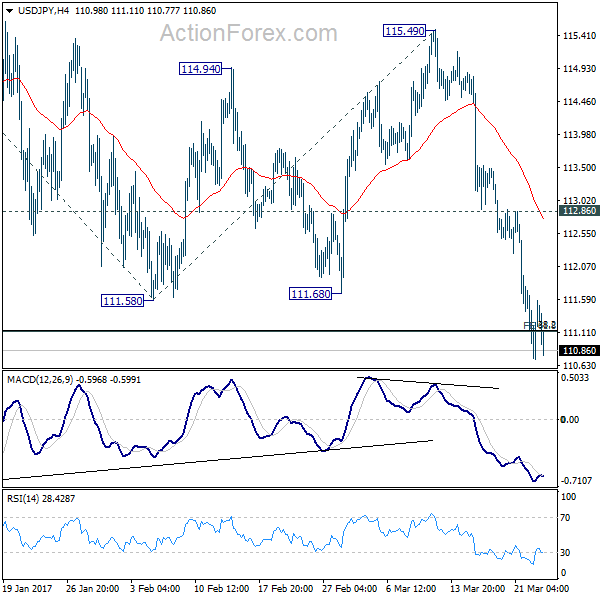
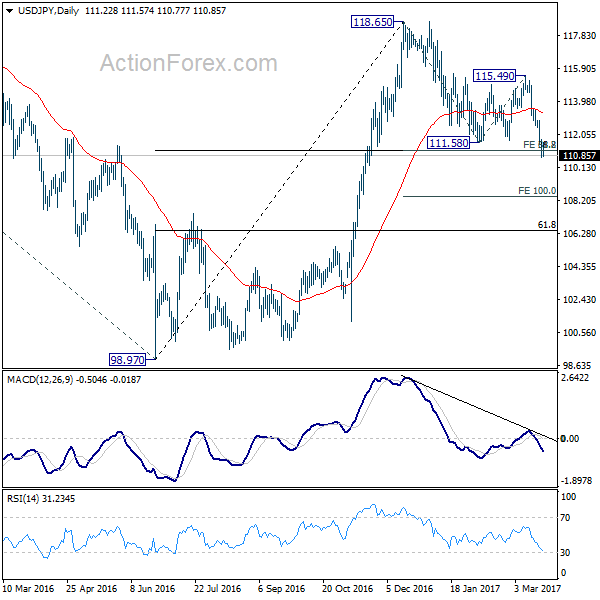
USD/JPY Mid-Day Outlook
Daily Pivots: (S1) 110.67; (P) 111.22; (R1) 111.72; More...
USD/JPY's decline from 115.49 is still in progress for the moment. Sustained trading below 111.12/13 cluster support (61.8% projection of 118.65 to 111.58 from 115.49 at 111.12 and 38.2% retracement of 98.97 to 118.65 at 111.13) will pave the way to 100% projection at 108.42. Nonetheless, rebound from there current level, and break of 112.86 resistance will indicates completion of the correction from 118.65. In such case, intraday bias will be turned back to the upside for 115.49 resistance and above.
In the bigger picture, price actions from 125.85 high are seen as a corrective pattern. The impulsive structure of the rise from 98.97 suggests that the correction is completed and larger up trend is resuming. Decisive break of 125.85 will confirm and target 61.8% projection of 75.56 to 125.85 from 98.97 at 130.04 and then 135.20 long term resistance. Nonetheless, sustained trading below 55 week EMA (now at 111.12) will extend the consolidation from 125.85 with another fall through 98.97 before completion.
Yen Stays Firm as Markets Awaits House Vote on Trump’s Health Care Plan
The Japanese yen extends this week's broad based rally even though markets stabilized elsewhere. US President Donald Trump will be facing his first legislative test today. House will vote on Trump's American Health Care Act for replacing so called Obamacare. As Chair of the House Freedom Caucus, Mark Meadows, suggested, there are still insufficient votes to pass the bill but the chance appears to have improved. Meanwhile, there are also reports that there could be more than 25 Republicans opposing the bill. And only 23 is needed to join the Democrats to reject the AHCA. A defeat in House today will further raise the doubts on Trump's ability to push through his economic policies. And the reverse Trump trade that we see in the selloff in US stocks this week could accelerates. Released from US, Initial jobless claims rose 15k to 258k in the week ended March 18, above expectation of 240k. Continuing claims dropped -39k to 2m in the week ended March 11.
ECB: Survey results suggest robust recovery
ECB said in its monthly economic bulletin that recovery in the region is gaining ground with robust momentum. The central bank noted that "incoming data, notably survey results, have increased the Governing Council's confidence that the ongoing economic expansion will continue to firm and broaden." Besides, "surveys point to a robust growth momentum in the first quarter of 2017." Nonetheless, regarding inflation, ECB said that wage growth remained sluggish by historical standard. And, "on contrast to energy inflation, the expected pick-up in (headline) inflation excluding energy and food is likely to be much more gradual." Also, "there are only weak signs of upward pipeline price pressures."
SNB spent CHF 67.1b in intervention
SNB noted in its annual report published today that CHF 67.1b was spent in currency intervention last year. That's notably lower than 2015's total at CHF 86.1b when the EUR/CHF floor was removed. Also it's around one-third of the record of CHF 118b spent back in 2012. The central bank also noted that "these interventions occurred mainly at times of heightened uncertainty, when the Swiss franc was particularly sought after as a safe investment."
Released in Europe, German Gfk consumer sentiment dropped 0.2 pts to 9.8 in April. UK retail sales rose 1.4% mom in February. UK CBI reported sales was unchanged at 9 in March.
RBNZ Maintained Neutral Bias, Likely On Hold Throughout 2017
As widely anticipated, RBNZ left the OCR unchanged at 1.75% and maintained the neutral bias in the monetary policy stance. Domestic economic developments remained upbeat with rising inflation and positive growth outlook. Policymakers attributed weaker-than-expected 4Q17 GDP to temporary factors. The central bank acknowledged the recent depreciation in trade-weighted exchange rate. Yet, it reiterated that a weaker kiwi would be needed for more balanced growth. RBNZ warned that geopolitical uncertainty remained the biggest challenge in the global economic development. We expect RBNZ would stand on the sideline throughout the year. More in RBNZ Maintained Neutral Bias, Likely On Hold Throughout 2017
China Money Market Conditions Remain Fragile
China's financial system continues to display fragility and liquidity squeeze. China's 7-day repo rate jumped to 5.5% (close), the highest level since late 2014, on Tuesday, followed by PBOC's injection of RMB 80-90B to the market on Wednesday as some small banks failed to repay debts in the interbank market. Less than a week ago, PBOC raised a range of short-term and medium-term interest rates to reduce financial risks, thought to be a response to Fed funds rate hike. Interbank rates should remain volatile over the coming week, ahead of PBOC's quarterly macro-prudential assessment in late March. Although recent data suggested that the problem of capital outflow eased in February, ongoing interest rate normalization in the US would prolong China's capital outflow problem, sustaining the challenges facing China in the implementation of its monetary policy. More in China Money Market Conditions Remain Fragile.
USD/JPY Mid-Day Outlook
Daily Pivots: (S1) 110.67; (P) 111.22; (R1) 111.72; More...
USD/JPY's decline from 115.49 is still in progress for the moment. Sustained trading below 111.12/13 cluster support (61.8% projection of 118.65 to 111.58 from 115.49 at 111.12 and 38.2% retracement of 98.97 to 118.65 at 111.13) will pave the way to 100% projection at 108.42. Nonetheless, rebound from there current level, and break of 112.86 resistance will indicates completion of the correction from 118.65. In such case, intraday bias will be turned back to the upside for 115.49 resistance and above.
In the bigger picture, price actions from 125.85 high are seen as a corrective pattern. The impulsive structure of the rise from 98.97 suggests that the correction is completed and larger up trend is resuming. Decisive break of 125.85 will confirm and target 61.8% projection of 75.56 to 125.85 from 98.97 at 130.04 and then 135.20 long term resistance. Nonetheless, sustained trading below 55 week EMA (now at 111.12) will extend the consolidation from 125.85 with another fall through 98.97 before completion.
Economic Indicators Update
| GMT | Ccy | Events | Actual | Forecast | Previous | Revised |
|---|---|---|---|---|---|---|
| 20:00 | NZD | RBNZ Rate Decision | 1.75% | 1.75% | 1.75% | |
| 07:00 | EUR | German GfK Consumer Confidence Apr | 9.8 | 10 | 10 | |
| 09:00 | EUR | ECB Economic Bulletin | ||||
| 09:30 | GBP | Retail Sales M/M Feb | 1.40% | 0.40% | -0.30% | -0.50% |
| 11:00 | GBP | CBI Retailing Reported Sales Mar | 9 | 4 | 9 | |
| 12:30 | USD | Initial Jobless Claims (MAR 18) | 258K | 240k | 241k | 243K |
| 14:00 | USD | New Home Sales Feb | 566k | 555k | ||
| 14:30 | USD | Natural Gas Storage | -53B | |||
| 15:00 | EUR | Eurozone Consumer Confidence Mar A | -5.8 | -6.2 |
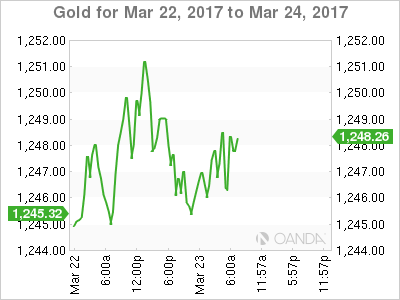
Spot Gold Consolidating Under Fresh Three-Week High
Spot Gold remains steady on Thursday and is consolidating under fresh three-week high at $1251, posted on Wednesday.
The yellow metal maintains strong bullish sentiment on recent risk-off mode and increased demand for safe-haven assets, being in steep ascend for six consecutive days.
Today's events, vote for US healthcare plan and speech of Fed Chair Yellen, could generate stronger signals.
Technical studies remain in strong bullish setup, however, overbought slow stochastic on daily chart and bearish divergence of 4-hr chart slow stochastic, may signal that strong rally from $1195 trough is running out of steam.
Top of thickening hourly chart that underpins near-term action, currently lies at $1243 (also Wednesday's low) and needs to hold dips to keep bulls in play for renewed attempt higher.
Sustained break above $1251 barrier is needed to open targets at $1260/63 (200SMA / 27 Feb high).
Otherwise, penetration into hourly cloud would risk weakness towards next pivot at $1237 (hourly cloud base / broken Fibo 61.8% of $1263/$1195 downleg).
Res: 1251; 1258; 1260; 1263
Sup: 1243; 1237; 1229; 1226

Congress Vote on Healthcare and Yellen Speech Eyed
- GBP higher but is the retail sales data as good as the February number suggests?
- Trump's healthcare vote could be key to markets in coming days;
- Will Yellen continue with dovish post-hike message?
US equity markets are on course to open a little higher on Thursday, with traders paying close attention to Congress and the upcoming vote on Donald Trump's healthcare bill, while in the UK the pound has been lifted by the latest retail sales data, perhaps wrongly.
The pound is trading slightly higher on the day after retail sales data for the UK rose more than expected in February, although it wasn't all good news with the January data being revised lower. The ONS reported that the underlying pattern is less positive again with the three month on three month movement falling by 1.4% for the second month in a row, the largest drop in seven years.
It would appear that while February was a good month for the consumer, the trend is both disappointing and concerning. The substantial depreciation of the pound since the June referendum combined with rising oil prices is eating away at people's disposable income and the cracks are starting to appear. With the consumer being so important to the UK economy, the first quarter GDP figures could offer real insight into what kind of a year it's going to be for the country, with the impact of the currency moves only just starting to be felt.
Attention will now shift to the US as Trump works hard to push his healthcare plans through Congress with a vote expected in the next couple of days. Trump's difficulty in getting people on board with his plans was largely blamed for the market selling off earlier in the week, with investors apparently seeing this as a sign that Trump may also struggle to get his spending plans and tax changes through. Should the healthcare plan be approved by Congress then we could see a resumption of the Trump rally while a failure could leave markets vulnerable to a larger correction.
Traders will also be focused on what Federal Reserve policy makers have to say today, particularly Chair Janet Yellen, who is due to appear prior to the US open. Policy makers have erred on the dovish side since they raised interest rates last week which has weighed on the dollar and seen the odds of further rate hikes this year pared back. The market implied odds of a rate hike is June has now fallen below 50% while two rate hikes this year is a coin toss. We may have to get used to this kind of behaviour from the Fed this year with sudden coordinated hawkish turns ahead of rate hike meetings followed by more cautious dovish messages after in order to manage market expectations.
Trump Trade Needs Healthcare
Thursday March 23: Five things the markets are talking about
This week's global equities selloff has eased in the overnight session as the market steps back before today's key U.S vote on Trump's healthcare bill.
Market sentiment is being dictated to by this piece of legislation - the House votes this evening. The fact that the President is struggling to push his bill has raised raised doubts over whether he can win support for his pro-growth economic policy measures.
Press reports late Wednesday suggests that the White House is considering concessions to the right wing of the party to help the bill through the house.
This is the markets litmus test - if the healthcare bill does actually stall, the Trump 'reflation' trade will again come under threat - stocks, yields and dollar lower.
Note: The timing of this evening's vote has not been set.
1. Global stocks see mixed results
This week's equity selloff was the biggest for stocks since the November U.S election. To date, they have largely escaped the markets efforts this year to unwind the "Trump trade."
Note: While the dollar has fallen -4.4% ytd, global stocks have climbed to new record highs.
In Japan, the Nikkei edged a tad higher overnight (+0.2%), up from its two-month low, as support from a weaker yen (yesterday's ¥110.75 print was a four -month low) helped offset a political scandal centered on PM Abe's wife. The broader Topix was little changed.
In Hong Kong, benchmark stock index struggled as strength in Chinese real estate developers was offset by weakness in some blue chips - earnings reports disappointed. The Hang Seng ended flat. The index is up +10% ytd and market is questioning valuations.
In China, stocks rebounded, but gains are being capped with more mainland money flowing into Hong Kong through trading links. The CSI300 blue-chip index rose +0.4%, while the Shanghai Composite Index gained +0.3%.
In Europe, equity indices are trading mixed, as market participants remain nervous after the recent terror attack in London yesterday. Banking stocks are leaning on the Eurostoxx, while energy, commodity and mining stocks trade in the FTSE 100.
U.S stocks are set to open in the black (+0.2%).
Indices: Stoxx50 -0.1% at 3,420, FTSE flat at 7,322, DAX +0.2% at 11,925, CAC-40 -0.1% at 4,989, IBEX-35 +0.1% at 10,235, FTSE MIB +0.2% at 19,999, SMI +0.2% at 8,581, S&P 500 Futures +0.2%
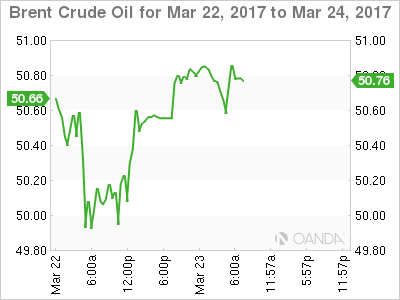
2. Oil bounces off lows, but bloated U.S stocks pressure market
Oil prices have recovered a tad, but the market remains under pressure as bloated U.S crude inventories and rising output continues to dampen OPEC-led efforts to curb global production.
Brent crude futures at +$50.82 per barrel is up +18c, or +0.4% from Wednesday's close. Brent briefly dipped below the psychological +$50 intraday yesterday for the first time since November.
West Texas Intermediate (WTI) crude futures are up +19c, or +0.4% at +$48.23 a barrel, after testing support at +$47 overnight.
Note: The EIA said U.S inventories climbed almost +5m barrels to a record +533.1m last week, far outpacing estimates of a +2.8m barrel build. U.S production has risen over +8% since mid-2016.
There are signs that the Asian market is also bloated - China's gas imports are slumping and its own domestic refiners are exporting huge volumes overseas.
Gold prices slipped overnight, trading below its three-week high print yesterday, as the dollar recovers from its two-month low and markets wait to see if President Trump can push through his healthcare bill. The yellow metal is down -0.1% at +$1,247.30 per ounce - Wednesday, it touched its strongest since Feb. at +$1,251.26.
3. Global yields dependent on Trump stimulus expectations
With market risk sentiment being somewhat fragile given the uncertainty on whether Trump can deliver on stimulus expectations has been supporting U.S treasuries and bunds prices in particular
In the U.S, 10-year yields rose above +2.6% earlier this month and reached a two-year high as investors anticipated the Fed would raise short-term interest rates. They did last week, but its signal of a "gradual" path of tightening policy has debt product better bid. U.S 10's are trading at +2.41%. German bunds are trading just above +0.4%.
In the U.K, yields on 10-year gilts have backed up +1 bps to +1.19% after domestic data showed that U.K retail sales rose beating expectations (see below).
Elsewhere, the Reserve Bank of New Zealand (RBNZ) held rates steady overnight (+1.75%) as expected and maintains a neutral policy stance. In its policy statement, officials expressed more concern over housing inflation while reiterating that the exchange rate should depreciate more to achieve balanced growth.
4. Dollar waits for U.S House vote
Some of yesterday's risk aversion sentiment has eased overnight as the market awaits the U.S House vote on the repeal of Obamacare. A rejection of the bill could be interpreted that President Trump will have massive problems for his plans for tax cuts and spending increase and further undermine the Trump trade.
USD/JPY (¥111.00) has climbed away from its four-month low (¥110.75), but any further upside is facing resistance. Whispers of USD sell-stops below yesterday's lows may provide further momentum to test below the psychological ¥110.00 handle.
The Pound (£1.2520) has firmed on a better headline U.K retail sale for Feb. Sterling's focus will now be on Brexit divorce proceedings, which PM May, is expected to trigger on March 29.
5. U.K Retail Sales rebound in Feb
Data released this morning showed that U.K retail sales rebounded strongly in February (+1.4% vs. +0.4% e) following three consecutive months of decline, but the underlying trend remained weak, suggesting the industry was unlikely to make a positive contribution to growth in the Q1.
There were strong sales across all categories, with household goods stores out performing. However, sales in the three-months through Feb. fell by -1.4%, the fastest pace of decline in seven-years.
The pound's depreciation (£1.2520) since the Brexit vote is supporting price growth and with U.K wage growth struggles to keep up with inflation, the U.K consumer is expected to curb spending.
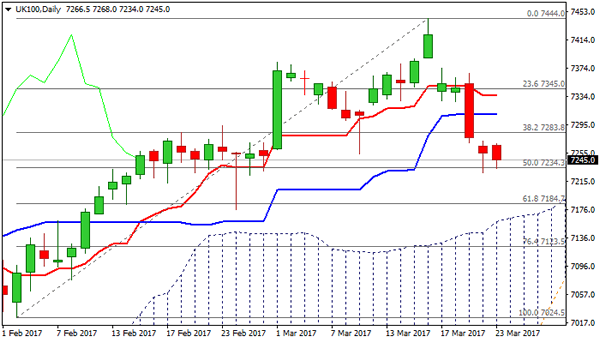
FTSE 100 – Risk Of Break Below 55SMA Footstep And Deeper Correction Remain In Play
FTSE came under pressure again after pound rallied on Thursday and slipped from double upside rejection at 7270, where recovery attempts on Wednesday / today faced strong resistance.
Daily studies weakening and gaining bearish momentum, together with growing negative sentiment, keeps the downside in focus. Temporary footstep at 7225 (daily SMA) is under pressure and sustain break here would trigger further bearish acceleration towards next set of key supports at 7184/63 (Fibo 61.8% of 7024/7444 rally / top of rising daily cloud).
Alternative scenario requires break above 7270 as minimum to ease current bearish pressure, while acceleration through daily Kijun-sen / Tenkan-sen barriers at 7309/36 respectively is needed to neutralize and shift focus higher.
Res: 7270, 7309, 7336, 7367
Sup: 7225, 7184, 7158, 7123