Sample Category Title
SNB Publishes Annual Report, RBNZ Stands Pat
News and Events:
RBNZ is willing to tolerate higher inflation for a weaker Kiwi
As widely expected, the Reserve Bank of New Zealand kept its Official Cash Rate target unchanged at a record low of 1.75. Also, Graeme Wheeler did not change his view on the overvaluation of the Kiwi, instead repeating the need for a weaker Kiwi 'to achieve more balanced growth'. He also allayed fears concerning rising inflationary pressure, arguing that the spike was temporary, stemming from a temporary rise in commodity prices.
Overall, the tone of the statement suggests that the RBNZ is ready to tolerate higher inflation in order to allow for a weaker Kiwi. This may be a good decision especially as core inflation has picked up at a slower pace than headline inflation. However, we are having a hard time believing that the market will collaborate. Indeed, the Kiwi has been one of the worst performing currencies among the commodity complex (+1.8% against the USD), especially against the Australian dollar (+6% versus the USD). We think that the Kiwi has room for further appreciation, especially against the Aussie. AUD/NZK has already fallen 1.6% since mid-March and is now heading towards the next key support area at between 1.08-07(psychological level and Fibo 38.2% on December-March rally).
SNB releases its annual report
In the latest annual report from the SNB, we have learned that the Swiss central bank bought around CHF67 billion in foreign currencies in order to defend the franc. Comparatively, this is lower than in 2015 when the floor was removed.
The SNB still sees the franc as 'significantly overvalued' and so the negative interest rate policy is more relevant than ever. However, for now, the central bank is sticking to its wait-and-see approach.
Europe's political uncertainties are weighing heavily on the EURCHF and we believe that bearish pressure shows no signs of easing. In terms of Swiss data, inflation has never been so high at 0.6% y/y and the unemployment rate remains moderate at 3.6%. Exports are a little more concerning with two consecutive declines in January and February (respectively -4% and -2.2%). In the short and medium-term, the Swiss Franc should remain below 1.0800 and the SNB is likely to intervene to avoid extreme strengthening. Finally, despite massive QEs, we believe that the ECB is likely to soon enter a tightening cycle – to reduce monetary policy divergence with the US - which in turn will definitely benefit the Swiss economy.
Obamacare repeal bill: Defeat or Delay?
Judging from the thin, directionless flows in Asia, investors will have to wait for the outcome of today’s vote on the Obamacare repeal bill for the market's next move. So far, the market has hyped this event as being a test of US President Trump's policy agenda, suggesting that a defeated healthcare bill would translate into barriers for the much-awaited tax reform policy and broader pro-growth agenda. As suggested in yesterday's report, we concur that short-term volatility will be driven by the result of this afternoon’s vote. With the Republican opposition needing less than 22 members to vote against the measure (reports suggest that 24 members are prepared to obstruct), we believe that the bill will be rejected (if the bill reaches the floor and is not delayed).
Interestingly, Republican conservatives are already shifting the blame away from President Trump to Speaker of the House, Paul Ryan. However, regardless of the outcome, Fed monetary policy will provide investors with a clear directional view. The weaker dollar has created looser conditions, while political uncertainty has forced investors to fade expectations due to the steeper Fed policy path (June hike is now 50/50). Amid falls in real yields and signs that the Fed will be willing to tolerate higher inflation to ensure growth is stable, risky asset should continue to outperform. Today, Fed Chair Yellen will provide additional insight into monetary policy strategy. We expect that she will reaffirm the central bank’s slow and steady approach to tightening, decelerating the economy without spooking financial conditions. Given this outlook, we maintain our stance that further risk accumulations will favour EM currencies (ZAR, ILS, PLN and INR long continue to build).
Today's Key Issues (time in GMT):
- Mar Consumer Confidence Indicator, exp 5, last 4,8 DKK / 08:00
- ECB's Nouy speaks in Brussels EUR / 08:00
- ECB Publishes Economic Bulletin EUR / 09:00
- BOE Deputy Governor Ben Broadbent Speaks in London GBP / 09:00
- Feb Retail Sales Ex Auto Fuel MoM, exp 0,30%, last -0,20%, rev -0,30% GBP / 09:30
- Feb Retail Sales Ex Auto Fuel YoY, exp 3,20%, last 2,60%, rev 2,10% GBP / 09:30
- Feb Retail Sales Inc Auto Fuel MoM, exp 0,40%, last -0,30%, rev -0,50% GBP / 09:30
- Feb Retail Sales Inc Auto Fuel YoY, exp 2,60%, last 1,50%, rev 1,00% GBP / 09:30
- mars.23 ECB Targeted LTRO Total Amount, exp EU110.00b, last EU62.16b EUR / 10:20
- mars.22 FGV CPI IPC-S, exp 0,38%, last 0,35% BRL / 11:00
- Mar CBI Retailing Reported Sales, exp 4, last 9 GBP / 11:00
- Mar CBI Total Dist. Reported Sales, exp 20, last 25 GBP / 11:00
- mars.17 Foreigners Net Bond Invest, last $354m TRY / 11:30
- mars.17 Foreigners Net Stock Invest, last -$94m TRY / 11:30
- Revisions: Initial Jobless Claims USD / 12:30
- mars.18 Initial Jobless Claims, exp 240k, last 241k USD / 12:30
- mars.11 Continuing Claims, exp 2040k, last 2030k USD / 12:30
- Fed's Yellen Speaks at Community Development Conference USD / 12:45
- mars.17 Gold and Forex Reserve, last 391.4b RUB / 13:00
- mars.19 Bloomberg Consumer Comfort, last 51 USD / 13:45
- Feb New Home Sales, exp 564k, last 555k USD / 14:00
- Feb New Home Sales MoM, exp 1,60%, last 3,70% USD / 14:00
- ECB's Lautenschlaeger Speaks at Vienna Conference EUR / 14:45
- Mar Kansas City Fed Manf. Activity, exp 14, last 14 USD / 15:00
- Mar A Consumer Confidence, exp -5,9, last -6,2 EUR / 15:00
- Fed's Kashkari Speaks on U.S. Education Outcomes in D.C. USD / 17:00
- SNB's Maechler Speaks in Zurich CHF / 17:00
- Mar Consumer Confidence, last 94,4 KRW / 21:00
- Feb Trade Balance NZD, exp 180m, last -285m NZD / 21:45
- Feb Exports NZD, exp 4.20b, last 3.91b NZD / 21:45
- Feb Imports NZD, exp 3.99b, last 4.19b NZD / 21:45
- Feb Trade Balance 12 Mth YTD NZD, exp -3655m, last -3468m NZD / 21:45
- 4Q BoP Current Account Balance, exp -$12.00b, last -$3.40b INR / 22:00
The Risk Today:
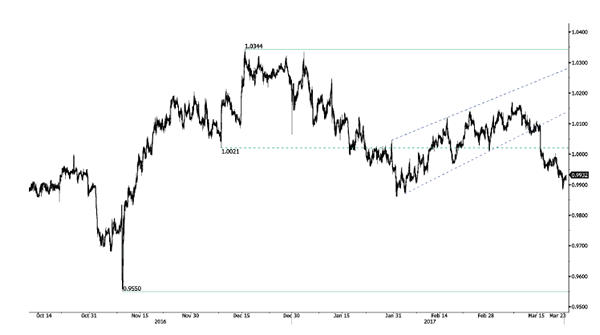
EUR/USD keeps on pushing higher, even though the pair is now pausing around 1.0800. A break of the upside channel would signal persistent buying pressures. Key resistance is given at a distance 1.0874 (08/12/2017 high). Strong support can be found at 1.0493 (22/02/2017 low). The technical structure suggests deeper increase towards resistance at 1.0874. In the longer term, the death cross late October indicated a further bearish bias. The pair has broken key support given at 1.0458 (16/03/2015 low). Key resistance holds at 1.1714 (24/08/2015 high). Expected to head towards parity.
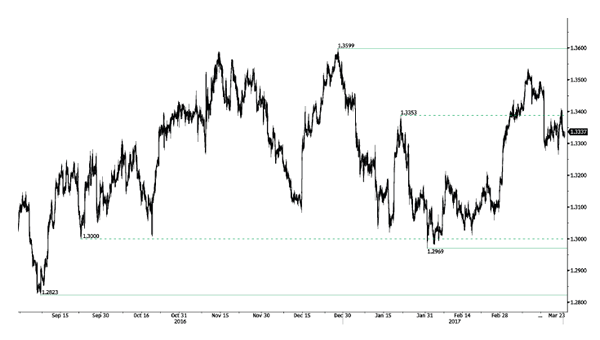
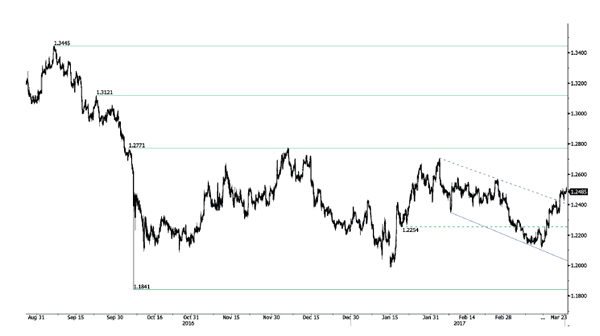
GBP/USD has broken bearish downtrend channel. The pair has broken resistance at 1.2429 and there are rooms for further strength. Hourly resistance is located at 1.2570 (24/02/2017 high). Hourly support is given at 1.2324 (03/17/2017 low). The long-term technical pattern is even more negative since the Brexit vote has paved the way for further decline. Long-term support given at 1.0520 (01/03/85) represents a decent target. Long-term resistance is given at 1.5018 (24/06/2015) and would indicate a long-term reversal in the negative trend. Yet, it is very unlikely at the moment.
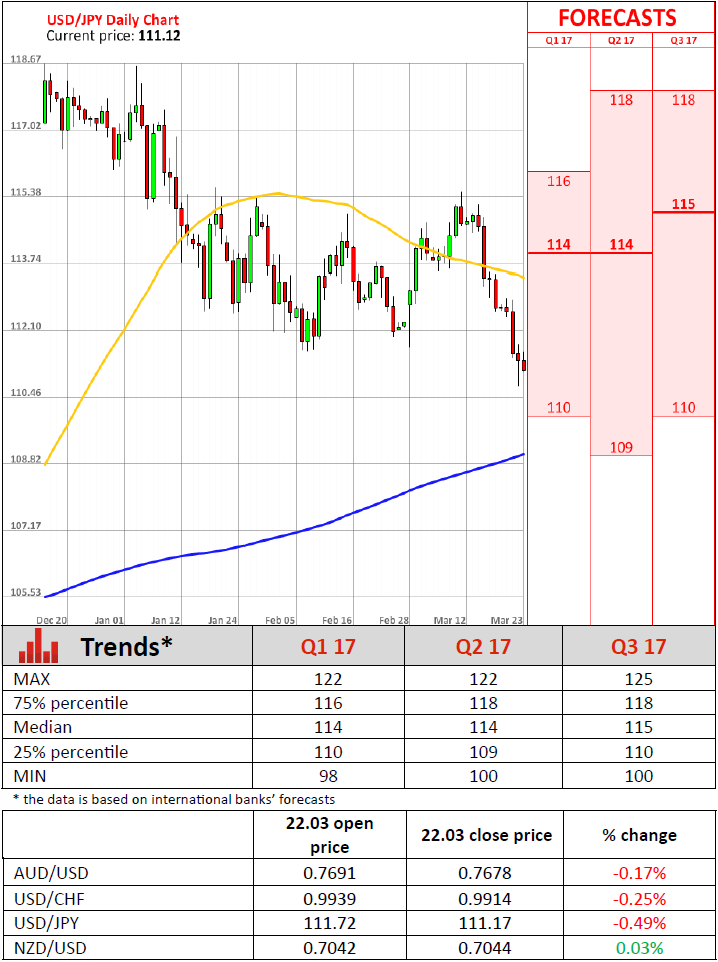
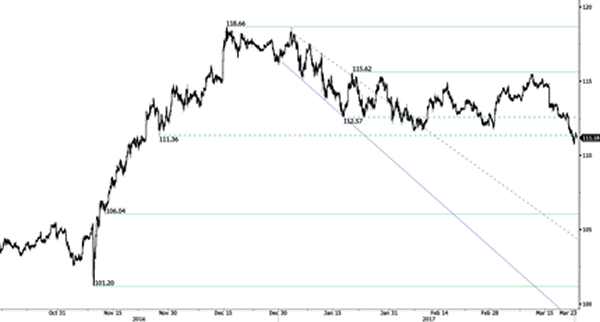
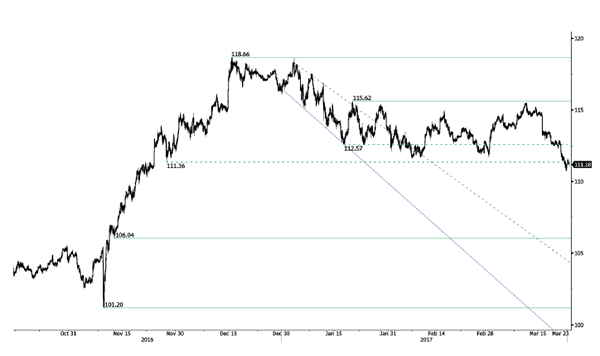
USD/JPY has failed to break key resistance given at 115.62 (19/01/2016 high) confirming persistent selling pressures. The pair has broken strong support at 111.36 (28/11/2016 low). Hourly resistance can be located at 113.57 (16/03/2017 high). We favor a long-term bearish bias. Support is now given at 96.57 (10/08/2013 low). A gradual rise towards the major resistance at 135.15 (01/02/2002 high) seems absolutely unlikely. Expected to decline further support at 93.79 (13/06/2013 low).
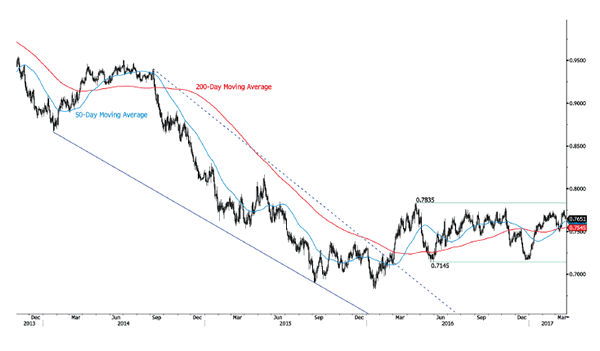
USD/CHF is declining. Hourly support is given at 0.9862 (31/01/2017 low). Key resistance can be found at a distance at 1.0344 (15/12/2016 high). Expected to show continued weakness. In the long-term, the pair is still trading in range since 2011 despite some turmoil when the SNB unpegged the CHF. Key support can be found 0.8986 (30/01/2015 low). The technical structure favours nonetheless a long term bullish bias since the unpeg in January 2015.
| EURUSD | GBPUSD | USDCHF | USDJPY |
| 1.1300 | 1.3445 | 1.0652 | 121.69 |
| 1.0954 | 1.3121 | 1.0344 | 118.66 |
| 1.0874 | 1.2771 | 1.0171 | 115.62 |
| 1.0774 | 1.2505 | 0.9937 | 110.97 |
| 1.0454 | 1.1986 | 0.9862 | 106.57 |
| 1.0341 | 1.1841 | 0.9550 | 106.04 |
| 1.0000 | 1.0520 | 0.9444 | 101.20 |
European Market Update: UK Retail Sales Handily Exceeds Estimates, Focus On Upcoming US House On Obamacare Repeal
UK retail sales handily exceeds estimates; focus on upcoming US House on on Obamacare repeal
Notes/Observations
Markets await for the outcome of the vote on repeal of Obamacare (expected late Thursday); Republican leaders need time to gather votes
UK Feb Retail sales handily beat expectations while back month revised slightly lower
Overnight:
Asia:
New Zealand Central Bank (RBNZ) leaves Benchmark Rate unchanged at record low; signaled no rush to tighten highlighting external uncertainties
US preparing cases linking North Korea to cyber theft at the NY Fed (regarding $81M in thefts)
Europe:-
Metropolitan Polices Dep Commissioner: London attack "inspired by international Islamist terrorism" results in 5 deaths and 40 injured; PM May vowed that Parliament will open as usual on Thursday
German Feb Finance Ministry monthly report: Incoming data suggesting continuation of economic upturn
Americas:
Trump administration reportedly considering making last minute changes to House healthcare bill to appease Freedom Caucus (reducing some of the "essential benefit" requirements of Obamacare)
Economic Data
(DE) Germany Apr GfK Consumer Confidence (miss): 9.8 v 10.0e
(TR) Turkey Mar Consumer Confidence: 67.8 v 65.6e
(FR) France Mar Business Confidence: 104 v 104e; Manufacturing Confidence: 104 v 107e
(DK) Denmark Mar Consumer Confidence Index: 6.2 v 5.0e
(TW) Taiwan Feb Industrial Production Y/Y: 10.6% v 10.0%e
(PH) Philippines Central Bank (BSP) left its Overnight Borrowing Rate unchanged at 3.00% (as expected)
(TW) Taiwan Central Bank (CBC) left ist Benchmark Interest Rate unchanged at 1.375% (as expected)
(UK) Feb Retail Sales (Ex-Auto Fuel) M/M: 1.3% v 0.3%e; Y/Y: 4.1% v 3.2%e
(UK) Feb Retail Sales (Including Auto/Fuel) M/M: 1.4% v 0.4%e; Y/Y: 3.7% v 2.6%e
Fixed Income Issuance:
None seen
SPEAKERS/FIXED INCOME/FX/COMMODITIES/ERRATUM
Index snapshot (as of 09:30 GMT)
Indices [Stoxx50 -0.1% at 3,420, FTSE flat at 7,322, DAX +0.2% at 11,925, CAC-40 -0.1% at 4,989, IBEX-35 +0.1% at 10,235, FTSE MIB +0.2% at 19,999, SMI +0.2% at 8,581, S&P 500 Futures +0.2%]
Market Focal Points/Key Themes: European equity indices are trading mixed across the board as market participants remain jittery after the recent terror attack in London yesterday; Banking stocks mixed but generally lower across the board at the time of writing; shares of Next the notable gainer in the FTSE 100 after releasing its FY16 results, with consumer discretionary stocks Marks & Spencer, Dixons Carphone, and Tesco also notably higher in the index; Energy, commodity and mining stocks mixed as copper and oil prices trade flat intraday.
Upcoming scheduled US earnings (pre-market) include Accenture, ConAgra Foods, Commercial Metals, Hanwha Q Cells, and Scholastic Corp.
Equities (as of 09:25 GMT)
Consumer Discretionary: [Hornbach Holding HBH3.DE -0.5% (prelim FY16/17 results), Intelligent Energy IEH.UK +126% (deal signed to deliver fuel cell systems), Next PLC NXT.UK +8.1% (FY16 results), Ted Baker TED.UK -5.1% (FY16 results)]
Financials: [Baloise Holding BALN.CH +0.4% (FY16 results, div increase), Crest Nicholson CRST.UK -0.5% (AGM statement), Wendel MF.FR +4.0% (FY16 results), Vienna Insurance VIGR.AT +2.8% (FY16 results, raises div)]
Healthcare: [Ion Beam IBAB.BE +2.7% (FY16 results), UCB UCB.BE +0.9% (USPTO confirms the validity of U.S. patent 38,551)]
Industrials: [Kier Group KIE.UK +0.7% (H1 results, names Chairman designate, launches JV with Cross Key Homes), Leoni LEO.DE +5.3% (FY17 outlook), WYG WYG.UK -18.8% (trading update, cuts outlook)]
Materials: [Metall Zug METN.CH -0.5% (FY16 results, div increase)]
Technology: [United Internet UTDI.DE +0.3% (FY16 results, div increase)]
Speakers
ECB Publishes Economic Bulletin reiterated its March monetary policy stance that a very substantial degree of monetary accommodation was still needed to support headline inflation in the medium term. Governing Council to continue to look through changes in HICP inflation if judged to be transient. Conditions necessary to secure a sustained convergence of inflation rates towards levels below, but close to, 2%.
ECB Single Supervisory Mechanism Annual Report with ECB's Draghi noting that low bank profitability weakened the support to the recovery
ECB's Nouy (SSM Chief) noted that it would be most welcome' if global regulatory reform was finalized as planned. Finance transcends national borders and so must the rule that govern it
ECB raised its emergency liquidity assistance (ELA) cap for Greece banks from €46.2B to €46.6B (1st hike since Jun 2015)
Spain Fin Min de Guindos reiterated govt view that 2017 GDP growth target of 2.5% and would update its forecast for unemployment
German Finance Ministry comments on Q2 issuance: To sell €44B in bills and bonds in quarter
Scotland Referendum vote said to be delayed to Tuesday, Mar 28th (Note: Debate was suspended on Wed, Mar 22nd due to the terror-related incidence near London's Westminster)
Philippines Central Bank Policy Statement reiterated that its current policy settings remained appropriate and that inflation to remain within the target range for both 2017 and 2018. It noted that ; the latest CPI forecast were slightly lower than prior view with risks tilted to the upside
Taiwan Central Bank Policy Statement noted that inflation was mild and the output gap remained negative, TWD currency (NT$ dollar) gains helping to ease imported inflation. Fiscal expansion was needed for economy
Japan Cabinet Office (Govt) Monthly Report maintained its overall assessment that domestic economy was continuing a moderate recovery although with a delay in some areas. Raised its views on retail consumption and corporate earnings
Malaysia Central Bank saw 2017 GDP growth seen between 4.3-4.8% range. Monetary policy to focus on supporting sustainable growth for economy and maintaining price stability and to introduce new measures to help small businesses to hedge their exposure against MYR currency (Ringgit) volatility
Currencies
Some of the risk aversion sentiment from Wednesday dissipated but market awaits the US House vote on the repeal of Obamacare.A r ejection of the bill could deliver potential setbacks to President Trump plans for tax cuts and spending increase thus undermining the rally in risk assets.
The USD/JPY pair climbed back above the key 111 support area but upside did face some headwinds for now. USD sell-stops said to be placed below the 110.70 area and could open the door for more retracement of the post Trump election rally with 105 seen as the next key level on any sustained one-way price move.
The GBP/USD firmed in the aftermath of better headline UK retails data for Feb. GBP/USD rose over 40 pips to test 1.2525 while EUR/GBP cross probed the 0.8600 area. UK 10-Gilt yield was higher and briwfly tested above 1.19%
Fixed Income:
Bund futures trade at 160.33 up 13 ticks with peripheral bonds outperforming, as futures consolidate above 160.00. Resistance remains near session highs at 160.45 followed by 160.66. Support moves to 159.96 followed by 159.41 then contract low of 158.73.
Gilt futures trade at 126.78 down 16 ticks trading lower on the back of stronger Feb retail sales figures out of the UK, fading some of the sharp move higher seen yesterday. Support moves to 126.34 followed by 126.07 then 125.80. Resistance moves to 127.35 followed by 127.89. Short Sterling futures trade down 1 to 2bp with Jun17Jun18 spread widening to 22/22.5Bp.
Thursday's liquidity report showed Wednesday's excess liquidity rose to €1.329B a rise of €7B from €1.322T prior. Use of the marginal lending facility rise to €232M from €117M prior.
Corporate issuance saw six issuers announce deals yesterday including Goldman Sachs, Ventas Realty, and Santander USA. Volume is expected be quiet for the rest of the week with weekly volume expected to be the lowest in the past 4 weeks, and towards the low end of this weeks $20-30B forecast.
Looking Ahead
(UR) Ukraine Feb Industrial Production M/M: No est v -17.5% prior; Y/Y: 2.5%e v 5.6% prior
(CO) Colombia Feb Industrial Confidence: No est v 1.9 prior; Retail Confidence: No est v 24.8 prior
(AR) Argentina Mar Consumer Confidence Index: No est v 40.7 prior
06:00 (EU) Daily Euribor Fixing - 06:00 (RO) Romania to sell Bills
06:30 (EU) ECB allotment in TLTRO-2 operation
06:30 (HU) Hungary Debt Agency (AKK) to sell 12-month Bills
06:30 (HU) Hungary Debt Agency (AKK) to sell Floating Rate bonds
06:30 (PL) Poland to sell 2019, 2022, 2026 and 2027 bonds (5 tranches)
07:00 (UK) Mar CBI Retailing Reported Sales: 4e v 9 prior, Total Distribution: 20e v 25 prior
07:00 (IL) Israel Feb Unemployment Rate: No est v 4.3% prior
07:45 (US) Daily Libor Fixing
08:00 (US) Fed Chair Yellen speaks at Community Development Conference
08:30 (US) Initial Jobless Claims: 240Ke v 241K prior; Continuing Claims: 2.04Me v 2.030M prior
08:30 (US) Weekly USDA Net Export Sales
09:00 (PL) Poland Central Bank (NBP) Mar Minutes
09:00 (RU) Russia Gold and Forex Reserve w/e Mar 17th: No est v $391.4B prior
09:15 (UK) Baltic Dry Bulk Index
10:00 (US) Feb New Home Sales: 565Ke v 555K prior
10:00 (BE) Belgium Mar Business Confidence: -0.5e v -1.1 prior
10:30 (US) Weekly EIA Natural Gas Inventories
11:00 (US) Mar Kansas City Fed Manufacturing Activity: 14e v 14 prior
11:00 (EU) Euro Zone Mar Advance Consumer Confidence: -5.9e v -6.2 prior
11:00 (BR) Brazil to sell 2023 LFT - 03/01/2023
11:00 (BR) Brazil to sell 2018, 2019 and 2020 LTN Bills
12:30 (US) Fed's Kashkari (dove, dissenter) on education in DC
13:00 (CH) SNB's Maechler speaks in Zurich
13:00 (US) Treasury to selll 10-Year TIPS Reopening
14:00 (US) Fed's Kashkari (Dove, dissenter) speaks at Community Development Event
19:00 (US) Fed's Kaplan (moderate, voter) speaks on economy in Chicago
19:00 (US) House of Representatives vote on Healthcare Bill (Thursday evening)
GOLD Ready To Push Higher, SILVER Increasing Demand, Crude Oil Heading Downwards.
GOLD Ready to push higher.
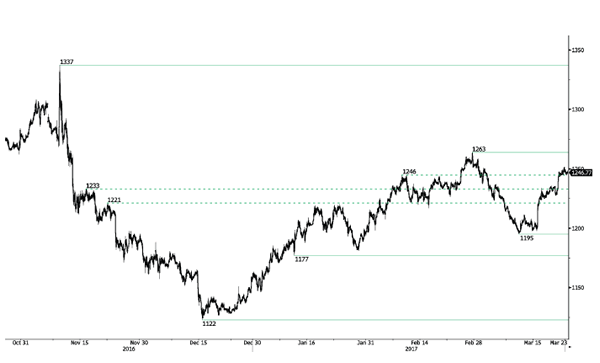
Gold has risen sharply, nearly invalidating the bearish short-term outlook. The momentum seems back to bullish. Key resistance is located at 1263 (27/02/2017 high). Hourly support can be found at 1224.10 (16/03/2017 low). Expected to show further strengthening.
In the long-term, the technical structure suggests that there is a growing upside momentum. A break of 1392 (17/03/2014) is necessary ton confirm it, A major support can be found at 1045 (05/02/2010 low).
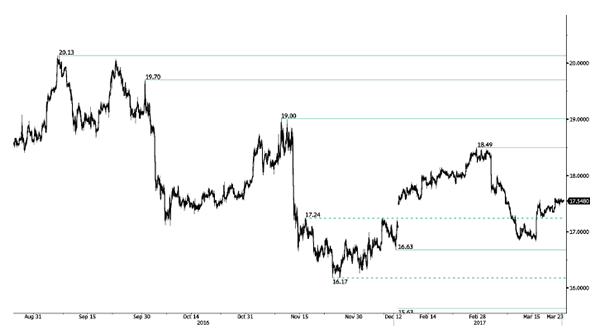
SILVER Increasing demand.
Silver rose sharply Friday, invalidating the bearish outlook linked to the previous bearish pause. Correct pullback has failed to find seller indicating test of 17.56 resistance (16/03/2017 high). Strong support is given at 16.84 (27/01/2016 low).
In the long-term, the death cross indicates that further downsides are very likely. Resistance is located at 25.11 (28/08/2013 high). Strong support can be found at 11.75 (20/04/2009).
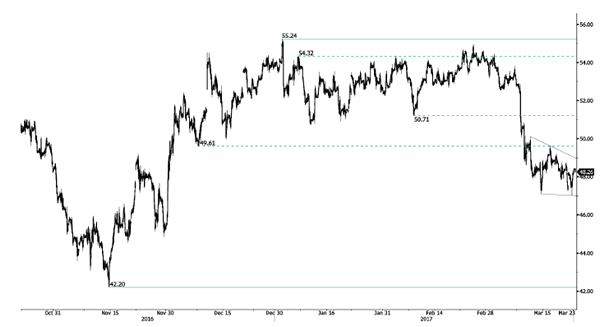
Crude Oil Heading downwards.
Crude oil's bearish pressures continues despite correct bounce due to a short-squeeze. The commodity had been unable to mount a serious challenge to resistance at 49.61 (08/12/2017 low) hourly support given at 47.09 (016/03/2017 low) Expected to see deeper selling pressures.
In the long-term, crude oil has recovered after its sharp decline last year. However, we consider that further weakness are very likely. Strong support lies at 24.82 (13/11/2002) while resistance can now be found at 55.24 (03/01/2017 high).
EUR/CHF Moving Sideways, EUR/JPY Strong Bearish Pressures, EUR/GBP Continued Weakness But…
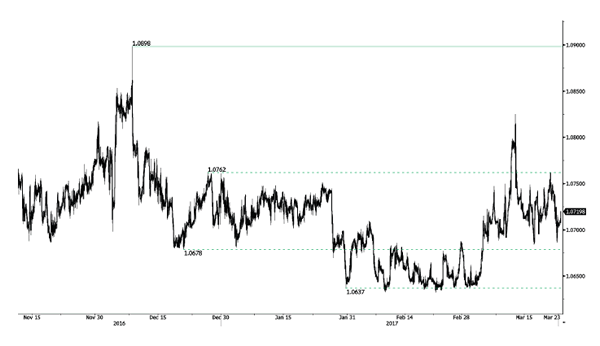
EUR/CHF Moving sideways.
EUR/CHF's is moving up and down. The medium-term pattern suggests us to see continued bearish pressures towards key support that can be found at 1.0623 (24/06/2016 low).
In the longer term, the technical structure is mixed. Resistance can be found at 1.1200 (04/02/2015 high). Yet,the ECB's QE programme is likely to cause persistent selling pressures on the euro, which should weigh on EUR/CHF. Supports can be found at 1.0184 (28/01/2015 low) and 1.0082 (27/01/2015 low).
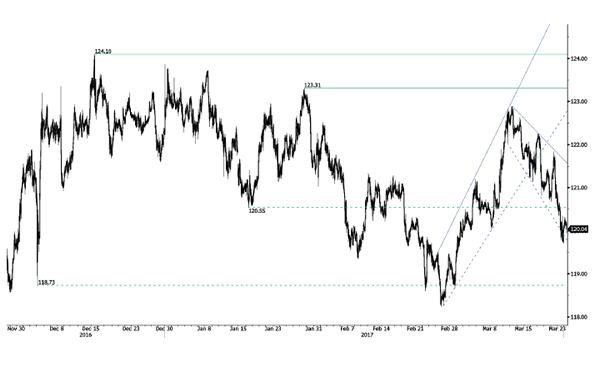
EUR/JPY Strong bearish pressures.
EUR/JPY rejection at 122.88 has triggered a correction. The pair is also very volatile. Hourly support at 120.55 (17/01/2017 low) has been broken. Another support at 120.02 (08/03/2017 low) has been broken. Resistance stands at 122.88 (13/03/0217 high). Expected to show continued weakness.
In the longer term, the technical structure validates a medium-term succession of lower highs and lower lows. As a result, the resistance at 149.78 (08/12/2014 high) has likely marked the end of the rise that started in July 2012. Strong support at 94.12 (24/07/2012 low) looks nonetheless far away.
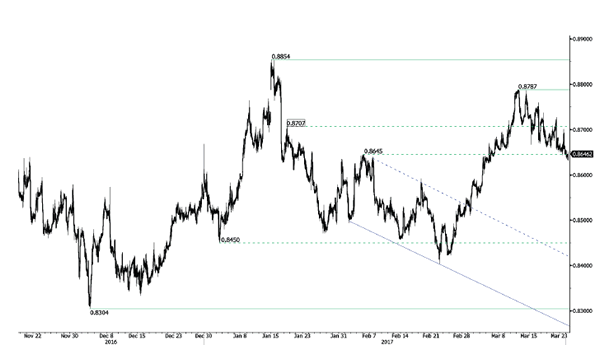
EUR/GBP Continued weakness but...
EUR/GBP is correcting lower. Yet there is the formation of a bullish flag which suggests reversal of current weakness targeting 0.9000. Key resistance is given at 0.8854 (15/01/2017 high) and other resistance can be found at 0.8787 (13/03/20167 high). Support is located at 0.8645( 05/02/2017 low).
In the long-term, the pair has largely recovered from recent lows in 2015. The technical structure suggests a growing upside momentum. The pair is trading above from its 200 DMA. Strong resistance can be found at 0.9500 psychological level.
USD/CHF Weakening, USD/CAD Stalling Below 1.3400, AUD/USD Stalling Within Strong Resistance Area
USD/CHF Weakening.
USD/CHF is declining. Hourly support is given at 0.9862 (31/01/2017 low). Key resistance can be found at a distance at 1.0344 (15/12/2016 high). Expected to show continued weakness.
In the long-term, the pair is still trading in range since 2011 despite some turmoil when the SNB unpegged the CHF. Key support can be found 0.8986 (30/01/2015 low). The technical structure favours nonetheless a long term bullish bias since the unpeg in January 2015.
USD/CAD Stalling below 1.3400.
USD/CAD is bouncing. However a break of resistance area around 1.3400 is needed to invalidate the current short term bearish technical structure. The road seems still wideopen for larger decline. Key support is given at 1.2969 (31/01/2017 low).
In the longer term, there is a golden cross with the 50 dma crossing the 200 dma indicating further upside pressures. Strong resistance is given at 1.4690 (22/01/2016 high). Long-term support can be found at 1.2461 (16/03/2015 low)
AUD/USD Stalling within strong resistance area.
AUD/USD has failed to test the key resistance at 0.7778 (08/11/2016 high). Hourly support at 0.7664 (16/03/2017 low) has been broken. Expected to see some short-term weakness.
In the long-term, we are waiting for further signs that the current downtrend is ending. Key supports stand at 0.6009 (31/10/2008 low) . A break of the key resistance at 0.8295 (15/01/2015 high) is needed to invalidate our long-term bearish view.
EUR/USD Consolidating Around 1.0800 Within Bullish Trend, GBP/USD Continued Increase, USD/JPY Ready For Another Leg Lower
EUR/USD Consolidating around 1.0800 within bullish trend.
EUR/USD keeps on pushing higher, even though the pair is now pausing around 1.0800. A break of the upside channel would signal persistent buying pressures. Key resistance is given at a distance 1.0874 (08/12/2017 high). Strong support can be found at 1.0493 (22/02/2017 low). The technical structure suggests deeper increase towards resistance at 1.0874.
In the longer term, the death cross late October indicated a further bearish bias. The pair has broken key support given at 1.0458 (16/03/2015 low). Key resistance holds at 1.1714 (24/08/2015 high). Expected to head towards parity.
GBP/USD Continued increase.
GBP/USD has broken bearish downtrend channel. The pair has broken resistance at 1.2429 and there are rooms for further strength. Hourly resistance is located at 1.2570 (24/02/2017 high). Hourly support is given at 1.2324 (03/17/2017 low).
The long-term technical pattern is even more negative since the Brexit vote has paved the way for further decline. Long-term support given at 1.0520 (01/03/85) represents a decent target. Long-term resistance is given at 1.5018 (24/06/2015) and would indicate a long-term reversal in the negative trend. Yet, it is very unlikely at the moment.
USD/JPY Ready for another leg lower.
USD/JPY has failed to break key resistance given at 115.62 (19/01/2016 high) confirming persistent selling pressures. The pair has broken strong support at 111.36 (28/11/2016 low). Hourly resistance can be located at 113.57 (16/03/2017 high).
We favor a long-term bearish bias. Support is now given at 96.57 (10/08/2013 low). A gradual rise towards the major resistance at 135.15 (01/02/2002 high) seems absolutely unlikely. Expected to decline further support at 93.79 (13/06/2013 low).
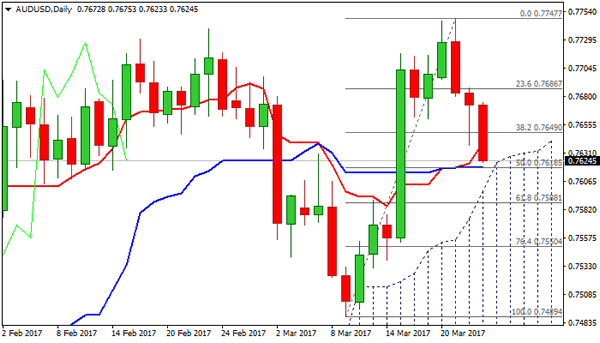
AUDUSD – Extended Pullback Approaches Top Of Rising Daily Cloud
The Aussie remains under pressure and accelerated lower on Wednesday, after previous day's dip was contained at 0.7637 and subsequent bounce resulted in close well above cracked pivot at 0.7649 (Fibo 38.2% of 0.7489/0.7747 upleg).
Fresh weakness is threatening key supports at 0.7618/0.7597 (daily Kijun-sen / top of widening daily Ichimoku cloud.
Pullback from fresh high at 0.7747 needs to find ground at these supports to keep overall bullish structure intact for fresh upside attempts.
Conversely, penetration into daily cloud and violation of nearby 0.7588 pivot 9Fibo 61.8%) would signal further weakness and open 0.7550 (Fibo 76.4%) and 0.7541 (200SMA).
Res: 0.7649, 0.7665, 0.7682, 0.7700
Sup: 0.7618, 0.7597, 0.7588, 0.7550
China Money Market Conditions Remain Fragile
China's financial system continues to display fragility and liquidity squeeze. China's 7-day repo rate jumped to 5.5% (close), the highest level since late 2014, on Tuesday, followed by PBOC's injection of RMB 80-90B to the market on Wednesday as some small banks failed to repay debts in the interbank market. Less than a week ago, PBOC raised a range of short-term and medium-term interest rates to reduce financial risks, thought to be a response to Fed funds rate hike. Interbank rates should remain volatile over the coming week, ahead of PBOC's quarterly macro-prudential assessment in late March. Although recent data suggested that the problem of capital outflow eased in February, ongoing interest rate normalization in the US would prolong China's capital outflow problem, sustaining the challenges facing China in the implementation of its monetary policy.
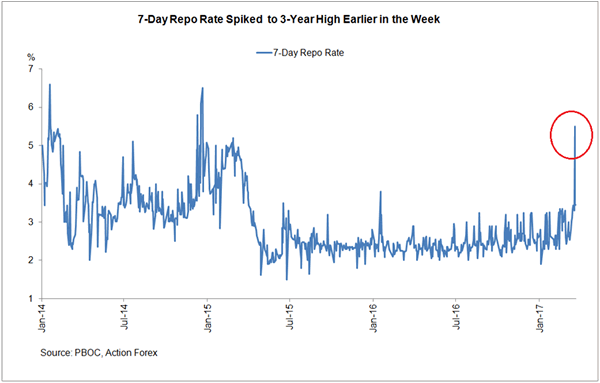
As a gauge of liquidity in China, the sudden uptick in the 7-day repo is alarming. Hovering around mid-3% level these two days, the rate jumped to as high of 9.5% earlier in Tuesday before settling at 5.5% for the day. This has overshot the underlying trend of interbank tightening and has raised concerns over China's tight credit condition. Less than a week ago, PBOC raised a range of short-term and medium-term interest rates last Thursday, following the Fed's rate hike of +25 bps. The reverse repo rates for 7 days, 14 days and 28 days, increased +10 bps to 2.45% 2.6% and 2.75% for 7 day, 14 days and 28 days, respectively. The rates for medium lending facility (MLF) for 6 months and 1 year also added +10 bps to 3.05% and +3.2%, respectively. It was estimated that the move had eliminated RMB120B from the market. The central bank affirmed that the move aimed at deleveraging, "deflating bubbles", and risk prevention. While PBOC would prefer to continue guiding an upward trend in interbank rates in order to curb bubbles and prevent risks in certain 'risky' areas (e.g. housing market), the implementation would be a cautious one as the market is obviously vulnerable to small increase in funding costs.
Recall that China's FX reserve, rising for the first time in 8 months, added +US$ 6.9B to US$ 3.01 trillion in February. After adjusting for currency valuation effects, the reserves probably increased US$ 19-25B in the month. While this might be the first signal that China's capital outflow problem has tamed, we suggested in our previous report that PBOC's FX positions are insightful for a clearer outlook of China's capital flow situation. The second chart below shows that China's capital outflow problem indeed eased last month. The monthly change in total foreign assets position (including FX, gold and "other" foreign assets) is not subject to valuation effect and can be considered as PBOC's cost of acquiring foreign assets. The change in FX position is most directly related to the central bank's FX intervention. The changes in both positions rose to the levels not seen since mid-2016.
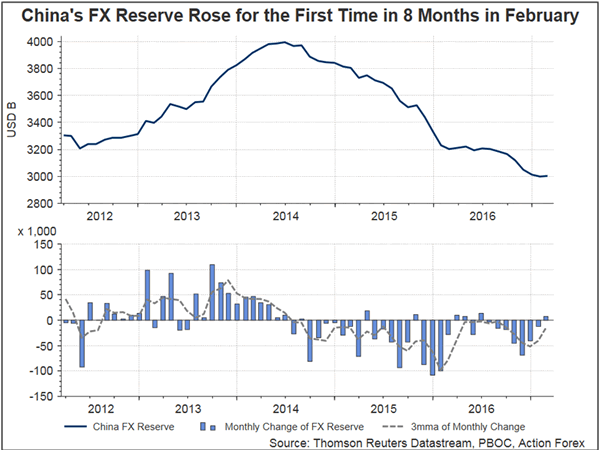
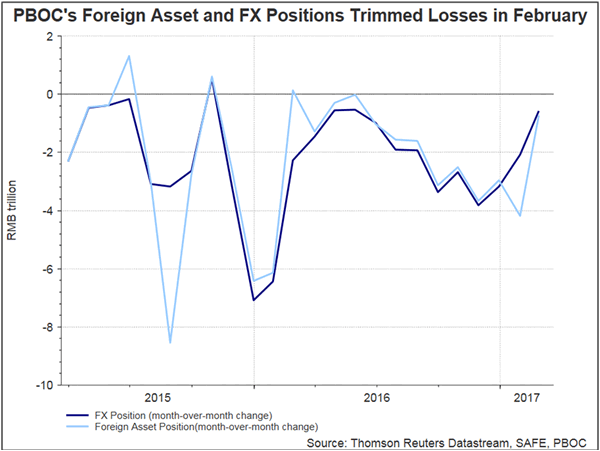
Part of the improvement can be attributed to one-off and seasonal factors. For instance, repatriation of unreported export proceeds might have affected the figure, while a shorter month in February had also reduced the time that the public could engage in capital flows. Nonetheless, government's capital control measures have also played an important role. Indeed, the crackdown on outward M&A has led to declines in China's outbound investment, by -39% y/y and -36% y/y in December and January respectively. The above-mentioned rate hikes have also helped retain capital. This is another rationale for PBOC to continue guiding interbank rates higher.
DAX – Steady As German Consumer Climate Dips, Eurozone Consumer Confidence Next
The DAX Index has inched higher in the Thursday session. Currently, the DAX is at trading at 11,926.50. On the release front, GfK German Consumer Climate dipped to 9.8 points, shy of the forecast of 10.1 points. Later in the day, the eurozone releases consumer confidence data. On Friday, Germany and the eurozone release Manufacturing PMIs, both of which should be treated as market-movers.
German consumer confidence lost ground for a second straight week, as the GfK indicator fell to 9.8, its lowest level since November 2016. The drop is largely a result of higher inflation, as consumers are more concerned that their purchasing power has been reduced. Still, the German economy, the largest in Europe, remains in solid shape, as the economy is expected to expand 1.5% in 2017. German data is regarded as a bellwether for the eurozone, so the markets will be keeping a close eye on the upcoming German Manufacturing PMI report.
With the Fed quarter-point hike behind us, what can we expect next from the central bank? Based on the Fed’s rate statement as well the dot plot, the Fed expects to raise rates two more times in 2017, for a total of three hikes this year. Earlier this week, Chicago Fed President Charles Evans echoed this sentiment, saying he expected the Fed to raise rates two more times this year. Although one could make a strong case that three rate hikes in 2017 would be impressive, the markets appear disappointed and would like four hikes, given the strong performance of the US economy. The Fed’s cautious approach over monetary policy, together with growing frustration over a lack of coherent economic policy from President Donald Trump, has soured investor sentiment, which is weighing on stock markets in both the US and Europe.
US Oil Inventories On Rise, Existing Home Sales Come In Worse Than Expected
'There is a small supply of homes for sale and great demand for them, and that's driving prices higher in many markets. We believe the strong appetite for homes will continue, people just need more homes to choose from.' - Gino Blefari, Berkshire Hathaway HomeServices
Residential home sales plunged in February despite the promising start of the year. Contrary to experts' forecasts, total existing home sales slipped 3.7% over the month of February. Nevertheless, last month's results were still 5.4% higher than a year ago. According to the National Association of Realtors, the drop was mainly attributable to shortage of homes in the affordable price range. In February, the median house price soared 7.7%, which tags the 60th consecutive monthly increase. Realtors cannot satisfy the demand because more prosperous buyers quickly acquire newly listed houses and, thus, leave minimal choices to the remaining customers. Consequently, housing inventories went up 4.2% but still remained lower than a year ago. The other data revealed that on the week ended March 17, US crude oil inventories surged 5.0M barrels, which significantly exceeds experts' forecasts. Moreover, the week highlighted the tenth increase in the last eleven weeks and presented a new record of 533.1M barrels.