
Sample Category Title
USD/CHF Candlesticks and Ichimoku Analysis
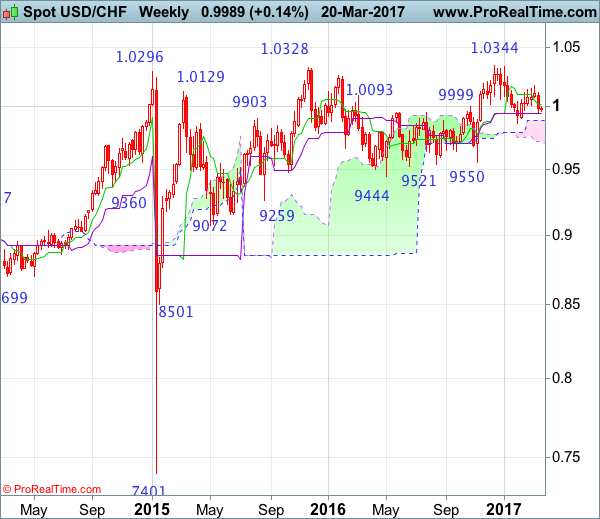
Weekly
• Last Candlesticks pattern: Doji
• Time of formation: 26 Sep 2016
• Trend bias: Sideways
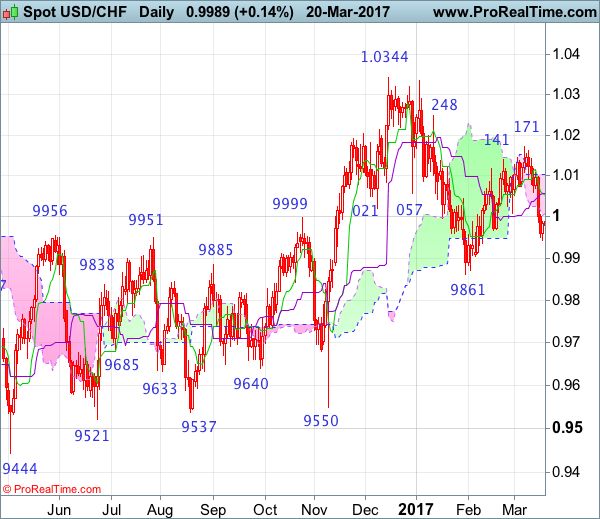
Daily
• Last Candlesticks pattern: Shooting star
• Time of formation: 25 Oct 2016
• Trend bias: Near term up
USD/CHF – 0.9963
The greenback dropped again last week and has remained under pressure, adding credence to our bearish view that top has possibly been formed at 1.0171 earlier this month and consolidation with mild downside bias remains for test of 0.9930-35, however, a daily close below there is needed to confirm early rebound from 0.9861 has ended at 1.0171, bring further fall to said support at 0.9861. A drop below this level would revive bearishness and extend erratic decline from 1.0344 top for retracement of early upmove to 0.9850-55 (61.8% Fibonacci retracement of 0.9550-1.0344) and possibly towards 0.9800.
On the upside, whilst initial recovery to 1.0000-10 cannot be ruled out, reckon the Tenkan-Sen (now at 1.0052) would limit upside and bring another decline later. A break of the upper Kumo (now at 1.0103) would abort and prolong choppy trading within recent established broad range, however, said resistance at 1.0171 should remain intact. Only above 1.0171 would signal the erratic rise from 0.9861 (Jan’s low) is still in progress and may extend further gain to 1.0195-00, having said that, reckon key resistance at 1.0248 would cap upside and bring retreat later.
Recommendation: Sell at 1.0010 for 0.9810 with stop above 1.0110.
On the weekly chart, last week’s selloff adds credence to the indicated shooting star bearish candlestick pattern, justifying our view that the rebound from 0.9861 low has ended there and consolidation with downside bias remains for weakness to 0.9930-35, however, a weekly close below there is needed to confirm and signal the fall from 1.0344 top has resumed for retracement of early upmove to 0.9850-55 (61.8% Fibonacci retracement) and possibly towards the Ichimoku cloud bottom (now at 0.9722) but reckon downside would be limited to 0.9690-00 and price should stay well above support at 0.9550.
On the upside, expect recovery to be limited to the Tenkan-Sen (now at 1.0016) and price should falter below 1.0075-80, bring another decline. Only break of said resistance at 1.0171 would extend the rebound from 0.9861 to 1.0195-00 but price should falter below key resistance at 1.0248, bring further choppy trading. A sustained breach above this level would signal the retreat from 1.0344 has ended, bring further gain to 1.0335-44 resistance area but break there is needed to signal early upmove has resumed for headway to 1.0400-10 and later 1.0500.
EUR/CHF Buying Pressures Increase, EUR/JPY Temporary Surge, EUR/GBP Bullish Flag Pattern.
EUR/CHF Buying pressures increase.
EUR/CHF's bullish pressures increase. The medium-term pattern suggests us to see continued bearish pressures towards key support that can be found at 1.0623 (24/06/2016 low). Yet, the pair is facing stronger short-term bullish pressures.
In the longer term, the technical structure is mixed. Resistance can be found at 1.1200 (04/02/2015 high). Yet,the ECB's QE programme is likely to cause persistent selling pressures on the euro, which should weigh on EUR/CHF. Supports can be found at 1.0184 (28/01/2015 low) and 1.0082 (27/01/2015 low).
EUR/JPY Temporary surge.
EUR/JPY rejection at 122.88 has triggered a correction. Yet, the pair is very volatile. Supports stand at 120.55 (17/01/2017 low) and 120.02 (08/03/2017 low). Resistance stands at 122.88 (13/03/0217 high).
In the longer term, the technical structure validates a medium-term succession of lower highs and lower lows. As a result, the resistance at 149.78 (08/12/2014 high) has likely marked the end of the rise that started in July 2012. Strong support at 94.12 (24/07/2012 low) looks nonetheless far away.
EUR/GBP Bullish flag pattern.
EUR/GBP is correcting lower yet formation of bullish flag suggest reversal of current weakness targeting 0.9000. Key resistance is given at 0.8854 (15/01/2017 high). Support is located at 0.864505/02/2017).
In the long-term, the pair has largely recovered from recent lows in 2015. The technical structure suggests a growing upside momentum. The pair is trading above from its 200 DMA. Strong resistance can be found at 0.9500 psychological level.
USD/CHF Consolidating, USD/CAD Slight Bounce, AUD/USD Monitor The Key Resistance At 0.7778.
USD/CHF Consolidating.
USD/CHF has paused after sharp exit from uptrend channel. Hourly support is given at 0.9862 (31/01/2017 low) has been broken. Key resistance can be found at a distance at 1.0344 (15/12/2016 high). Expected to consolidate.
In the long-term, the pair is still trading in range since 2011 despite some turmoil when the SNB unpegged the CHF. Key support can be found 0.8986 (30/01/2015 low). The technical structure favours nonetheless a long term bullish bias since the unpeg in January 2015.
USD/CAD Slight bounce.
USD/CAD is bouncing. However a break of resistance area around 1.3400 is needed to invalidate the current short term bearish technical structure. The road seems still wideopen for larger decline. Key support is given at 1.2969 (31/01/2017 low).
In the longer term, there is a golden cross with the 50 dma crossing the 200 dma indicating further upside pressures. Strong resistance is given at 1.4690 (22/01/2016 high). Long-term support can be found at 1.2461 (16/03/2015 low).
AUD/USD Monitor the key resistance at 0.7778.
AUD/USD has successfully tested the support at 0.7497. A break of the key resistance at 0.7778 (08/11/2016 high) is needed to open the way for further strength. Hourly supports can be found at 0.7664 (16/03/2017 low).
In the long-term, we are waiting for further signs that the current downtrend is ending. Key supports stand at 0.6009 (31/10/2008 low) . A break of the key resistance at 0.8295 (15/01/2015 high) is needed to invalidate our long-term bearish view.
EUR/USD Pushing Higher, GBP/USD Challenging Its Declining Trendline, USD/JPY Continued Weakness Within Sideways Channel.
EUR/USD Pushing higher.
EUR/USD is challenging the resistance implied by its rising trendline (around 1.0795). A break of upside would signal persistent buying pressures. Key resistance is still given at a distance 1.0874 (08/12/2017 high). Strong support can be found at 1.0493 (22/02/2017 low). The technical structure suggests deeper increase towards resistance at 1.0874.
In the longer term, the death cross late October indicated a further bearish bias. The pair has broken key support given at 1.0458 (16/03/2015 low). Key resistance holds at 1.1714 (24/08/2015 high). Expected to head towards parity.
GBP/USD Challenging its declining trendline.
GBP/USD has successfully tested the support at 1.2110 and continues to bounce higher. A break of key resistance (at 1.2429) is needed to open the way for further strength. Yet, the pair remains in a clear downtrend suggesting short term correction. Key resistance can be located at 1.2570 (24/02/2017 high). Hourly support is at 1.2324 (03/17/2017 low).
The long-term technical pattern is even more negative since the Brexit vote has paved the way for further decline. Long-term support given at 1.0520 (01/03/85) represents a decent target. Long-term resistance is given at 1.5018 (24/06/2015) and would indicate a long-term reversal in the negative trend. Yet, it is very unlikely at the moment.
USD/JPY Continued weakness within sideways channel.
USD/JPY has failed to break key resistance given at 115.62 (19/01/2016 high) confirming persistent selling pressure. The pair remains stuck in sideways trading pattern between 111.36 and 115.62. Hourly support given at 112.27 (intraday low). Hourly resistance can be located at 113.57 (16/03/2017 high).
We favor a long-term bearish bias. Support is now given at 96.57 (10/08/2013 low). A gradual rise towards the major resistance at 135.15 (01/02/2002 high) seems absolutely unlikely. Expected to decline further support at 93.79 (13/06/2013 low).
FTSE Fall After CPI Data But Near-Term Action Remains Within 7326/74 Range
FTSE dipped to the session low at 7334 on upbeat UK CPI data that boosted pound, falling from session high at 7367, where hourly cloud base capped recovery attempts. The index is holding within 7326/7374 range for the third straight day, after pullback from fresh record high at 7444 found footstep at 7326 pivot (Fibo 61.8% of 7254/7444 upleg, reinforced by rising 20SMA). Near-term studies are in neutral mode, as the price is in range-trading, however, overall picture remains bullishly aligned. While 7326 support holds, scope exists for fresh attempts higher. Break above range top and filling last week's gap are needed to generate stronger bullish signal and re-focus 0.7444 top. Otherwise, increased downside risk could be expected on violation and close below 7326 Fibo support that would expose next pivot at 7309 (sideways-moving daily Kijun-sen) and risk return to 7254 (09 Mar trough) on stronger bearish acceleration.
Res: 7367, 7374, 7399, 7424
Sup: 7334, 7326, 7309, 7298
EUR/USD – Euro Hits 1.08 After French Election Debate
EUR/USD has posted gains in the Tuesday session. Currently, the pair is trading at the 1.08 line. On the release front, it's another quiet day. The sole event in Europe is a meeting of EU finance ministers. In the US, FOMC member William Dudley will speak at a Bank of England conference in London. The US will also release Current Account, with the deficit expected to rise to $129 billion.
With the Fed's quarter-rate point behind us, what's next for Janet Yellen & Co.? The CME Group has priced a rate hike in May at just 6%, while a June move is priced at 54%. With a dearth of key fundamentals in the US this week, the markets are left to monitoring comments from FOMC members who will be speaking this week, including Fed Chair Janet Yellen. On Monday, Chicago Fed President Charles Evans said he expects the Fed to raise rates two more times this year. This echoes the Fed's projection in its rate statement. Although three rate hikes in 2017 appears impressive, market players want four hikes, and have reacted with disappointment to the Fed's more cautious approach. This has sent the US dollar lower, and the euro has improved to 5-week highs, briefly punching past the 1.08 line on Tuesday.
The Dutch election last week was cheered by EU backers across the continent and boosted the euro. Next stop on the election train is France, which holds presidential elections next month. Polls have far rightist Marine Le Pen and centrist Emmanuel Macron running neck and neck in the first round of the presidential election on April 23. Still, Macron is expected to win in the second-round vote in May. In a highly-anticipated television debate on Monday, Macron and Le Pen had a chance to hawk their wears, and a survey found that Macron won the debate. Le Pen, a far right candidate and euro-sceptic, has pledged to take France out of the euro and hold a referendum on EU membership. Macron's strong showing in the debate has improved market sentiment and helped boost the euro on Tuesday. France boasts the number two economy in the eurozone, so we can expect more volatility from the euro as we get closer to Election Day.
Forex Technical Analysis
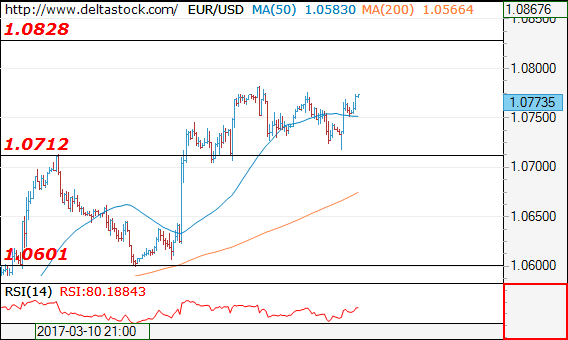
EUR/USD
Current level - 10773
Yesterday's slide to 1.0712 support has finalized the corrective pattern below 1.0780 and the bullish outlook is reinstated, for a rise towards 1.0828 resistance.
| Resistance | Support | ||
| intraday | intraweek | intraday | intraweek |
| 1.0828 | 1.0870 | 1.0712 | 1.0600 |
| 1.0870 | 1.0945 | 1.0600 | 1.0490 |
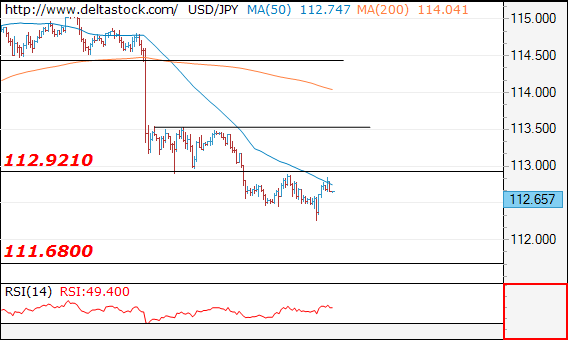
USD/JPY
Current level - 112.66
The overall outlook remains negative below 112.90, for a slide towards 111.60 area. Crucial on the upside is still 113.50.
| Resistance | Support | ||
| intraday | intraweek | intraday | intraweek |
| 112.90 | 115.65 | 111.60 | 111.60 |
| 114.50 | 118.65 | 111.60 | 110.30 |
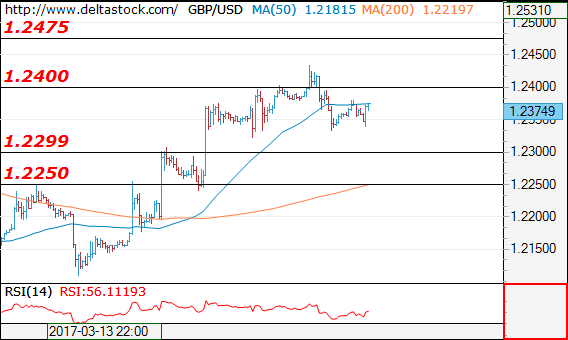
GBP/USD
Current level - 1.2374
There is a minor reversal at 1.2432 and there is an intraday risk of a dip to 1.2300 area before advancing towards 1.2570 resistance zone.
| Resistance | Support | ||
| intraday | intraweek | intraday | intraweek |
| 1.2475 | 1.2570 | 1.2300 | 1.2107 |
| 1.2570 | 1.2570 | 1.2250 | 1.1984 |
GBPUSD – Upbeat CPI Data Send Cable Above Daily Cloud
Sterling gained strong support from upbeat CPI numbers, on 2.3% y/y in Feb vs 2.1% forecast and 0.7% m/m release beat the forecast at 0.5%.
Cable surged through daily cloud in immediate reaction on data and met next target at 1.2457 (Fibo 76.4% of 1.2568/1.2107 downleg), with 1.2476 (27 Feb high) and psychological 1.2500 barrier being in focus.
Better-than-expected inflation data are expected to further boost BoE’s hawkish hold from last week’s MPC meeting for early interest rate hike.
Broken daily cloud top now acts as immediate support, with the pair looking for daily close above it to confirm strong bullish stance.
Next support lies at 1.2408 (100 SMA) and guarding daily cloud base at 1.2379 that marks lower pivot.
Res: 1.2476, 1.2500, 1.2521, 1.2568
Sup: 1.2435, 1.2408, 1.2379, 1.2337
USD Index Trading In A Simple Zig-Zag, More Weakness In View
On the 4h chart of USD Index we see price trading within a higher degree three wave decline and current bearish breakdown may be part of wave C. At the moment we see price trading within the strongest and steepest sub-wave 3). If we are on the right track, then even more weakness may follow within the mentioned wave and ideally towards the 98.00 region.
USD Index, 4H
Macron Seen as the Winner of the First French Debate
Overnight, Emmanuel Macron, a centrist politician and former economy minister, was seen as the winner of the first French Presidential debate. According to a snap opinion poll, Macron was more convincing than his four rivals. Market participants may have interpreted this as diminishing Le Pen's chances to win, which propelled the euro higher after the debate ended. The poll also showed that the second most convincing candidate was Mélenchon, with Fillon and Le Pen tied for third place.
According to the debate poll, Le Pen could even fail to make it to the second voting round, which suggests that political risks may be receding in Eurozone. As such, we think that the near-term path for the euro is to the upside. EUR/JPY rebounded from 120.70 (S1) in the aftermath of the debate and during the early European morning Tuesday, it looks to be headed for the 121.45 (R1) resistance zone. Although the structure on the 4-hour chart still suggests a short-term downtrend, the positive sentiment towards the common currency could result in more upside extensions, at least today. A decisive break above 121.45 (R1) is likely to open the way for our next resistance of 122.25 (R2), marked by the peak of the 17th of March.
The case for further euro gains is also amplified by the increased market attention towards the prospect of "ECB normalization". The latest signals from the Bank suggest there is diminished willingness among the Governing Council for any more extraordinary easing measures. However, in order to assume that the medium-term outlook of EUR/JPY has turned back positive, we would like to see a decisive close above the downside resistance line taken from the peak of the 14th of December and the 123.50 area. The main risk to our EUR-positive view is incoming French polls showing Le Pen gaining back ground, despite her seemingly poor performance in this debate. In such a case, EUR/JPY gains are likely to remain limited below the aforementioned downside resistance line.
UK PM May to officially trigger Article 50 next week
According to recent media reports, the UK government is set to trigger Article 50 of the Lisbon Treaty and commence the formal process of leaving the EU on Wednesday, the 29th of March. The office of the PM also expressed its desire for the negotiations to begin at the earliest after the triggering. Even though the UK's intent to invoke Article 50 before the end of March had been signalled multiple times and should not have come as a surprise to investors, the pound still came under selling pressure on the news.
In our view, once the negotiations begin, the forthcoming direction of sterling will likely be decided by media headlines regarding what each side is actually pursuing. Having said that, considering that much of the "hard Brexit" rhetoric may already be priced into the battered pound, we believe that the political risks surrounding GBP are likely asymmetrical. Any positive developments during the negotiation process could generate a bigger upside reaction than the corresponding downside in case of the anticipated "hard Brexit" stance. Besides the political developments, today's inflation data may prove critical for sterling as well (see below).
RBA minutes drag the Aussie somewhat lower
Overnight, the minutes of the RBA's March policy meeting showed a slightly more cautious tone compared to the meeting statement. The Bank highlighted that employment growth had continued to be concentrated in part-time jobs and that wage growth remained low, suggesting that the labor market may not be as strong as the headline employment figures indicate. As a reminder, the RBA has a twin mandate to promote full employment in addition to price stability and as such, these signals may have been interpreted by investors as increasing somewhat the probability for further easing. As such, the AUD came under selling interest in the following hours, though the reaction was not huge. Despite these cautious signals, we do not expect the RBA to actually take any action in the foreseeable future. The Bank has repeatedly highlighted that further rate cuts could amplify financial stability risks, something that we believe will be enough to stay the Bank's hand, absent some serious deterioration in the outlook for inflation and/or employment.
Today's highlights
During the European day, the UK will release its CPI data for February. The forecast is for both the headline and the core rates to have risen, something supported by the UK services PMI for the month, which showed that rapidly rising input costs led to the largest increase in prices charged by service providers for eight and a half years. At the latest BoE gathering, some members noted that they would consider reducing stimulus should there be any further upside news on the prospects for growth or inflation, while Kristyn Forbes actually voted for an immediate hike. This suggests that in case the CPIs accelerate further as expected, then in addition to the "Brexit" negotiations, another big market theme for GBP traders is likely to be whether the BoE will reduce its asset purchases, or even hike rates at some point in the foreseeable future. Such speculation could bring the pound under renewed buying interest. GBP/USD is currently trading between the support of 1.2340 (S1) and the downside resistance line drawn from the peak of the 2nd of February. Accelerating CPIs could prove the catalyst for a clear break above the aforementioned downside line and the 1.2420 (R1) resistance, something that could pave the way for the 1.2470 (R2) hurdle. Switching to the daily chart, we see that Cable remains within the wide sideways range between 1.2100 and 1.2850. Thus, the medium-term outlook remains flat in our view. Nevertheless, the fact that the latest recovery came from near the lower bound of that sideways channel increases the possibilities for the rate to continue trading north within the range.
As for the speakers, we have three on the agenda: Bank of England Governor Mark Carney, New York Fed President William Dudley and Kansas Fed President Esther George. Any comments on monetary policy from Governor Carney may be of special interest to investors, as he will be speaking shortly after the release of the inflation data.
EUR/JPY
Support: 120.70 (S1), 120.00 (S2), 119.30 (S3)
Resistance: 121.45 (R1), 122.25 (R2), 122.65 (R3)
GBP/USD
Support: 1.2340 (S1), 1.2300 (S2), 1.2245 (S3)
Resistance: 1.2420 (R1), 1.2470 (R2), 1.2525 (R3)