Sample Category Title
Canadian Wholesale Trade Improves Markedly In January
'The auto sector drove wholesaling crazy in January, enough for at least some eyebrows to be raised at what is typically seen as a second-tier Canadian economic indicator.' - Avery Shenfeld, CIBC
Canadian wholesale sales rose markedly in January, posting the largest monthly gain in more than seven years. Statistics Canada reported wholesale sales advanced 3.3% to a record C$59.09 billion, while analysts anticipated an increase of 0.3%. Meanwhile, December's 0.7% rise was revised down to 0.3%. January's figure marked the biggest climb since November 2009, when sale rose 3.8%. In volume terms, wholesale trade advanced 3.4% in January. Sales rose in four out of the seven sectors, accounting for 55% of total wholesale trade. The increase was mainly driven by higher demand in the motor vehicles and parts sector, where sales climbed 17.1%, posting the biggest monthly gain since August 2005 and ending a two-month streak of declines. Excluding this sector, wholesale sales climbed 0.3% in January. Sales in the personal and household goods sector rose 3.0%, as sales of entertainment equipment and household appliances posted a 30.6% jump. In the meantime, sales in the miscellaneous sector fell 1.0%, driven by lower demand in the agricultural supplies industry. Monday's data combined with the stronger-than-expected manufacturing sales, trade and job creation suggest that the Canadian economy started the year with solid growth.
Reserve Bank Of Australia Expresses Concerns Over Housing Market
'The acceleration in house price inflation in the fourth quarter of last year has undoubtedly continued into the start of this year and will remain a thorn in the side of the Reserve Bank of Australia for a while yet.' - Paul Dales, Capital Economics
The minutes, which were released on Tuesday, showed that members of the RBA were generally upbeat about both global and domestic economic growth. Policymakers said that global industrial production and merchandise trade improved markedly over the last several months. Furthermore, members saw significant improvements in global business sentiment and inflation. According to the minutes, economic growth climbed 1.1% in the Q4 of 2017, following a 0.5% contraction in the September quarter, which was triggered by temporary factors. The economy managed to recover in the December quarter thanks to solid export growth and a rebound in consumption and business investment. Nevertheless, members pointed to mixed labour market trends, as the economy saw strong growth in part-time employment and low wage growth. Moreover, data released last week showed that the Australian jobless rate rose unexpectedly to 5.9% in February. Members of the committee noted that financial markets were quite over the previous month, as investors turned their attention to the March meeting of the Federal Reserve and the upcoming European elections. Policymakers also expressed concerns over the Australian housing market, pointing to a steep rise in prices since the global financial crisis.
USDJPY Corrects Higher Before Final Push Towards 112.00/111.60 Targets
The pair bounces from fresh three-week low at 112.25 posted yesterday, with daily close below 112.57 (Fibo 76.4% of 111.67/115.49 rally), generating bearish signal and exposing round-figure support at 112.00, ahead of key short-term support at 111.57/67 zone (07/28 Feb lows that formed higher base.
Current move higher could be seen as correction that should be ideally capped under 113.00 (top of hourly Ichimoku cloud).
Extended upticks are expected to stay under strong 113.50 resistance zone (daily cloud base/Kijun-sen / 20/30 SMA’s), before bears resume.
Only firm break here would sideline bears and signal stronger correction.
Res: 112.88, 113.00, 113.34, 113.50
Sup: 112.57, 112.25, 112.00, 111.67
GBPUSD Attacks Daily Cloud Again Ahead Of UK CPI Data
Cable is attempting again into daily cloud, after cloud top (1.2435) capped Monday's action and subsequent dip resulted in daily close below the cloud. The pair came under pressure on announcement that UK will start formal divorce process with the EU on Mar 29, but dips were so far limited and contained by daily Kijun-sen at 1.2337. This keeps in play post-Fed bullish sentiment, seeing scope for renewed attempts through daily Ichimoku cloud (spanned between 1.2379 and 1.2435). Bullish setup of most of daily MA's and fresh momentum, keeps upside scenario favored, ahead of release of UK inflation data (due at 09:30 GMT, forecasted at 2.1% vs 1.8% previous month). Release above the forecast is expected to boost the pair for renewed attempt through 100SMA (1.2410) and attack at daily cloud top pivot (1.2435). Firm break above the cloud would accelerate towards 1.2459 (Fibo 76.4% of 1.2568/1.2107) and would expose psychological 1.2500 barrier. Conversely, repeated failure at daily cloud and repeated close below it, would generate negative signal. Daily Kijun-sen marks next downside trigger, loss of which would increase risk of reversal.
Res: 1.2410, 1.2435, 1.2459, 1.2476
Sup: 1.2379, 1.2337, 1.2309, 1.2271
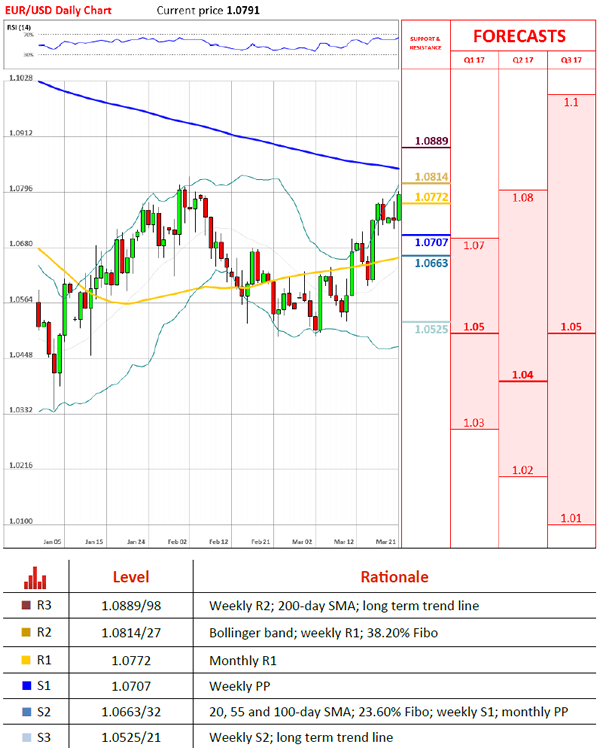
EUR/USD Breaks Resistance On Tuesday
'The euro rose, approaching a six-week high, as political concerns in the region were seen as easing after a poll showed anti-euro candidate Marine Le Pen losing ground in the French presidential debate.' – Chikako Mogi, Bloomberg
Pair's Outlook
On Tuesday morning the common European currency surged against the US Dollar and managed to break through the resistance put up by the monthly R1, which is located at the 1.0772 level. The currency pair has set its course to the next resistance level, where it is likely to stop or even change direction. Above the rate there is a resistance cluster consisting of two notable levels of significance, as the weekly R1 is located at 1.0814, and the 38.20% Fibonacci retracement level is at the 1.0826 level. Moreover, the Fibonacci retracement level is strengthened by the upper Bollinger band, which is located at 1.0827.
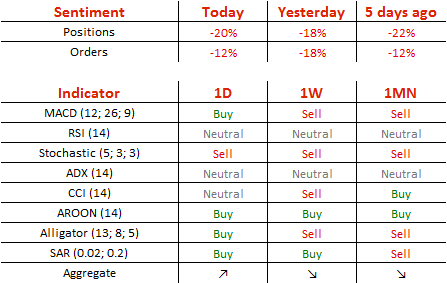
Traders' Sentiment
Traders remain bearish on the pair, as 60% of open positions are short, and 56% of trader set up orders are to sell the Euro.
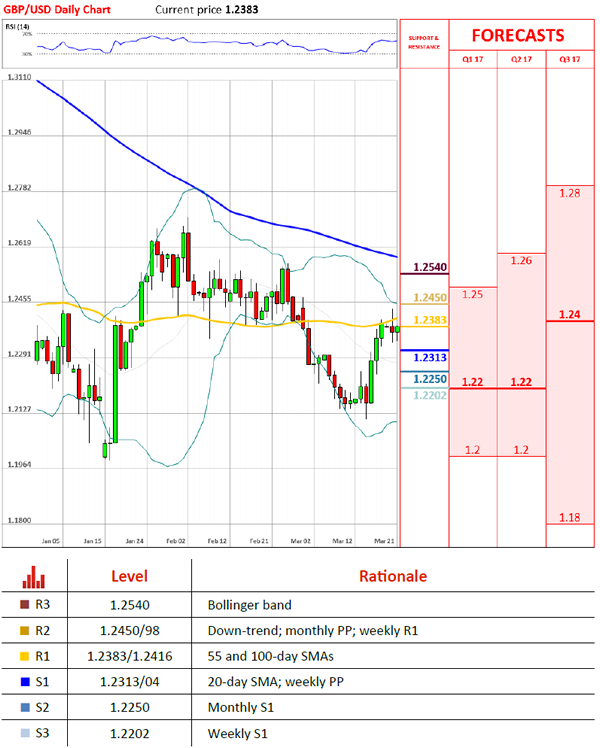
GBP/USD Still Unable To Reclaim 1.24
'Despite the doom and gloom hanging over sterling, it has held up well this year – if so traders are to be surprised with some sort of plan or minor victory from the UK government, we could in fact see GBP trading higher in a relief rally.' – ThinkMarkets (based on Reuters)
Pair's Outlook
On Monday, the GBP/USD currency pair experienced a small bearish correction, after having surged for three consecutive days last week. The situation mostly remains unchanged, with the exception of the immediate resistance area now being slightly stronger, as the 55-day SMA is now bolstering the 100-day one. However, technical studies are now giving bearish signals in the daily timeframe, suggesting that Cable could struggle to appreciate again. Ultimately, the Pound is required to stabilise above the 1.24 level in order to reach the nine-month down-trend. In case bears take over the market, the 1.23 mark is expected to hold, as it is reinforced by the weekly PP and the 20-day SMA.
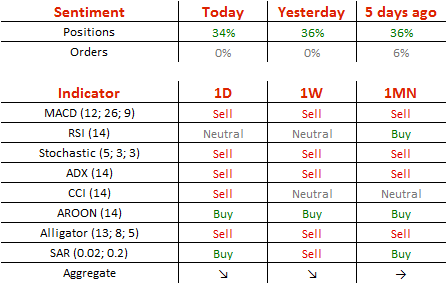
Traders' Sentiment
Today 67% of traders holding long positions (previously 68%), whereas pending orders are still equally divided between buy and sell ones.
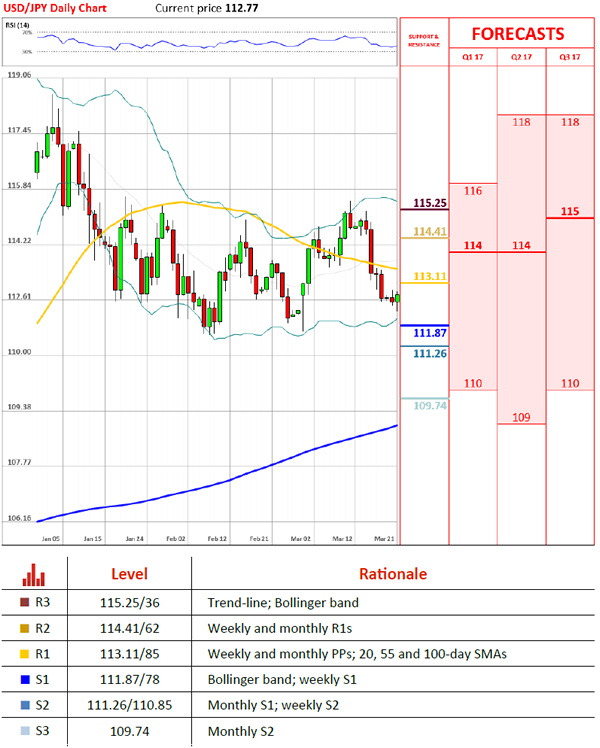
USD/JPY Attempts To Preserve The Channel Pattern
'Among safe haven currencies, investors extended their JPY short exposure by about 30% before the BOJ policy meeting.' – Deutsche Bank (based on FXStreet)
Pair's Outlook
Even though the USD/JPY pair remained relatively unchanged yesterday, a small bearish development was still sufficient for the exchange rate to stabilise below the ascending channel's support line. Nevertheless, the Buck still has the opportunity to recover and, thus, preserve the pattern. However, a rally beyond 113.00 is unlikely to occur, as a tough resistance cluster is located beyond that area. Since technical studies are unable to confirm the possibility of the positive outcome, we should not rule out the risk of a seventh consecutive decline taking place, with the nearest area to limit the losses located only around 111.80.
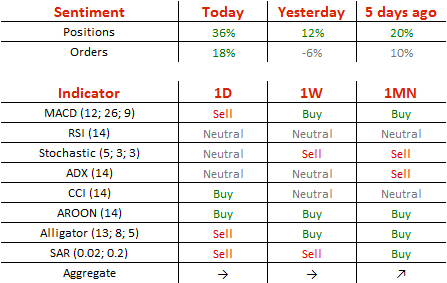
Traders' Sentiment
There are 68% of traders being long the Greenback today (previously 56%), while the share of buy orders surged from 47 to 59%.
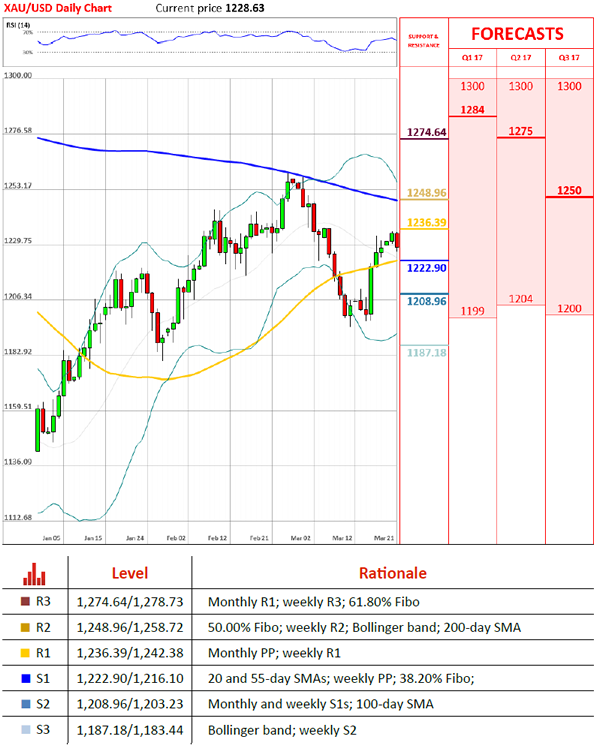
Gold Drops Below 1,230 Level
'There is no other way than looking bullish at gold for the moment. There are extended positions in dollar. We are going to see this dollar correction running for a while, which will support gold.' – Jaffrey Halley, OANDA (based on Reuters)
Pair's Outlook
During the early hours of Tuesday's trading session the yellow metal's price declined and fell below the 1,230 mark. This seems to be a consolidation of positions in the aftermath of a steady surge of more than three percent since the start of last Tuesday's trading session. It is most likely that the bullion will soon make an attempt of breaking the monthly PP, which is located at the 1,236.39 level. However, it is also possible that the commodity price will first retreat down to the 20-day SMA, which was located at 1,222.94 on Tuesday morning.
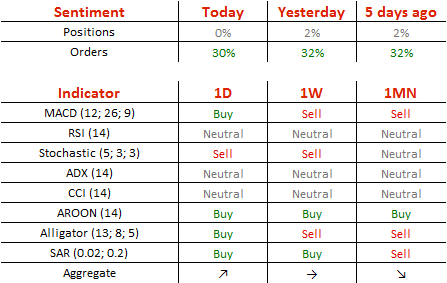
Traders' Sentiment
SWFX traders are neutral on the metal, as 50% of open positions are long. However, 65% of trader set up orders are to buy the bullion.
EURUSD – Renewed Strength Driven By Politics Focuses 1.0800/27 Targets
The Euro is in fresh acceleration higher and posts new, marginally higher highs after two-day consolidation was contained above 1.0700 handle.
The single currency received strong support from news of French presidential candidate Macron is leading the election race after winning French TV presidential debate on Monday that eased fears about potential France exit from the EU.
Friday's long red candle and Monday's Doji with long upper shadow, did little as bearish signals to intensify downside pressure, as strong post-FED bullish sentiment remains firmly in play.
The pair is eyeing psychological 1.0800 barrier and key resistance at 1.0827 (02 Feb peak, also near 50% retracement of larger 1.1298/1.0339 descend) in extension.
Sustained break here would signal bullish continuation of broader recovery rally from 1.0339 (2017 low).
Overbought slow stochastic on daily chart suggests that the pair may show hesitation ahead of 1.0827 pivot, but no firmer bearish signal seen so far.
Hourly Ichimoku cloud (spanned between 1.0743/50) marks initial support, guarding Monday's low at 1.0719 and 1.0700 handle.
Rising 10SMA continues (currently at 1.0680) to underpin and should contain extended downticks.
Res: 1.0800, 1.0827, 1.0872, 1.0931
Sup: 1.0758, 1.0743, 1.0719, 1.0700
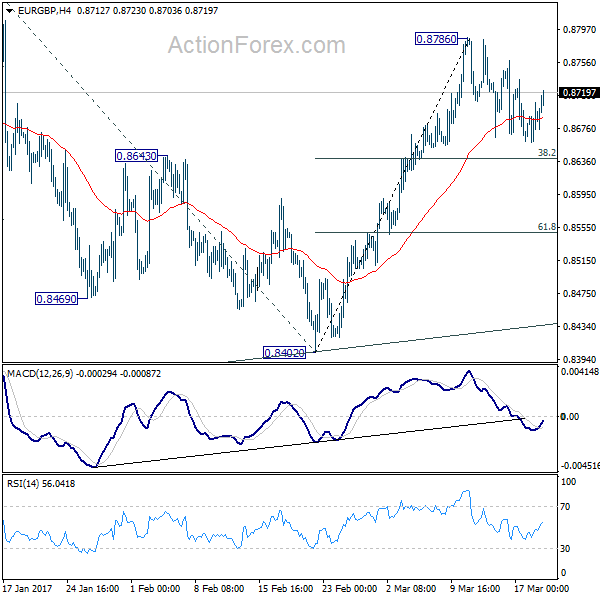
EUR/GBP Daily Outlook
Daily Pivots: (S1) 0.8664; (P) 0.8685; (R1) 0.8712; More...
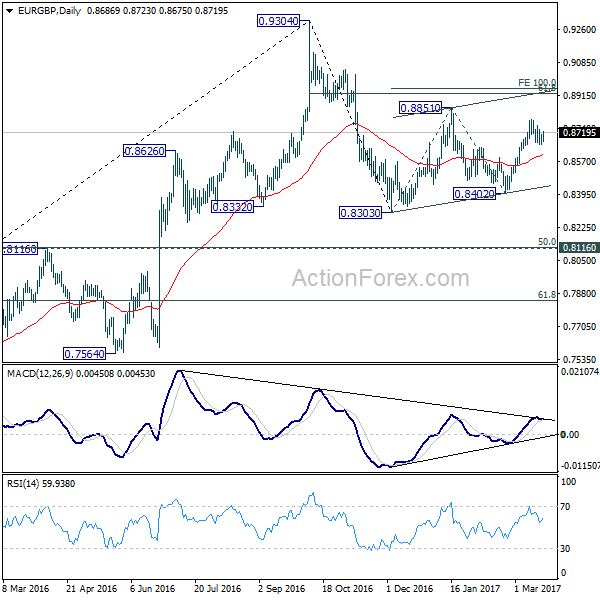
Consolidation from 0.8786 is still in progress and intraday bias stays neutral in EUR/GBP further. In case of another fall, we'd expect support from 38.2% retracement of 0.8402 to 0.8786 at 0.8639 to contain downside. Break of 0.8786 will target 0.8851 resistance and above. Price actions from 0.8303 are seen as the second leg of the corrective pattern from 0.9304. Hence, we'd expect strong resistance from 100% projection of 0.8303 to 0.8851 from 0.8402 at 0.8950 to limit upside. On the downside, sustained trading below 0.8693 will bring deeper fall to 61.8% retracement 0.8549 and below.
In the bigger picture, price actions from 0.9304 are viewed as a medium term corrective pattern. Deeper fall cannot be ruled out yet. But we'd expect strong support from 0.8116 cluster support (50% retracement of 0.6935 to 0.9304 at 0.8120) to contain downside. Overall, the corrective pattern would take some time to complete before long term up trend resumes at a later stage. Break of 0.9304 will pave the way to 0.9799 (2008 high).