Sample Category Title
Swiss CPI Declines in November
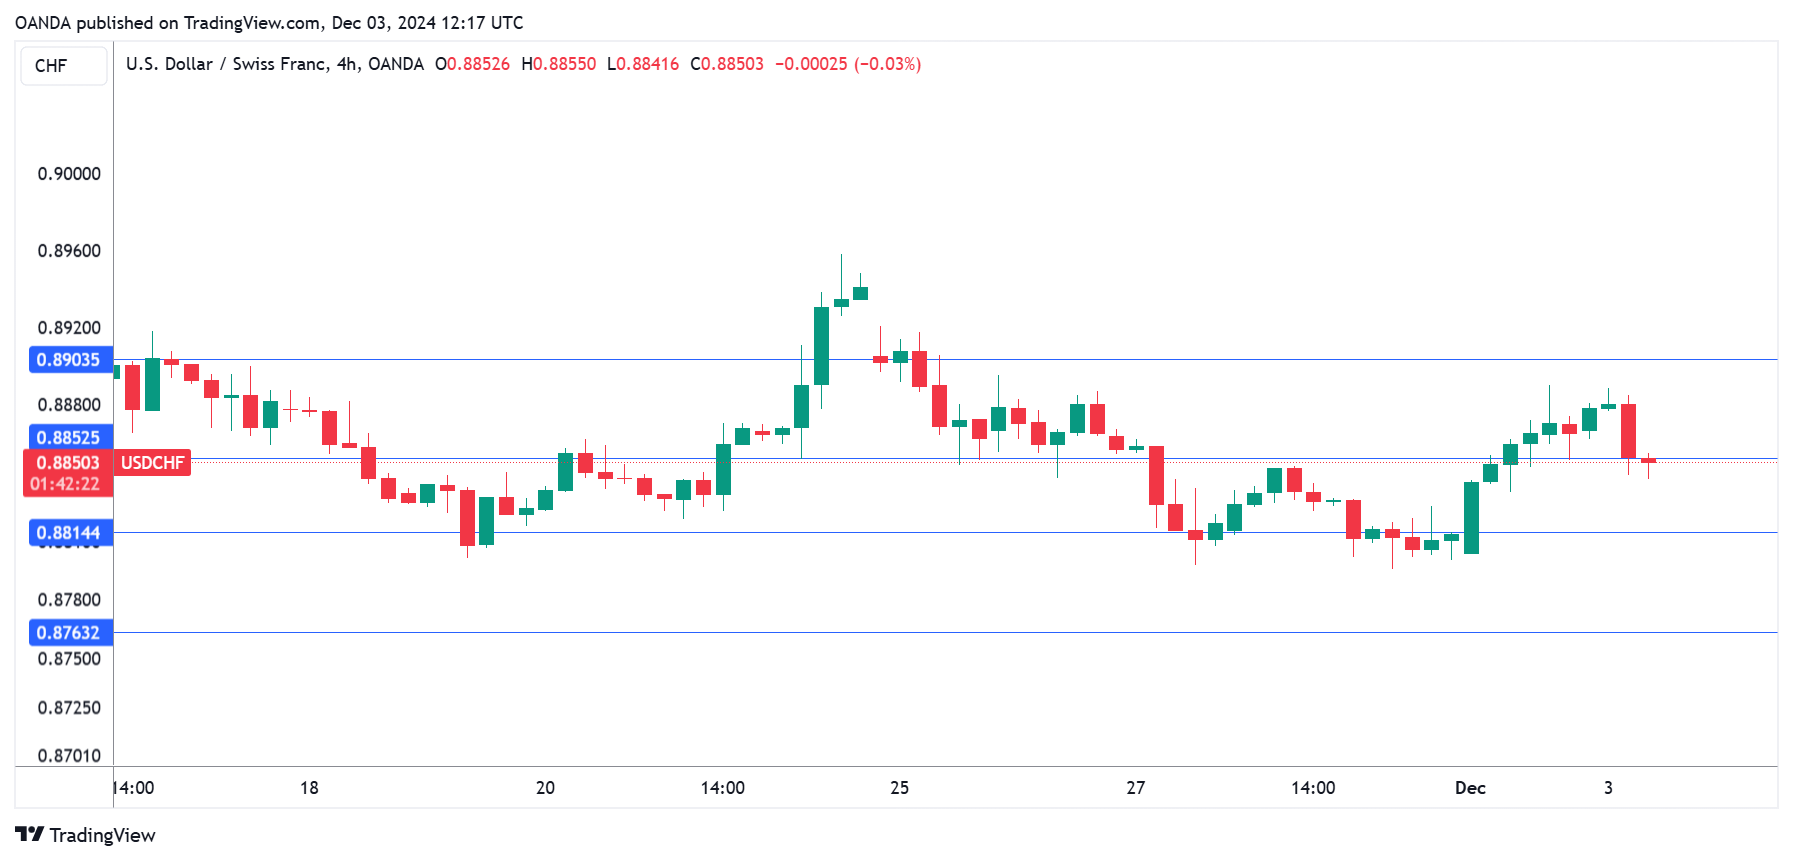
The Swiss franc has edged upwards on Tuesday. In the European session, USD/CHF is trading at 0.8846, down 0.21% on the day.
Is Switzerland facing deflation? Swiss CPI declined by 0.1% m/m in November, unchanged from October and in line with the market estimate. This marks the fourth successive month that inflation has failed to show a gain. On an annual basis, inflation climbed 0.7%, up from 0.6% in October but below of the market estimate of 0.8%.
SNB eyeing 50-bp cut
The inflation report comes one week before the Swiss National Bank’s meeting on Dec. 12 . The markets have priced an oversized 50-bp cut at 71%, with a 25-bp at 29%. Today’s inflation report indicates that risks are now on the lower side and the central bank is concerned about inflation moving to the lower band of the 0% to 2% target band.
The central bank has been aggressive in its easing cycle, lowering rates by 25 bp three times this year. The cash rate is currently at 1%, its lowest level in two years. The SNB is poised to cut rates next week and is likely to continue into next year.
The Federal Reserve meets on Dec. 18, its final meeting of the year. The Fed trimmed rates by 25 basis points last month and is expected to do the same at the December meeting. Fed Governor Christopher Waller said on Monday that he is leaning toward at cut in December but his decision could change if inflation surprised on the upside. The US releases November CPI one week prior to the rate announcement and the release will be a key factor as to whether the Fed cuts or maintains interest rates.
USD/CHF Technical
- USD/CHF is testing support at 0.8852. Below, there is support at 0.8814
- 0.8903 and 0.8941 are the next resistance lines
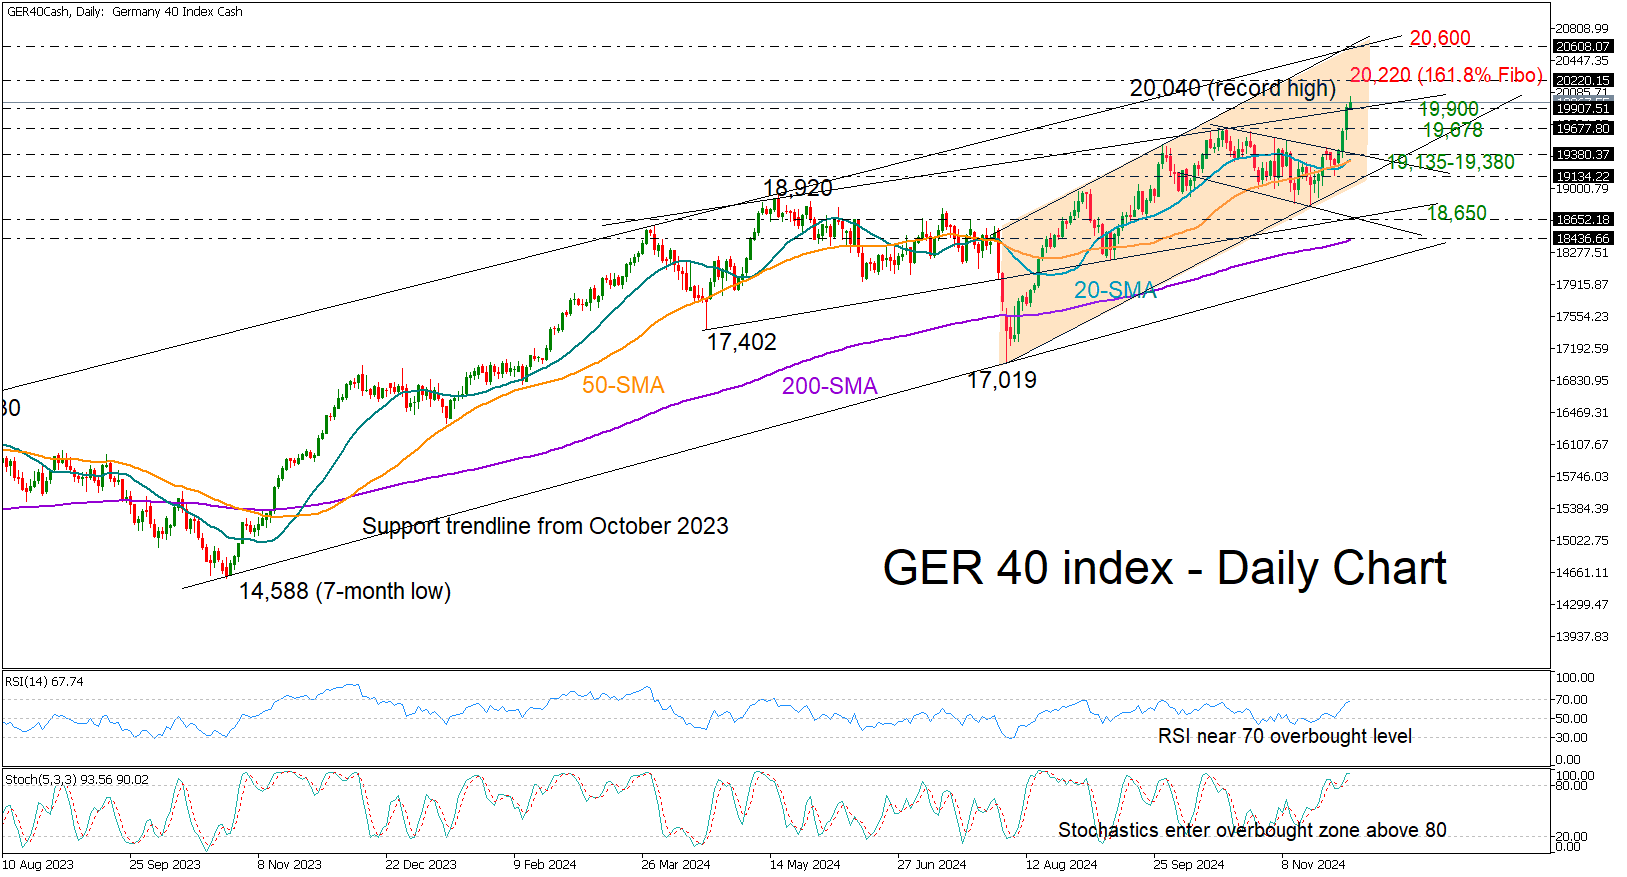
GER 40 Index Soars to Fresh Record High
- GER40 index rises vertically, unlocks 20,000 number
- Short-term bias is positive, but caution is necessary
The German 40 index surged into uncharted territory, finally breaking above the 20,000 number on Tuesday despite the Eurozone’s biggest economy facing a gloomy economic and political outlook.
After a strong rally, the index could face a pullback, especially as the RSI and the stochastic oscillator fluctuate near their overbought levels. Resistance may appear around 20,220, where the 161.8% Fibonacci extension of the October-November downfall lies. If positive momentum holds, the index could target the upper band of the short-term bullish channel seen near 20,600.
If traders take profits, pushing the index below 19,900, support could emerge near the previous high of 19,678, with further backup from the 20- and 50-day moving averages near 19,380. The tentative support line at 19,135 could also provide protection, postponing a slump toward 18,650.
In summary, the German 40 index is in festive mode, aiming to extend its record rally within the 20,000 area. Given the overbought signals, though, resistance could be around the corner at 20,220.
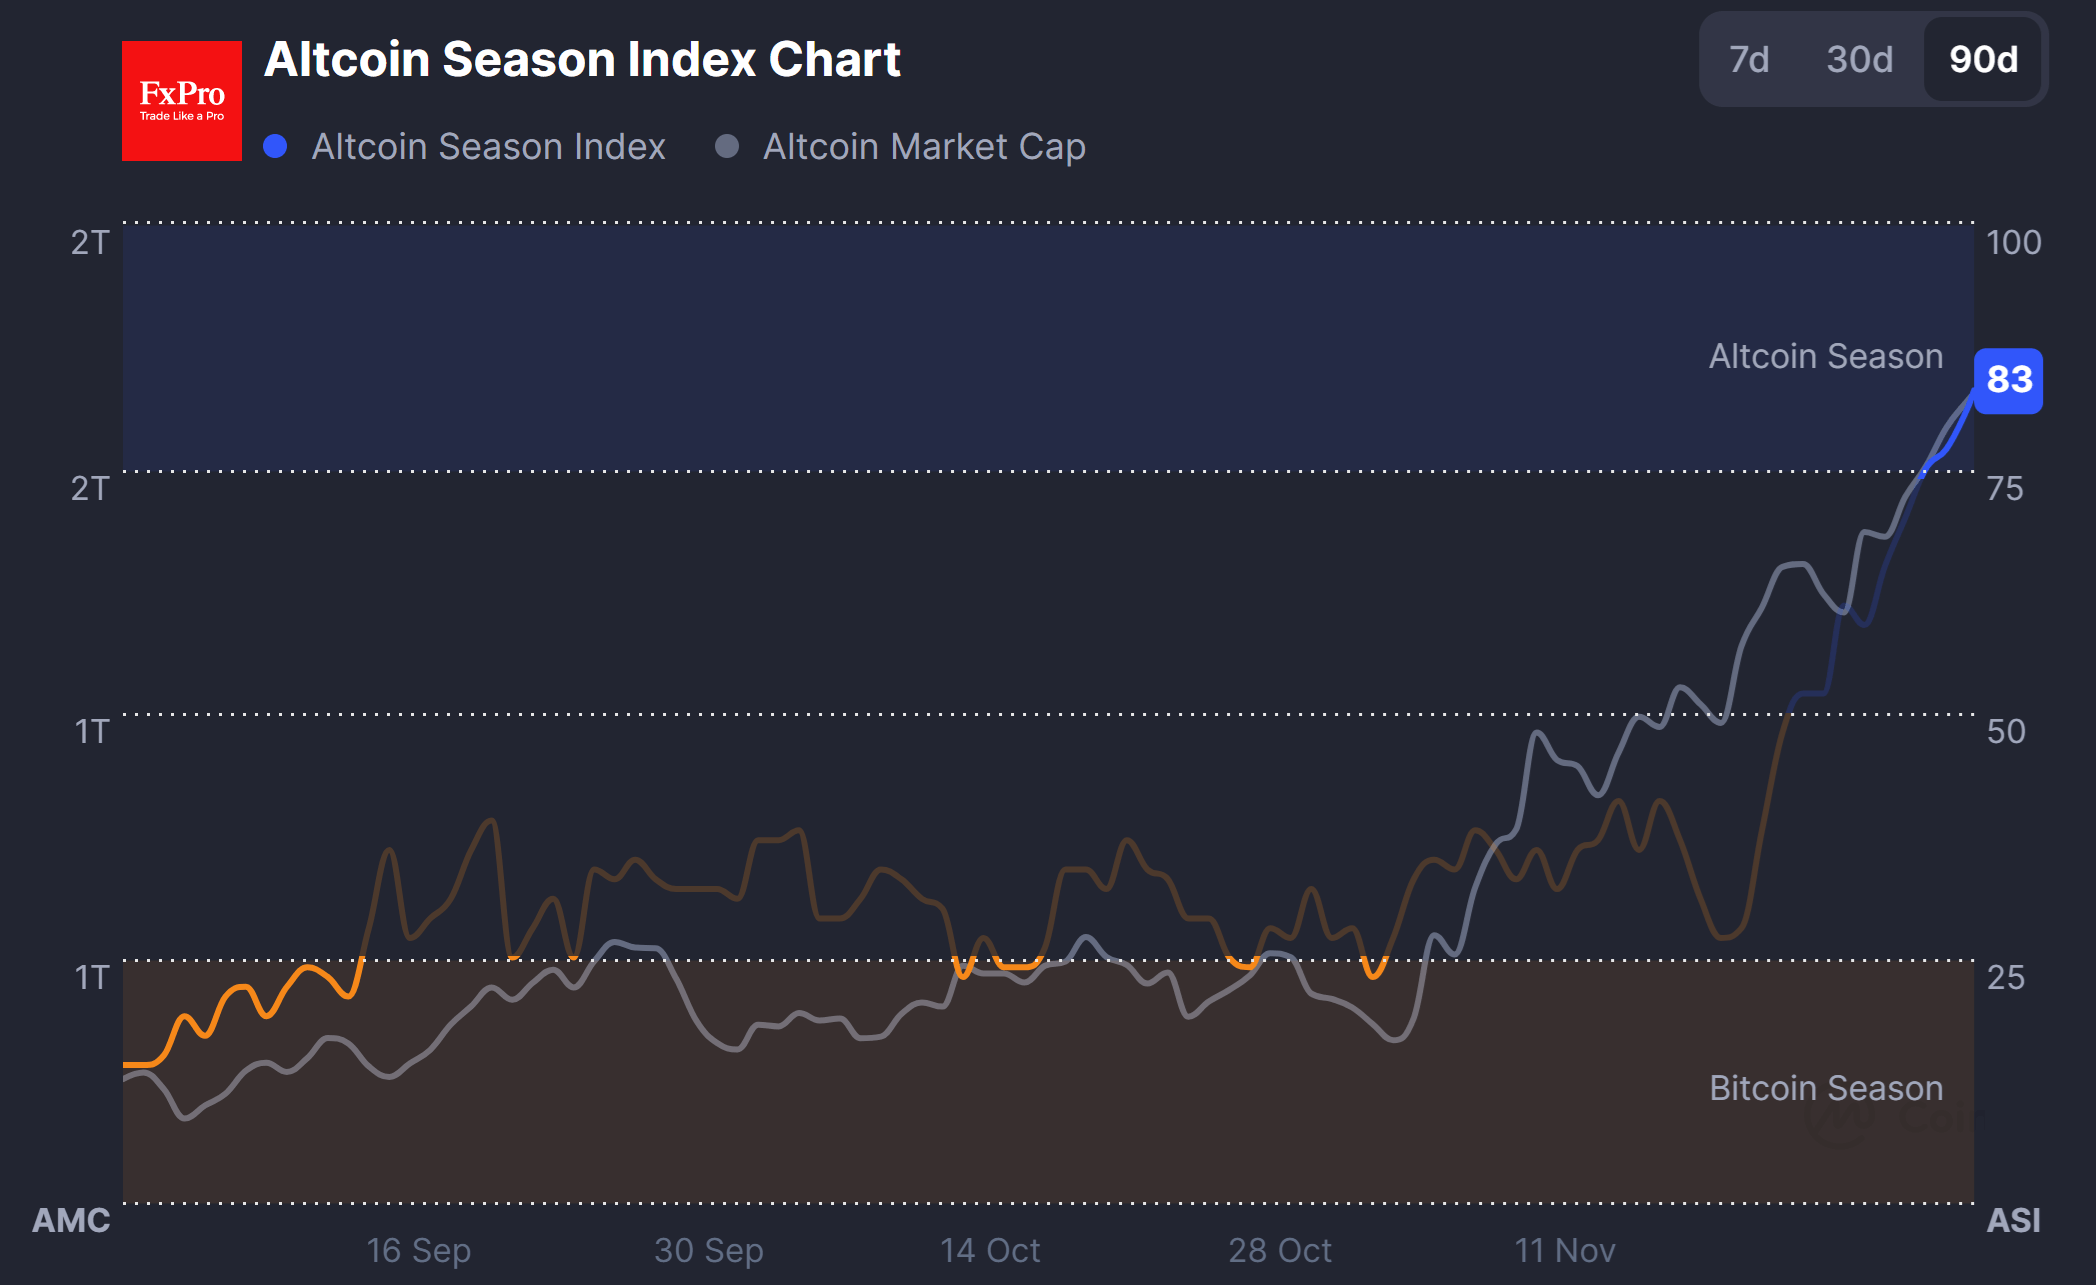
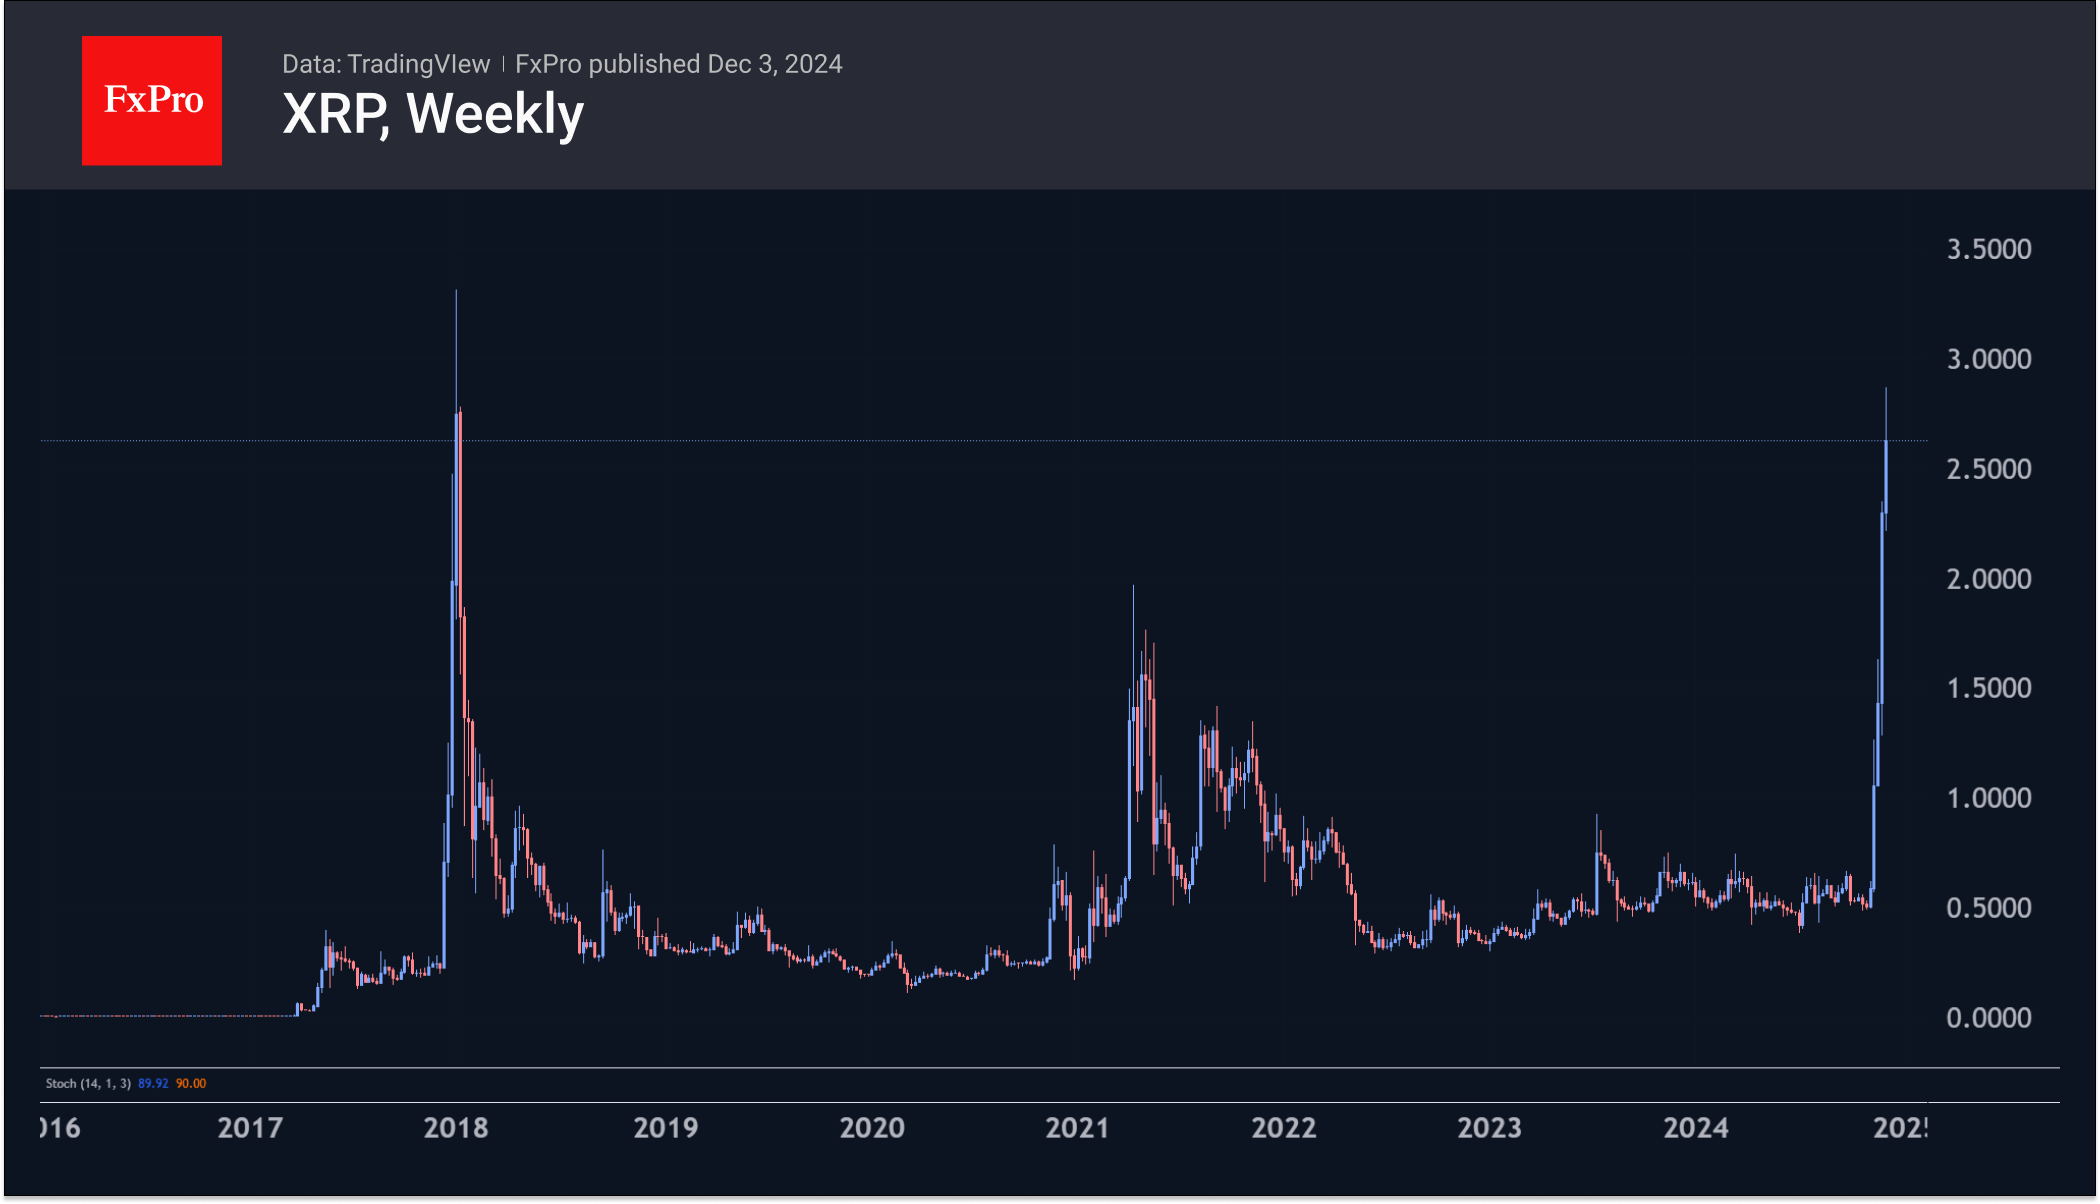
Altcoin Season Kicks off as Bitcoin Hits Ceiling
Market Picture
The cryptocurrency market is up 0.1% over the past 24 hours, but a closer look reveals that the market has hit resistance at $3.50 trillion twice since the beginning of the week, pulling back to the current $3.46 trillion.
While Bitcoin remains range-bound and unable to break through $100,000, it’s altcoin season, according to the CoinMarketCap index. The index hit 83 at the start of the day on Tuesday, an impressive rise from 23 a month ago.

Thanks to altcoins, the crypto market’s extreme greed sentiment continues. The corresponding index is at 76, and it has ranged between 75 and 84 over the past week.
Bitcoin is consolidating in the $100,000 area. Last week, an attempt was made to break below $90,000, but the momentum is mostly between $95,000 and $98,000.

The rocket of the month has been XRP, which has quadrupled in price over this period. Its capitalisation is approaching $150 billion, which is already more than Tether at $135 billion and Solana at just over $100 billion. Above the last peak of $2.9, XRP spent less than 12 hours at the beginning of 2018. The price has now stabilised at $2.6, where it spent around a week almost six years ago. It’s reasonable to expect a correction at this level as well.
In addition to waiting for a change in leadership at the SEC and a possible dismissal of the lawsuit against Ripple, market participants are also anticipating the expansion of the list of crypto ETFs for XRP-related products.
News Background
According to CoinShares, global investment in cryptocurrency funds rose by $370 million last week, following a record $3.124 billion inflow the week before. The positive trend continued for the eighth week in a row. Bitcoin investment decreased by $457 million, Ethereum investment increased significantly by $634 million, and XRP increased by a record $95 million.
Bitcoin balances on major exchanges are rapidly shrinking to historic lows, and long-term holders of the first cryptocurrency are in no hurry to enter the market with it, exacerbating the supply shortage, 10x Research noted.
Ethereum is showing the bullish pattern that Bitcoin had before the November rally, said CoinDesk analyst Omkar Godbole. The cryptocurrency’s eight-month correction has come to an end.
MicroStrategy bought an additional 15,400 BTCs for $1.5 billion at an average price of $95.976, founder Michael Saylor said. The coin purchase was funded by the sale of 3.7 million shares of the company’s stock on the open market. MicroStrategy now owns 402,100 BTC, valued at approximately $23.4 billion ($58,263 per coin).
ECB’s Cipollone: US tariffs likely to weaken both Eurozone growth and inflation
ECB Executive Board Member Piero Cipollone highlighted the potential economic implications of US tariffs on the Eurozone, emphasizing their dual impact on growth and inflation.
Cipollone noted that tariffs would weaken the Eurozone economy by reducing consumption, thereby lowering pressure on prices.
He pointed out that Chinese producers, excluded from the US market, might redirect their goods to Europe, potentially offering them at discounted prices.
On energy, Cipollone pointed out that while oil imports could become more expensive due to a stronger Dollar, US policies aimed at supporting domestic energy production could increase supply, offsetting price pressures.
"All this put together makes me think that we will have a reduction in growth but also a reduction in inflation," Cipollone concluded.
Brent Oil Prices Dip Ahead of Crucial OPEC+ Meeting
Brent crude oil prices have declined to 71.65 USD per barrel as the commodity market remains tense ahead of this week’s postponed OPEC+ meeting, now rescheduled for Thursday, 6 December. The market is concerned about the direction of future global oil supply amid fears of oversaturation. The prevailing expectation is that OPEC+ might delay its planned increase in oil supply for the third time, reflecting persistent supply uncertainties.
Despite these pressures, there are optimistic signals from the oil sector, particularly China, where a resurgence in production activity is seen as a sign of gradual economic improvement in one of the world’s largest importers of raw materials. This development could bolster the energy sector.
The geopolitical landscape remains mixed, with traders closely monitoring tensions in the Middle East. Any escalation could heighten regional instability and affect the overall oil supply dynamics in these areas.
So far, the recent strengthening of the US dollar has not significantly impacted oil prices. However, future market dynamics could shift as global economic conditions evolve.
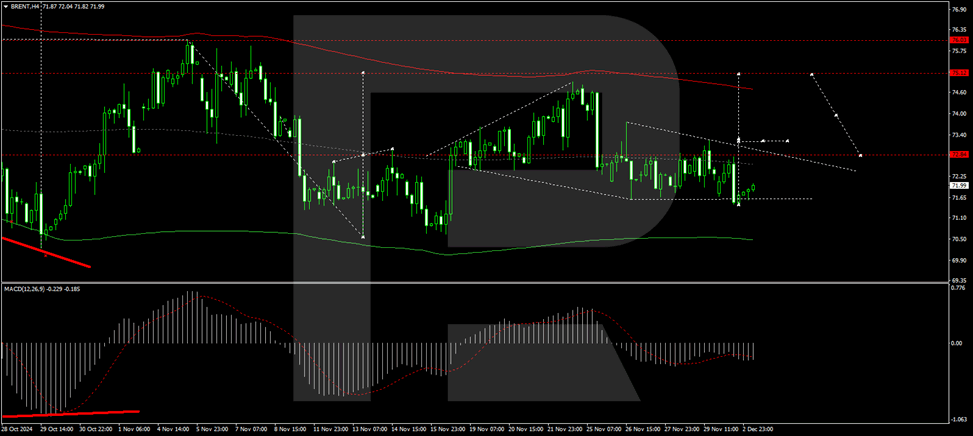
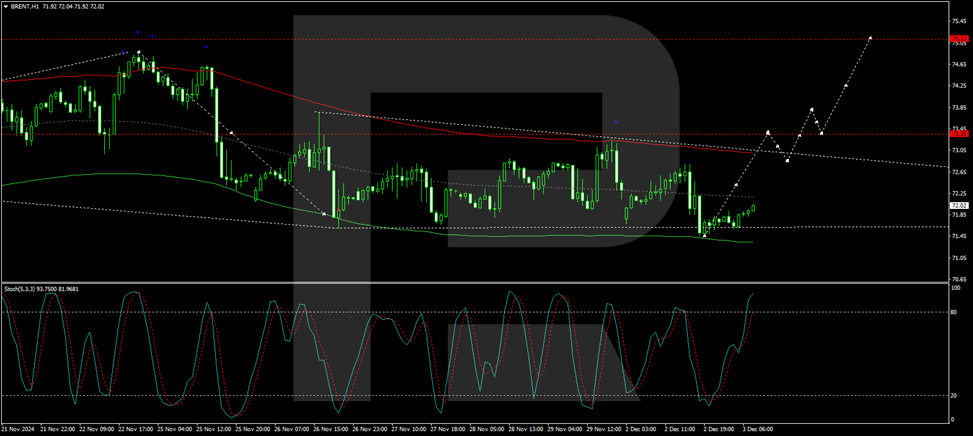
Technical analysis of Brent Oil
H4 chart: the market is navigating a broad consolidation range centred around the 73.33 level, with recent extensions downward to 71.55. An upward movement towards 73.33 is anticipated today. Should the price exit this range on the higher side, there may be potential for a growth wave targeting 75.15, potentially extending up to 80.00. The MACD indicator supports the bullish Brent outlook, with its signal line below zero but pointing upwards.
H1 chart: Brent has found support at 71.55, initiating a growth wave towards 73.33. Upon reaching this level, a compact consolidation range might form. A breakout above this range could lead to a rise towards 75.15. This potential growth trajectory is corroborated by the Stochastic oscillator, with its signal line currently above 50 and trending towards 80.
Gold Could See Further Weakness
- Gold remains below 50-day SMA
- MACD and RSI mirror the market's waning momentum
Gold prices have been developing with weak momentum over the past few sessions, hovering beneath the 50-day simple moving average (SMA) and the 2,605 support level. The pair remains well above the medium-term ascending trend line, but the technical oscillators are mirroring the sideways move in the market. The RSI is standing marginally beneath the neutral threshold of 50, while the MACD is standing above its trigger line but still below the zero level.
If the price successfully breaks the 2,720 barrier and overcomes the 50-day SMA at 2,605, it could potentially reach the 2,750 area. Should traders continue to buy the commodity above that peak, resistance could then run toward the all-time high of 2,790.
A reversal to the downside, however, could find immediate support at the 2,605 hurdle, while a slightly lower diagonal line at 2,580 could also come into view. If the diagonal line fails to halt bearish movements, the next target could be the previous trough of 2,531, increasing the likelihood of steeper bearish corrections.
Turning to medium-term trading, the outlook is still positive, despite the recent weakness. On the other hand, a significant decline below the 200-day SMA, currently at 2,440, may switch the outlook to bearish.

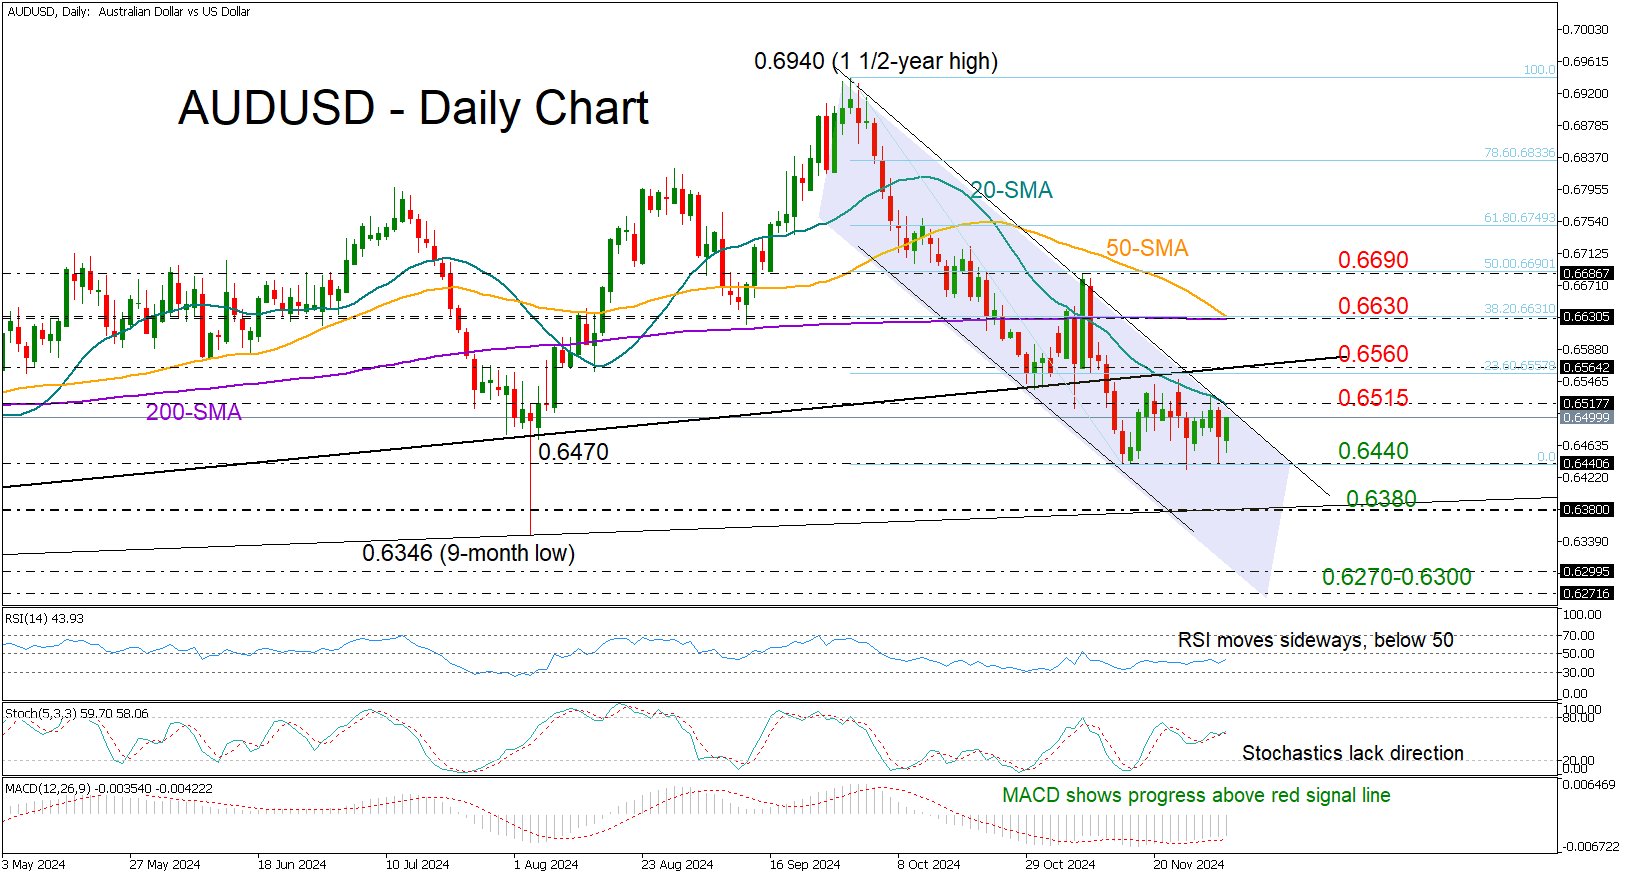
AUDUSD Trapped in a Bearish Formation
- AUDUSD struggles below 20-SMA; trend signals are discouraging
- AZ Q3 GDP could be a market mover on Wednesday at 00:30 GMT
AUDUSD kicked off the week on a weak note, failing to break above its 20-day simple moving average (SMA) for the second time, with losses capped near its recent low of around 0.6440.
The pair is consolidating at the bottom of a two-month downtrend, and a bearish breakout remains possible as the 50-day and 200-day SMAs form a "death cross."
The technical signals, however, are mixed. Hence, traders may stay on the sidelines until they see a decisive close above 0.6515 or below 0.6440. If the bearish scenario plays out, immediate support could come from the 2022 support trendline at 0.6380, a break of which could squeeze the price toward the 0.6270-0.6300 constraining zone.
In the bullish case that the pair accelerates above 0.6515, resistance could instantly occur near the former support trendline from 2023 at 0.6560. A successful move higher could target the 50- and 200-day SMAs at 0.6630 and then November’s high around 0.6690. Additional gains from there would signal a bullish trend reversal in the short-term picture.
In brief, AUDUSD remains exposed to downside risks as its ongoing consolidation phase is developing within a bearish formation. A clear step below 0.6440 could motivate more selling, particularly if the 0.6380 support cracks too.
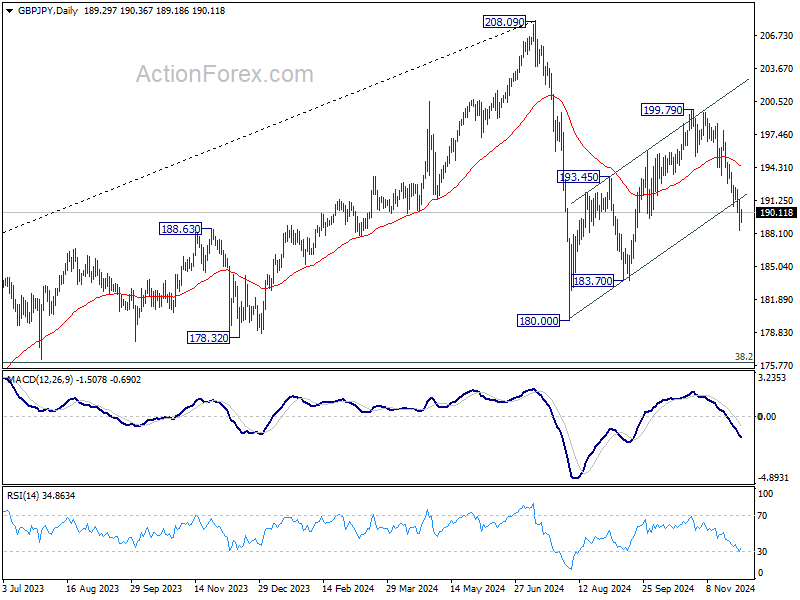
GBP/JPY Daily Outlook
Daily Pivots: (S1) 188.07; (P) 189.68; (R1) 190.89; More...
GBP/JPY's fall from 199.79 is in progress and intraday bias stays on the downside for 183.70 support. Break there will bring retest of 180.00 low. On the upside, above 191.27 minor resistance will turn intraday bias neutral first. But risk will now stay on the downside as long as 55 D EMA (now at 194.37) holds, in case of recovery.
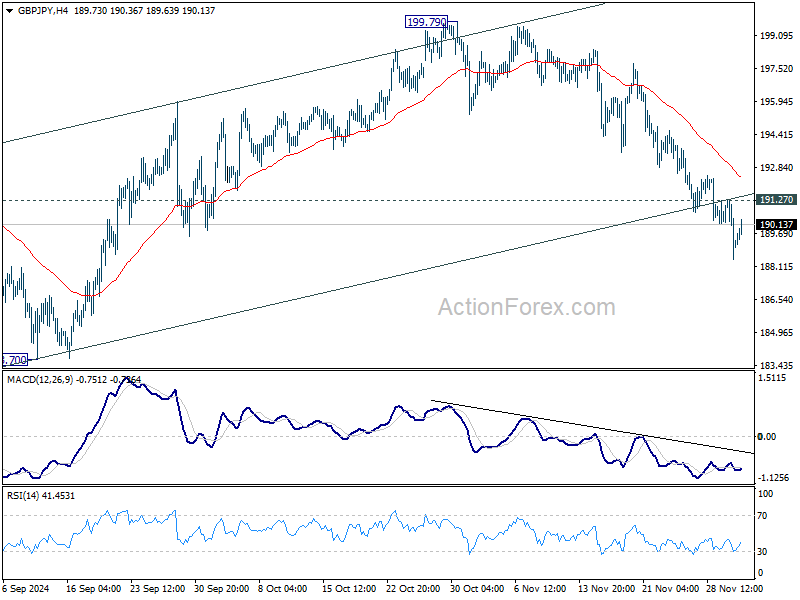
In the bigger picture, price actions from 208.09 are seen as a correction to whole rally from 123.94 (2020 low). The range of consolidation should be set between 38.2% retracement of 123.94 to 208.09 at 175.94 and 208.09. However, decisive break of 175.94 will argue that deeper correction is underway.
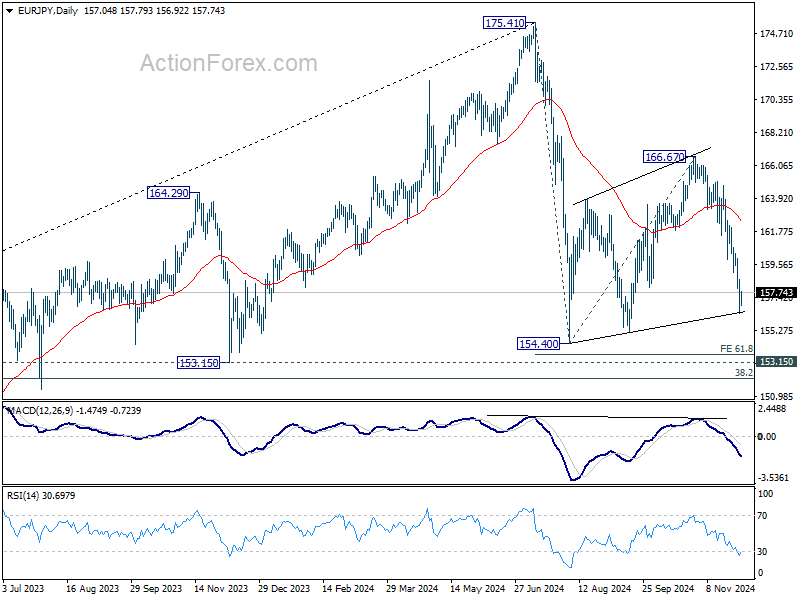
EUR/JPY Daily Outlook
Daily Pivots: (S1) 156.06; (P) 157.35; (R1) 158.32; More....
EUR/JPY's fall from 166.67 is still in progress and intraday bias remains on the downside for 155.14 support first. Firm break there will raise the chance that whole decline from 175.41 is resuming, and target 154.40 low next. On the upside, above 158.63 minor resistance will turn intraday bias neutral first.
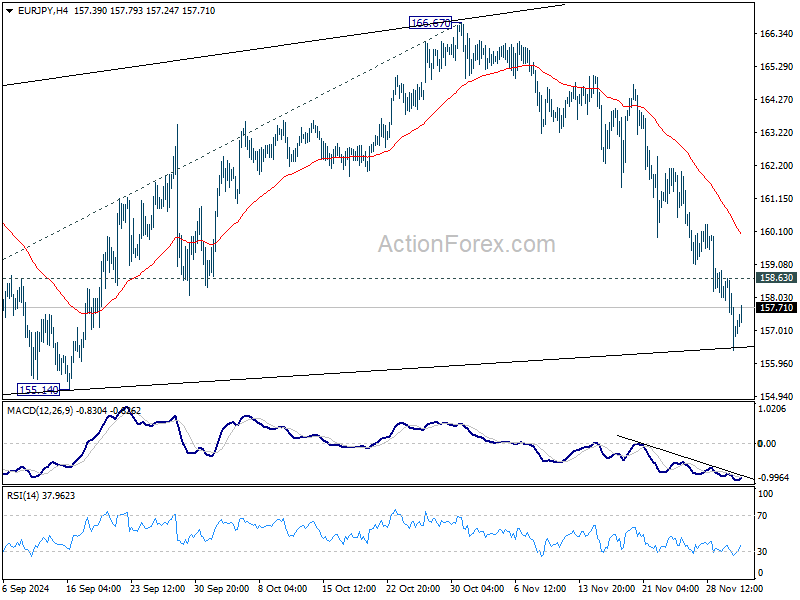
In the bigger picture, price actions from 175.41 are seen as correction to rally from 114.42 (2020 low). The range of consolidation should have been set between 38.2% retracement of 114.42 to 175.41 at 152.11 and 175.41 high. However, decisive break of 152.11 would argue that deeper correction is underway.
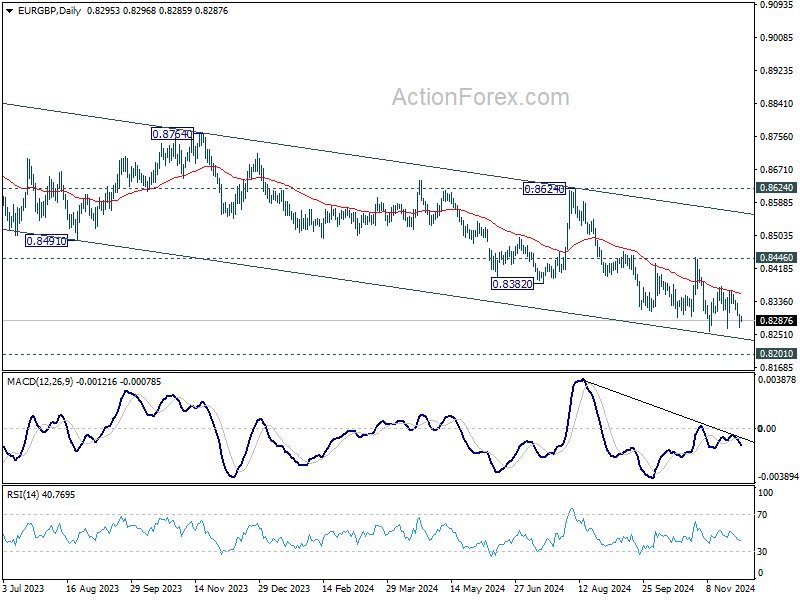
EUR/GBP Daily Outlook
Daily Pivots: (S1) 0.8273; (P) 0.8293; (R1) 0.8315; More...
EUR/GBP is staying in range above 0.8259 and intraday bias stays neutral. Further decline is expected with 0.8446 resistance intact. On the downside, decisive break of 0.8259 will resume larger down trend to 0.8201 key support.
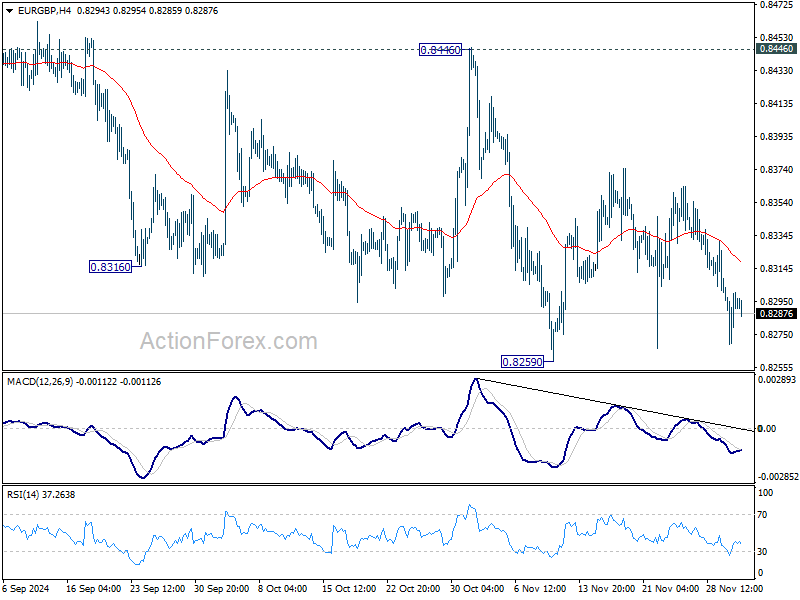
In the bigger picture, down trend from 0.9267 (2022 high) is in progress. Next target is 0.8201 (2022 low), but strong support should be seen there to bring rebound. However, outlook will remain bearish as long as 0.8624 resistance holds even in case of strong rebound. Decisive break of 0.8201 will indicate long term bearish reversal.