
Sample Category Title
AUDUSD Rangebound in Quiet Trading
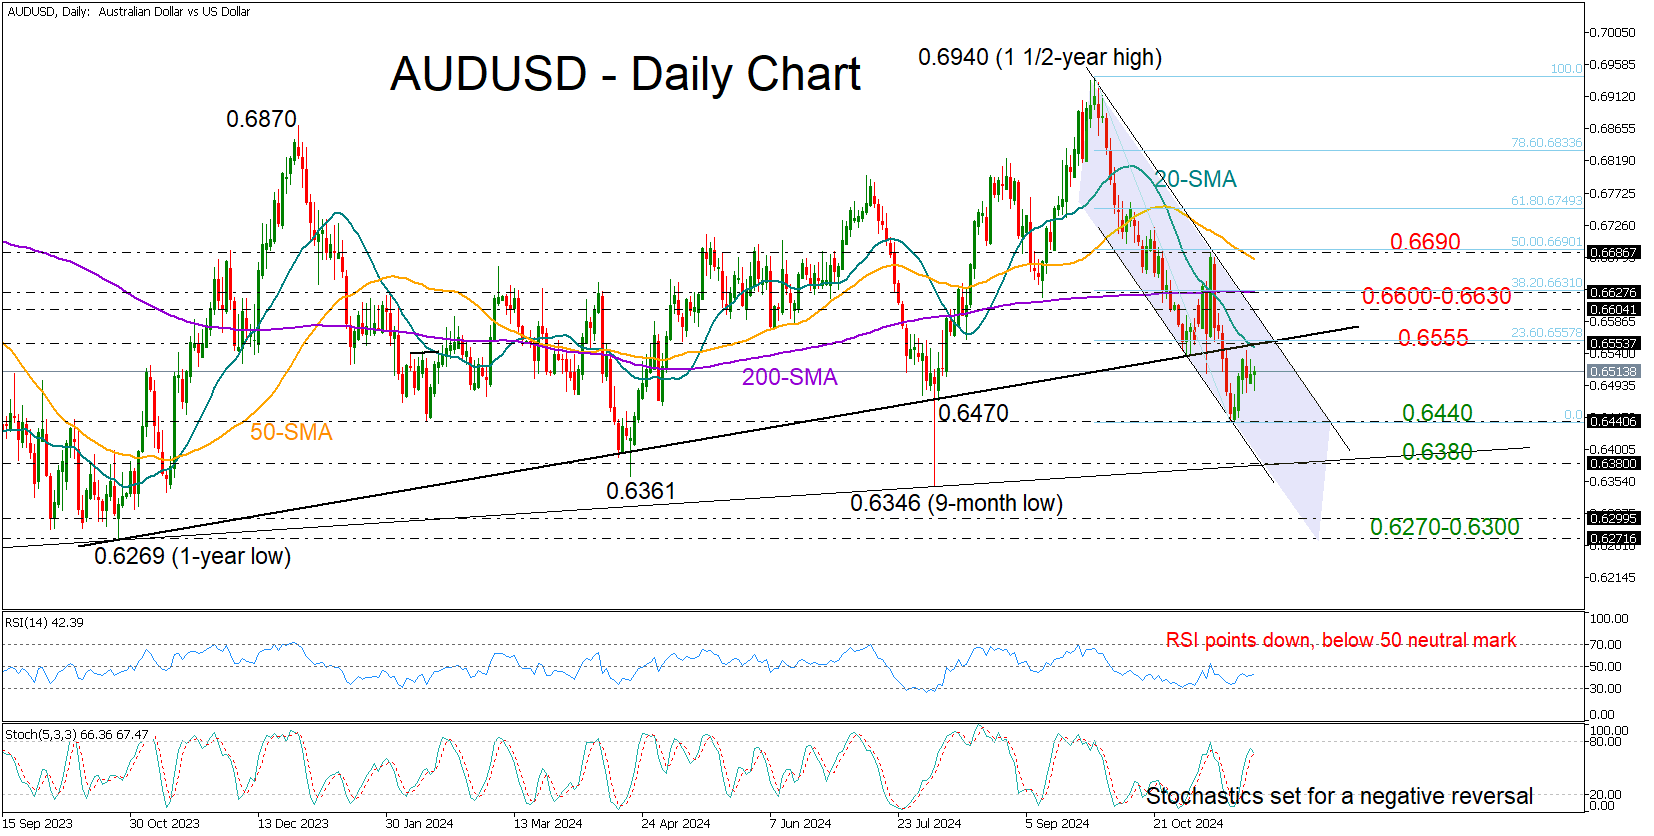
- AUDUSD holds steady within 0.6500 zone
- Technical picture remains gloomy below 0.6630
AUDUSD has largely ignored the swings in the US dollar this week, staying relatively stable within the 0.6500 area and slightly above its recent three-month low of 0.6439.
There is not much evidence of strong buying appetite at the moment as the RSI is pointing down in the bearish area below 50 and the stochastic oscillator is set for a negative reversal. Moreover, the short-term trend is clearly developing within a bearish channel and below the simple moving averages (SMAs), reflecting downbeat sentiment.
A move above the 20-day SMA and the former support trendline at 0.6555 could find immediate resistance at the upper band of the channel and the 38.2% Fibonacci retracement of the ongoing bearish trend, which also lines up with the flattening 200-day SMA. Even higher, the bulls may attempt to violate the negative trend above the previous high and the 50% Fibonacci of 0.6690.
Should sellers breach the 0.6440 base, the decline could stretch toward the critical support trendline which connects the lows from 2022 to 2024 seen at 0.6380. A close lower could spark an aggressive downfall toward the 0.6270-0.6300 base. If the bears claim that floor too, the focus will turn to the 2022 bottom of 0.6169.
In brief, AUDUSD is not in great shape despite staying resilient above its recent lows. A rebound above 0.6630 could help avoid a bearish continuation, whilst a break below 0.6380 could signal further downside in the long-term picture.
Eurozone PMI signals stagflation as both manufacturing and services contract
Eurozone economic activity weakened sharply in November, with PMI Manufacturing falling to 45.2 from 46.0 and PMI Services dropping to 49.2 from 51.6, pushing Composite PMI to a 10-month low of 48.1, down from 50.0. For the first time since January, both sectors recorded output declines, reflecting broader economic struggles.
Country-level data painted a bleak picture. France saw its Composite PMI drop to 44.8, with Manufacturing PMI at 43.2 and Services PMI at 45.7—both hitting 10-month lows. Germany's Composite PMI fell to 47.3, a 9-month low, with Services PMI sliding into contraction at 49.4 despite a slight improvement in Manufacturing PMI, which edged up to 43.2.
Cyrus de la Rubia of Hamburg Commercial Bank highlighted "stagflationary" conditions, with falling activity alongside rising input and output prices driven by service sector costs and wage growth. He pointed to political instability in France and Germany and global uncertainties, including potential US tariffs, as key contributors.
Elliott Wave View: GBPUSD is Approaching Support Zone
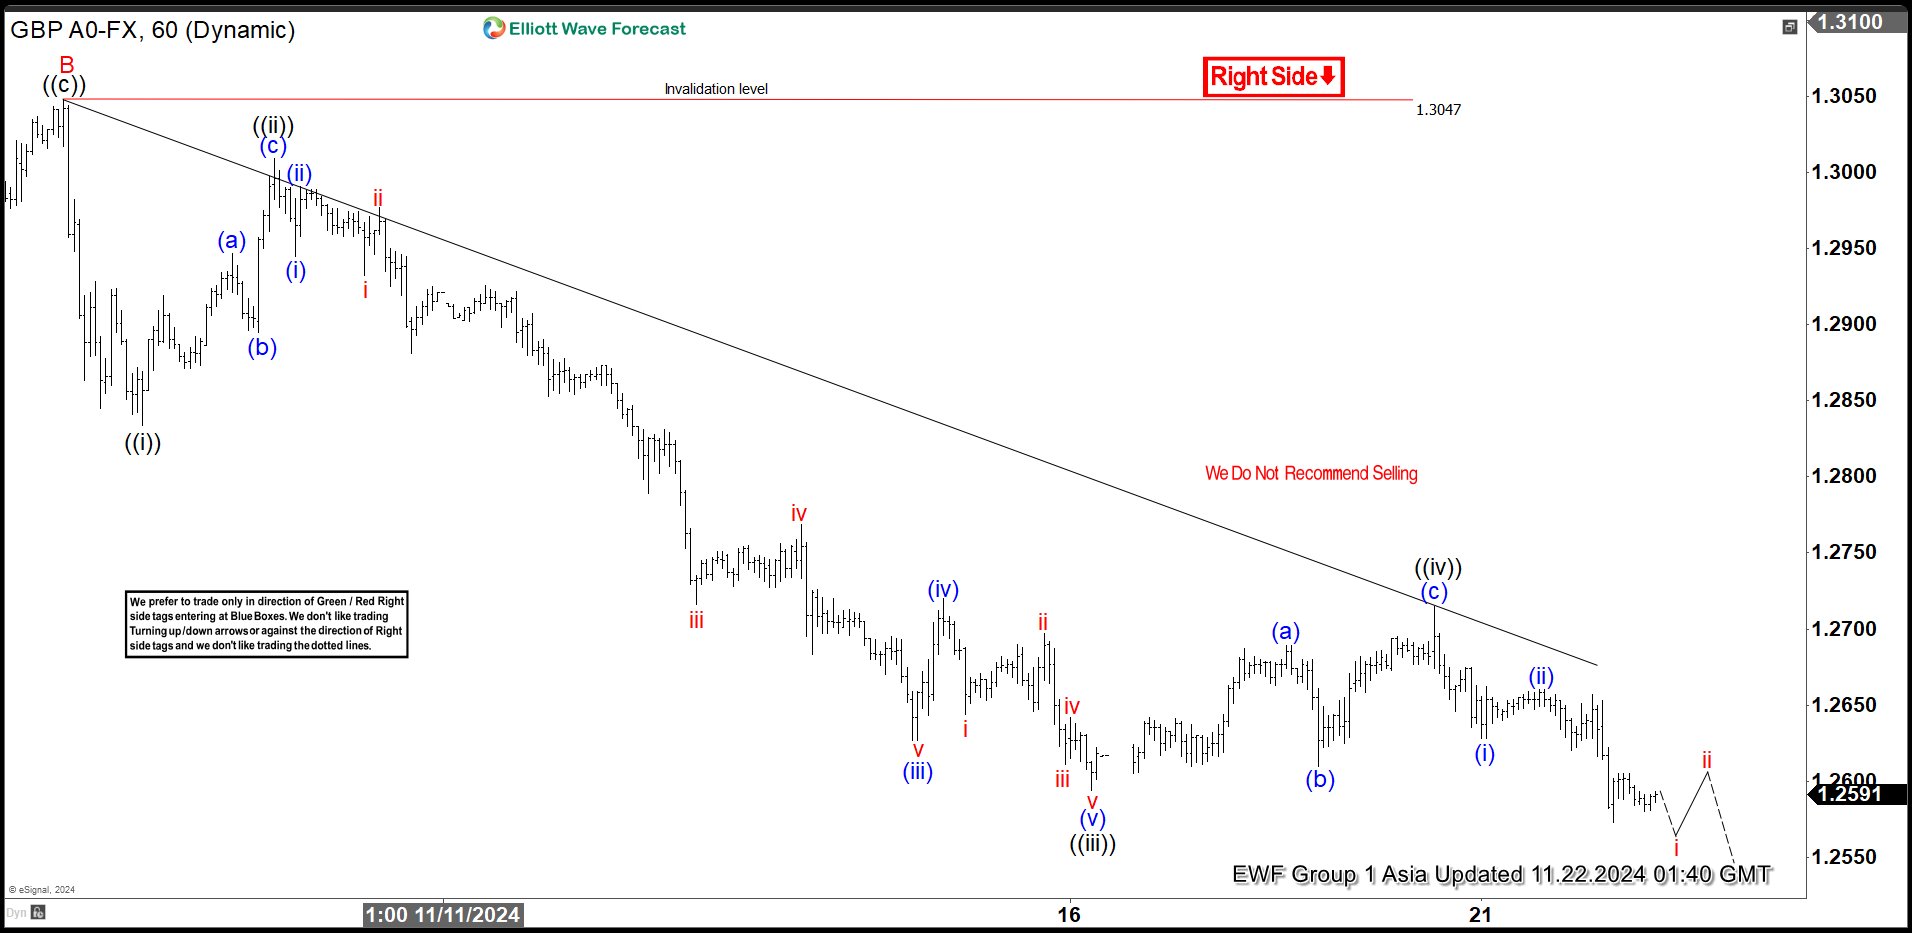
Short Term Elliott Wave View in GBPUSD suggests decline from 9.26.2024 high is in progress as a zigzag structure. Down from 9.26.2024 high, wave A ended at 1.284. Wave B bounce ended at 1.3047 as the 1 hour chart below shows. Wave C lower is now in progress with internal subdivision as a 5 waves impulse Elliott Wave structure. Down from wave B, wave ((i)) ended at 1.283 and wave ((ii)) ended at 1.3. Pair then resumed lower in wave ((iii)). Down from wave ((ii)), wave (i) ended at 1.294 and rally in wave (ii) ended at 1.3.
Pair resumed lower in wave (iii) towards 1.2627 and wave (iv) rally ended at 1.272. Wave (v) lower ended at 1.2594 which completed wave ((iii)) in higher degree. Rally in wave ((iv)) unfolded as a zigzag structure. Up from wave ((iii)), wave (a) ended at 1.2689 and pullback in wave (b) ended at 1.261. Wave (c) higher ended at 1.2715 which completed wave ((iv)) in higher degree. Wave ((v)) of C lower is now in progress with potential target 100% – 161.8% of wave A. This area comes at 1.208 – 1.245 where buyers can appear for 3 waves rally at least.
GBPUSD 60 Minutes Elliott Wave Chart
GBPUSD Elliott Wave Video
https://www.youtube.com/watch?v=Tq-QXQEYs_s
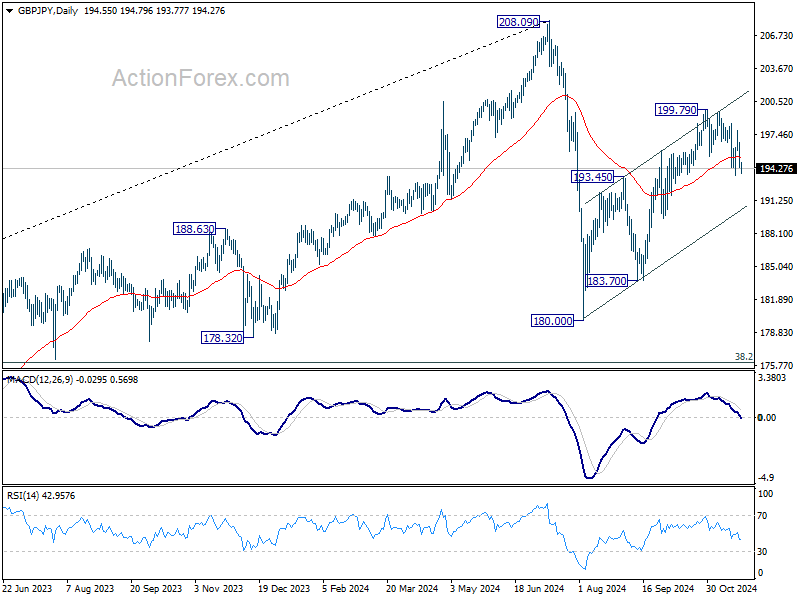
GBP/JPY Daily Outlook
Daily Pivots: (S1) 193.72; (P) 195.23; (R1) 196.09; More...
Intraday bias in GBP/JPY remains neutral at this point. On the upside, break of 199.79 will resume whole rebound from 180.00. However, firm break of 193.54 will extend the fall from 199.79 to 183.70 support instead.
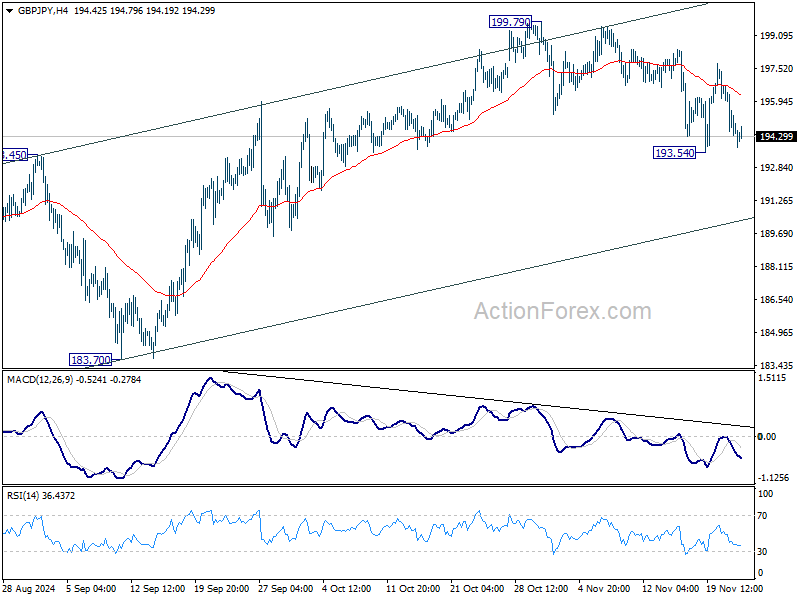
In the bigger picture, price actions from 208.09 are seen as a correction to whole rally from 123.94 (2020 low). The range of consolidation should be set between 38.2% retracement of 123.94 to 208.09 at 175.94 and 208.09. However, decisive break of 175.94 will argue that deeper correction is underway.
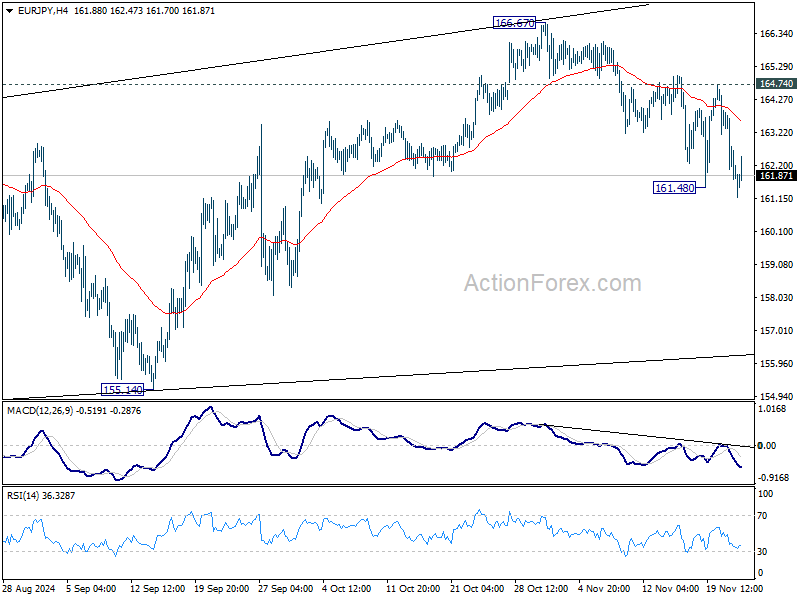
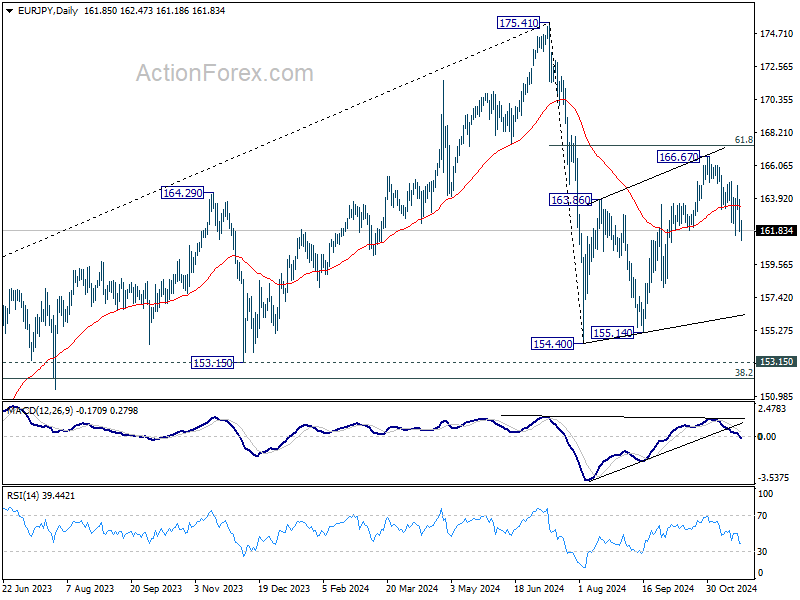
EUR/JPY Daily Outlook
Daily Pivots: (S1) 163.11; (P) 163.93; (R1) 164.71; More....
EUR/JPY's fall from 166.67 is resuming by breaching 161.48 temporary low. Intraday bias is back on the downside for 155.14 support. Corrective rebound from For now, risk will stay on the downside as long as 154.40 could have completed with three waves up to 166.67 already. Risk will now stay on the downside as long as 164.74 resistance holds, in case of recovery.
In the bigger picture, price actions from 175.41 are seen as correction to rally from 114.42 (2020 low). The range of consolidation should have been set between 38.2% retracement of 114.42 to 175.41 at 152.11 and 175.41 high. However, decisive break of 152.11 would argue that deeper correction is underway.
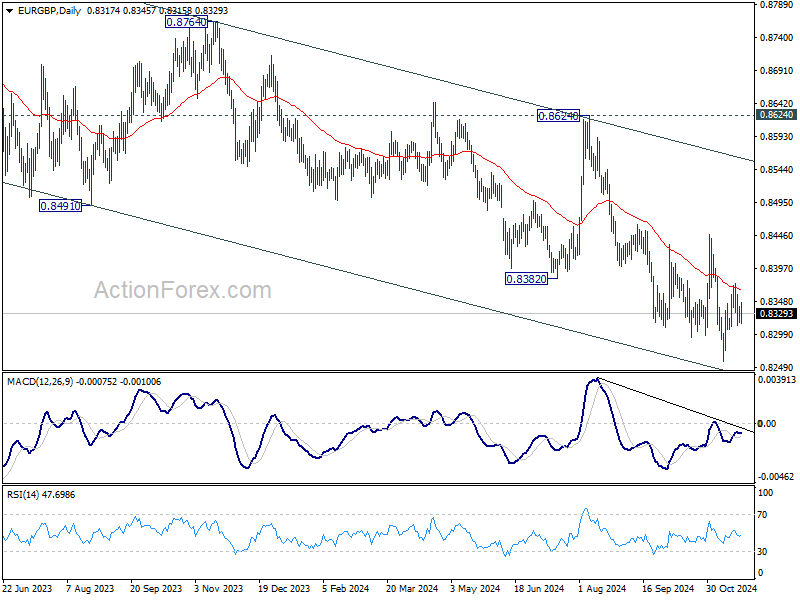
EUR/GBP Daily Outlook
Daily Pivots: (S1) 0.8311; (P) 0.8326; (R1) 0.8335; More...
Intraday bias in EUR/GBP remains neutral and outlook is unchanged. Further fall is expected with 0.8446 resistance intact. On the downside, below 0.8306 minor support will turn bias back to the downside for 0.8259 first, and then 0.8201 key support. Nevertheless, firm break of 0.8446 will confirm short term bottoming.
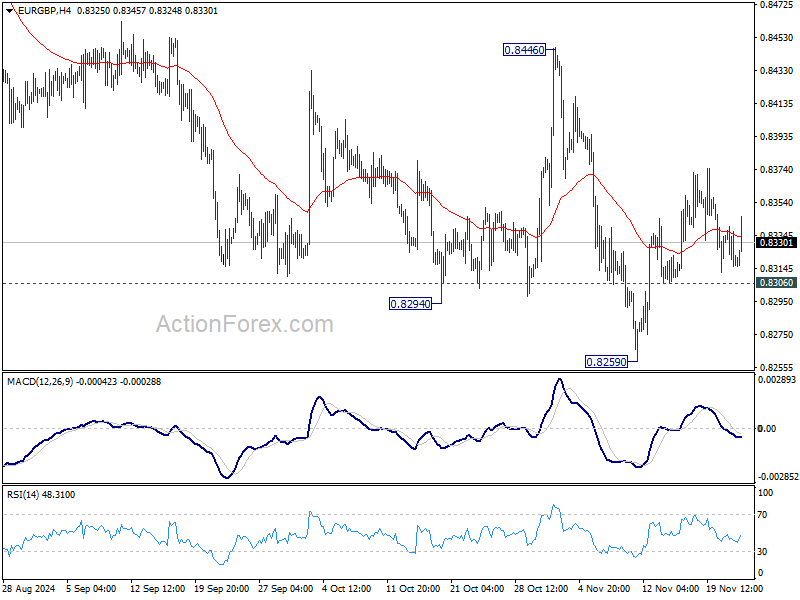
In the bigger picture, down trend from 0.9267 (2022 high) is in progress. Next target is 0.8201 (2022 low), but strong support should be seen there to bring rebound. However, outlook will remain bearish as long as 0.8624 resistance holds even in case of strong rebound. Decisive break of 0.8201 will indicate long term bearish reversal.
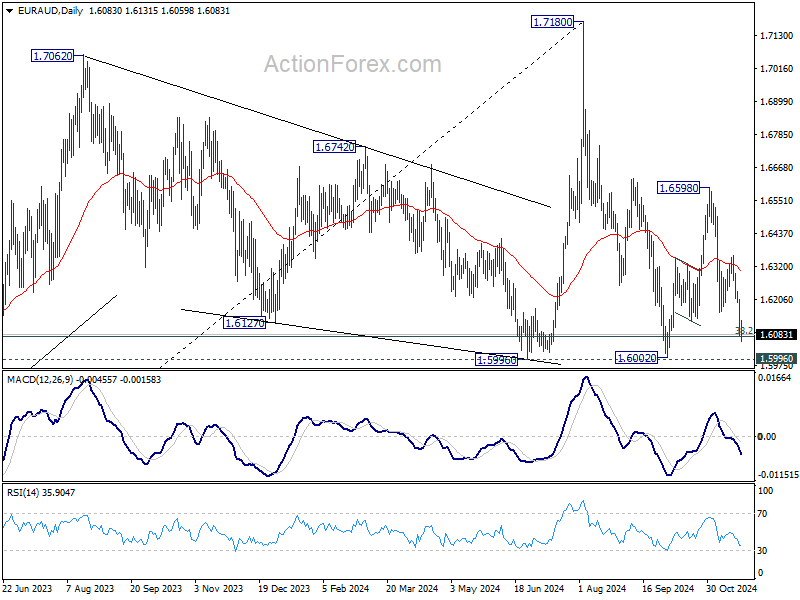
EUR/AUD Daily Outlook
Daily Pivots: (S1) 1.6041; (P) 1.6127; (R1) 1.6172; More...
Intraday bias in EUR/AUD stays on the downside, and fall from 1.6598 is in progress for 1.5996/6002 key support zone. Decisive break there will carry larger bearish implications. On the upside, above 1.6161 support turned resistance will turn intraday bias neutral first. But, risk will stay on the downside as long as 1.6359 resistance holds, in case of recovery.
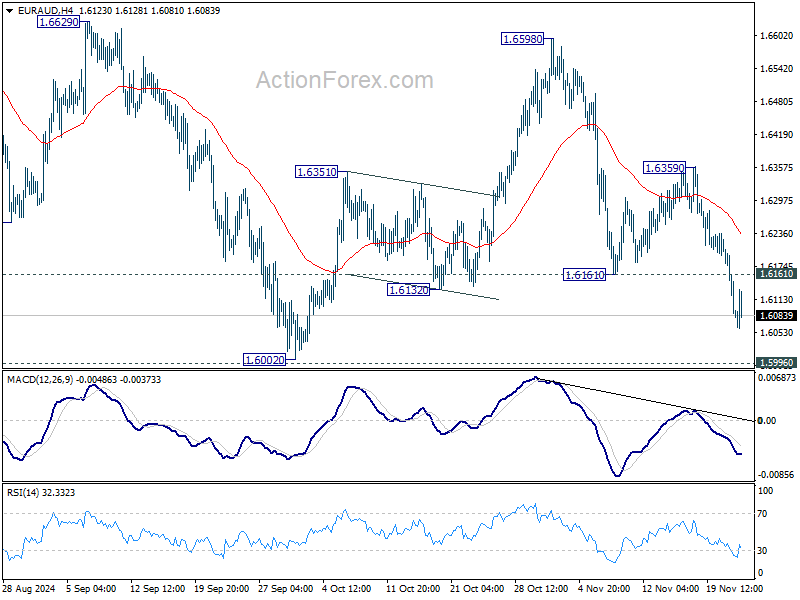
In the bigger picture, as long as 1.5996 support holds, up trend from 1.4281 (2022 low) is still expected to resume through 1.7180 at a later stage. However decisive break of 1.5996 will argue that the medium term trend might have reversed. Deeper fall would be seen to 61.8% retracement of 1.4281 (2022 low) to 1.7180 at 1.5388, even as a correction.
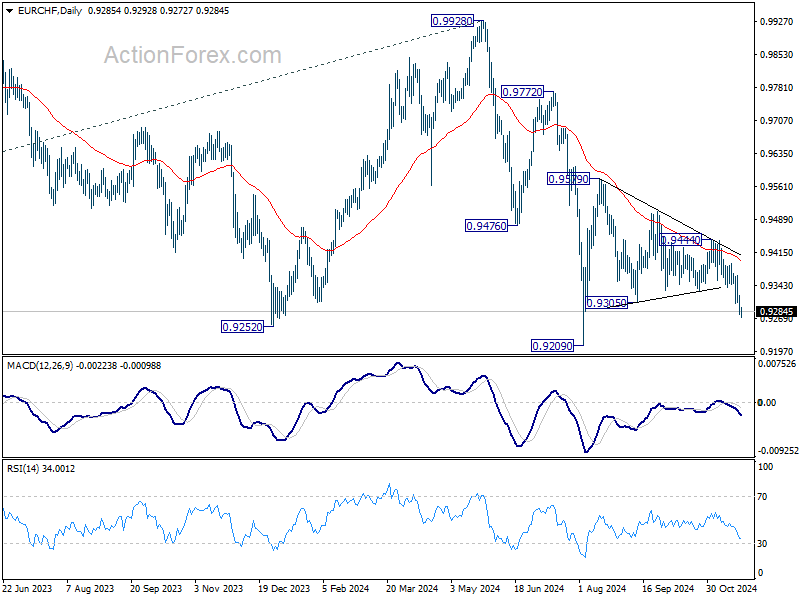
EUR/CHF Daily Outlook
Daily Pivots: (S1) 0.9270; (P) 0.9297; (R1) 0.9314; More....
EUR/CHF's fall resumed through 0.9303 temporary low and intraday bias is back on the downside. Further fall should now be seen to retest 0.9209 low next. On the upside, above 0.9310 minor resistance will turn intraday bias neutral again first.
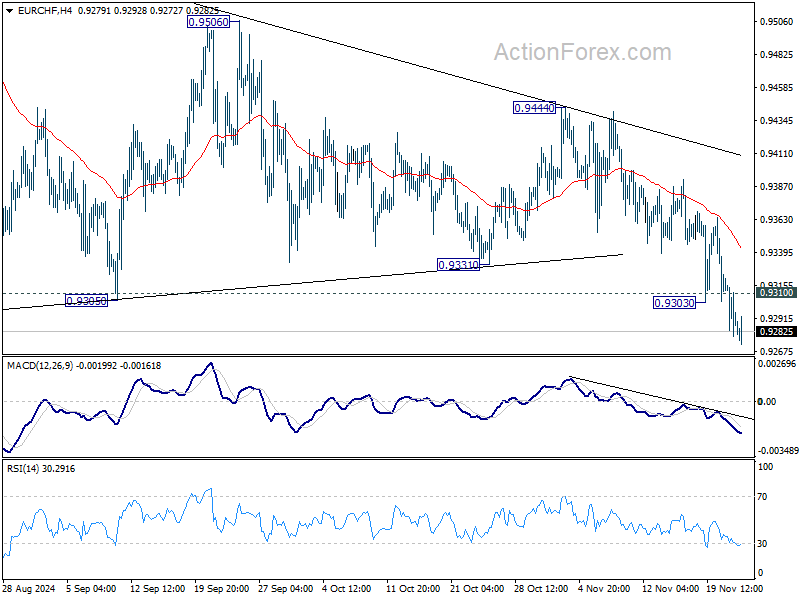
In the bigger picture, fall from 0.9928 is seen as part of the long term down trend. Repeated rejection by 55 D EMA (now at 0.9395) keeps outlook bearish for breaking through 0.9209 low at a later stage. Nevertheless, sustained trading above 55 D EMA will confirm medium term bottoming at 0.9209 and bring stronger rebound back towards 0.9928 key resistance.
Rising Geopolitical Tensions Will Likely Limit Any Rebound Potential for the Single Currency
Markets
This week’s consolidation pattern on bond markets simply continued yesterday. Lower weekly jobless claims (213k) and a disappointing November Philly Fed Business outlook balanced each other out data wise. US yields added 3.3 bps (2-yr) to 0.4 bps (30-yr) in another small bear flattening move with money markets reducing the likelihood of a December 25 bps rate cut to 55%. Our base scenario remains that the Fed will go ahead with a rate cut. If data permit, they can skip in January, allowing the FOMC to get a better view on the interplay with a likely stimulating fiscal policy under president-elect Trump by the time of new growth and inflation forecasts in March. German yields dropped by 1.1 bp to 3.6 bps with the belly of the curve outperforming the wings. The (European) proximity to this week’s escalating war between Russia and Ukraine directs some haven flows into Bunds. European stock markets eventually managed to recover from early losses induced by talk that Russia launched a first ever intermediate-range ballistic missile. The euro extends its losses, with EUR/USD giving up 1.05 against an overall strong USD. The pair is on track to test the 2023-2024 sideways range bottom at 1.0448. The trade-weighted dollar is equally inches away from the 2023 high at 107.35. Only the Japanese yen manages to more or less keep pace with the greenback in such conditions, changing hands at USD/JPY 155.
Today’s eco calendar contains November global PMI’s. Rising geopolitical tensions will likely limit any rebound potential for the single currency going into the weekend even in case of firmer European numbers. Consensus expects a stabilization at the 50 breakeven level for the EMU composite gauge. Anything bar a huge negative surprise will also convince final traders out of there 50 bps December rate cut bets by the ECB (15% probability) as all other intermeeting data (Q3 GDP, October CPI & PMI, Q3 wages) all surprised on the upside. In the US, asymmetric risks are on the other side given that we think markets are underestimating the likelihood of a Fed December move.
News & Views
Japanese inflation eased but remained above the Bank of Japan’s 2% target in October. Headline price increases decelerated from 2.5% to 2.3% and the gauge excluding fresh food (the BoJ’s preferred gauge) came in at 2.3% as well. The latter was down from 2.4% but above 2.2% expectations. Core CPI (ex. fresh food and energy) picked up from 2.1% to 2.3%, suggesting energy was a key factor behind the slight slowdown. Utility subsidies indeed shaved off about 0.5 ppts of the overall index. Service prices gained momentum, quickening from 1.3% to 1.5%, adding to evidence that consumer-led inflation is becoming more entrenched in the economy. That should bring comfort to the Bank of Japan, which is looking for signs its (underlying) inflation outlook is materializing, a key condition to further normalize its monetary policy. The next December meeting is a live one with money markets slightly in favour (56%) of a 25 bps rate hike to 0.5%. The Japanese yen fails to profit this morning against an overall stronger USD. USD/JPY hovers just south of 155. This level serves as a short-term equilibrium level since the dollar (and rate) rally stalled and geopolitical risk-off kicked in, supporting JPY.
UK consumers turned a bit less sour in November. The GfK confidence index edged up from -21 to -18, defying forecasts for a further drop to -22. GfK said that nervousness ahead of the first Labour budget and US elections appear to have passed. The survey was taken between October 30 and November 15. Consumers felt some relieve that Labour’s planned tax increases mostly fell on businesses rather than individuals. All components posted improvements with the biggest taking place in the perceived climate for major purchases (-21 to -16). Consumer’s personal finances as well as the economic situation, both over the past and next 12 months, all gained from the previous month too. GfK does note that consumers still feel acute cost-of-living pressures and urged the government to deliver on their promises to tackle the matter.
Oil, Gas Prices Up on Escalating Tensions with Russia
Moodiness due to a lack of a strong post-earnings rally from Nvidia remained short-lived. Investors rapidly shrugged off the company’s warning that the profit margin will dip to 73% on manufacturing challenges of the Blackwell chips, and thought they could cope with that small deterioration. The shares fell well short of the 8-10% rally that the market was prepared for, and posted a meagre 0.53% rise post earnings. But nevertheless, the stock hit a fresh ATH even though the move was far less than impressive. Nvidia couldn’t offer the major US indices a fresh record, as Big Tech companies were mostly sold yesterday. Google lost 4.5% on Department of Justice’s demand to sell Chrome. But both the S&P 500 and Nasdaq gained the day after the Nvidia earnings, and consolidate near ATH levels.
The earnings season gently comes to an end with a stronger-than-expected performance for most of the S&P500 stocks. 8 of the 11 sectors in the index posted earnings growth, showcasing broad resilience despite macroeconomic challenges. Energy companies continued to face challenges due to weak oil prices but Big Tech has been a standout and the overall earnings proved better than the market expectations. The numbers didn’t point at any type of economic distress in the US and maintained the soft-landing narrative – also supported by broader macroeconomic data – well alive.
Of course, the strong economic growth is certainly good for business, but strong business is not necessarily good for taming inflation. Add to that Trump’s plans to cut taxes and impose tariffs on China and other partners, the inflation outlook doesn’t look supportive of sustained rate cuts from the Federal Reserve (Fed). As such, the US yields continue to feel the pressure of uncertainty regarding what the Fed should do in its December meeting. The probability of a December cut improved to 60% as the continuing claims in the US rose to a 3-year high, but the decision is more close to call than many think, imo.
In the FX, the US dollar is extending its rally, not necessarily on Fed expectations but on a fair amount of safe haven demand amid the mounting geopolitical tensions in Ukraine. The latest news suggest that Russia launched ‘a new kind of ballistic missile in to Ukraine’ as a response to Ukraine’s use of US missiles on Russia earlier this week. The latest escalation results in fresh sanctions against Gazprombank, which was the last major Russian financial institution that wasn’t concerned by the earlier sanctions as some European nations continued to pay their gas purchases from Russia via Gazprombank. They can’t anymore.
Even though Europe has a reduced exposure to Russia, cutting whatever was left of the Russian gas supplies will reduce the amount of supplies on the continent and threaten to boost gas prices as reserves decline. The European gas futures show an accelerated rally this week, while the US gas futures are exploding on the news. US nat gas broke above the summer peak, and this time, has probably taken out the $3 support sustainably. The upside pressure won’t be comparable to what we saw in the early days of the Ukrainian war, but the tense geopolitical environment has the potential to push prices toward the 3.50-3.60 range -the January peak.
Elsewhere in energy, the mounting geopolitical tensions give a hand to oil bulls. The barrel of US crude has stepped above the $70pb level, but faces a thick layer of offers between the $70 and 73pb range. The combination of weak global demand and ample supply keeps the macro-focused bears in appetite near these levels. But, the environment turns positive for tactical longs and US energy companies that will see the additional opportunity to increase their market share in Europe.
In the FX, the US dollar’s recent rise pushed the EURUSD down the 1.05 cliff yesterday, and Cable extended losses below the 1.26 mark. Investors will watch the flash PMI figures this morning to figure out how to rectify their euro and sterling positions, but the major driver of the market right now will likely remain the haven flows that favour the greenback against major peers. This being said, the solid appreciation of the US dollar, combined to rising energy prices, will likely ring the alarm bell among the European Central Bank (ECB) and the Bank of England (BoE) doves, and get them to tame their dovish expectations. The latter will probably support a recovery in both the euro and sterling once the geopolitical dusts settle.