Sample Category Title
Gold (XAU/USD) Rises Slow and Steady: In-Depth Technical Analysis
After yesterday's sharp rally in alternative precious metals, with Copper, Platinum, and Silver all surging as Chinese inflation reached a 45-month high, the strong upward momentum has now eased.
However, precious commodities traders were caught off guard by this morning's higher-than-expected US inflation report.
As the US Dollar surged in response to the hawkish CPI data, traditional risk assets and alternative metals pulled back.
Still, the metals complex is holding strong relative to the tech-heavy Nasdaq and the broader cryptocurrency market, which are seeing much sharper declines today.
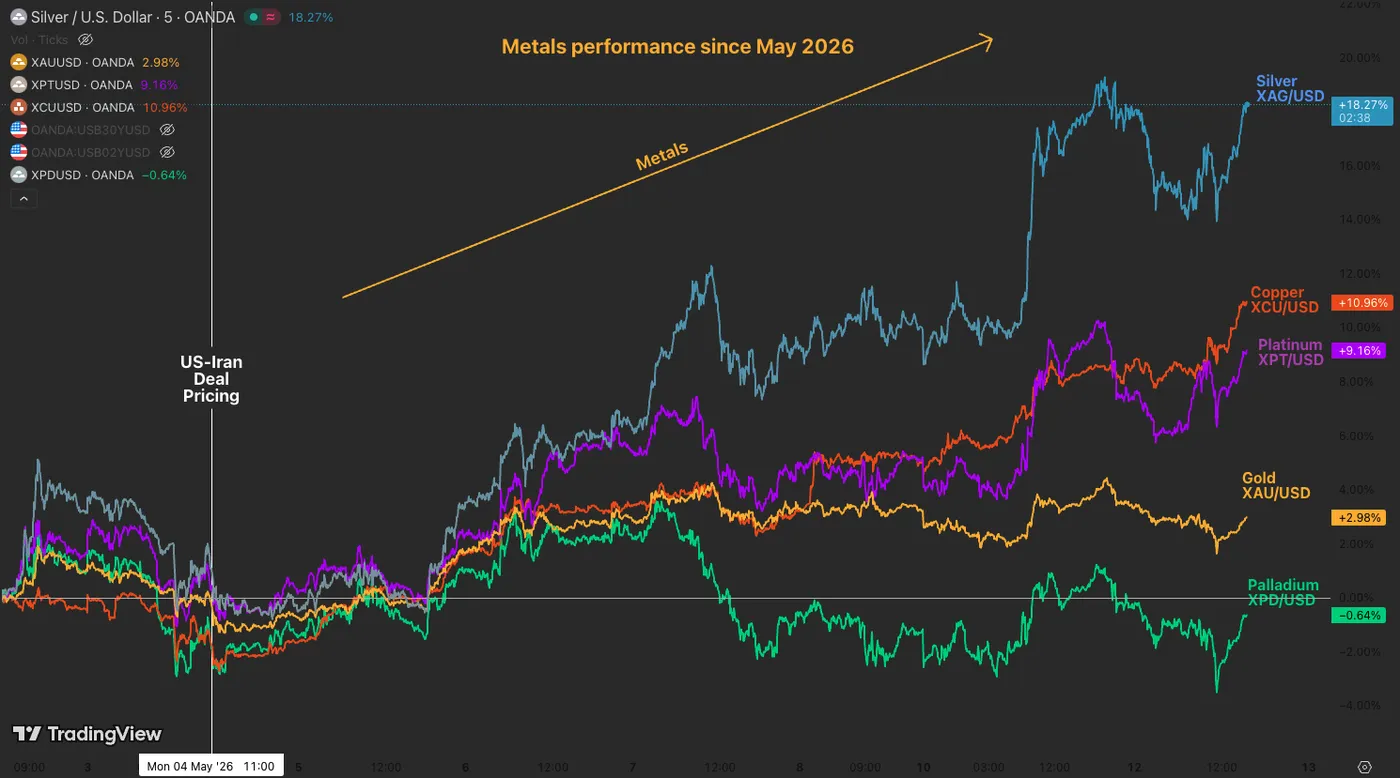
Metals performance since the beginning of May 2026. Source: TradingView, May 12, 2026.
Broad financial markets are now essentially frozen in a state of suspended animation following the CPI release. Participants' eyes are firmly turning toward the monumental Trump-Xi diplomatic summit scheduled over the next three days.
This high-stakes meeting between the world's two largest economic superpowers is virtually guaranteed to rock global investor appetite and set the directional tone for the remainder of the quarter. Metals will not be isolated from such dynamics.
Despite the current economic and geopolitical uncertainty, Gold has stayed relatively quiet. The metal is consolidating within its wide $4,500 to $4,900 range.
By holding steady and absorbing market volatility, Gold is building a solid technical foundation for a possible longer-term rally.
Importantly, Gold has stayed resilient even with recent hawkish data and the fast-paced rise in crude oil prices. This ongoing relative strength suggests that the fundamental outlook for this safe-haven asset may be changing in the near future.
Traders should expect massive, headline-driven volatility in the very near term across markets and the yellow metal. The ultimate question is which direction this historic consolidation will finally break.
Let's dive right into a multi-timeframe analysis of Gold (XAU/USD) to look at where the action could head for the rest of the week, if not weeks.
Gold (XAU/USD) Multi-Timeframe Technical Analysis
Weekly Chart
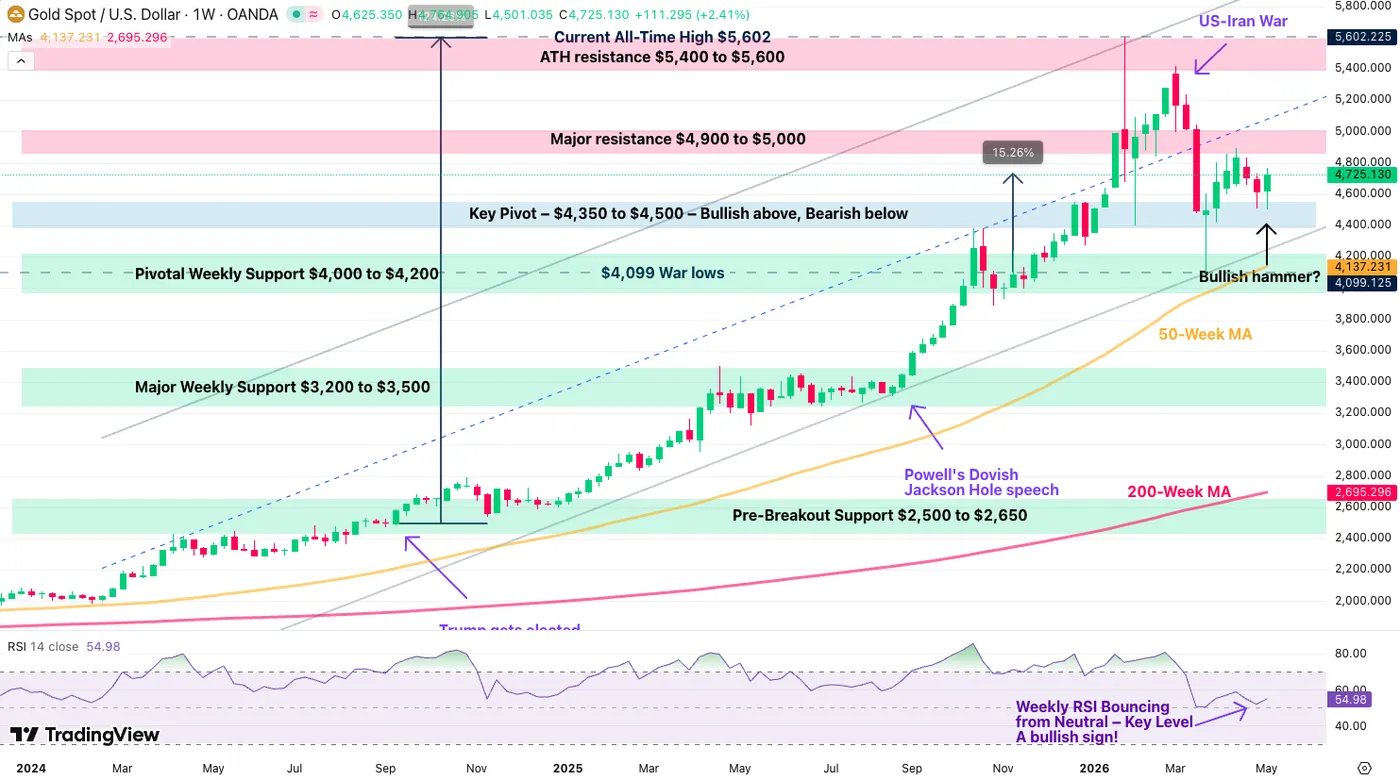
Gold weekly chart, May 12, 2026. Source: TradingView.
Gold has been forming the basis for decent support between $4,500 and $4,900, helping the previously bearish momentum turn neutral.
Having failed to push for further downside, bulls are slowly regaining the advantage, with the weekly RSI slowly turning bullish since the beginning of the month.
This week's candle, still forming, is for now looking like a bullish hammer.
4H Chart and Technical Levels
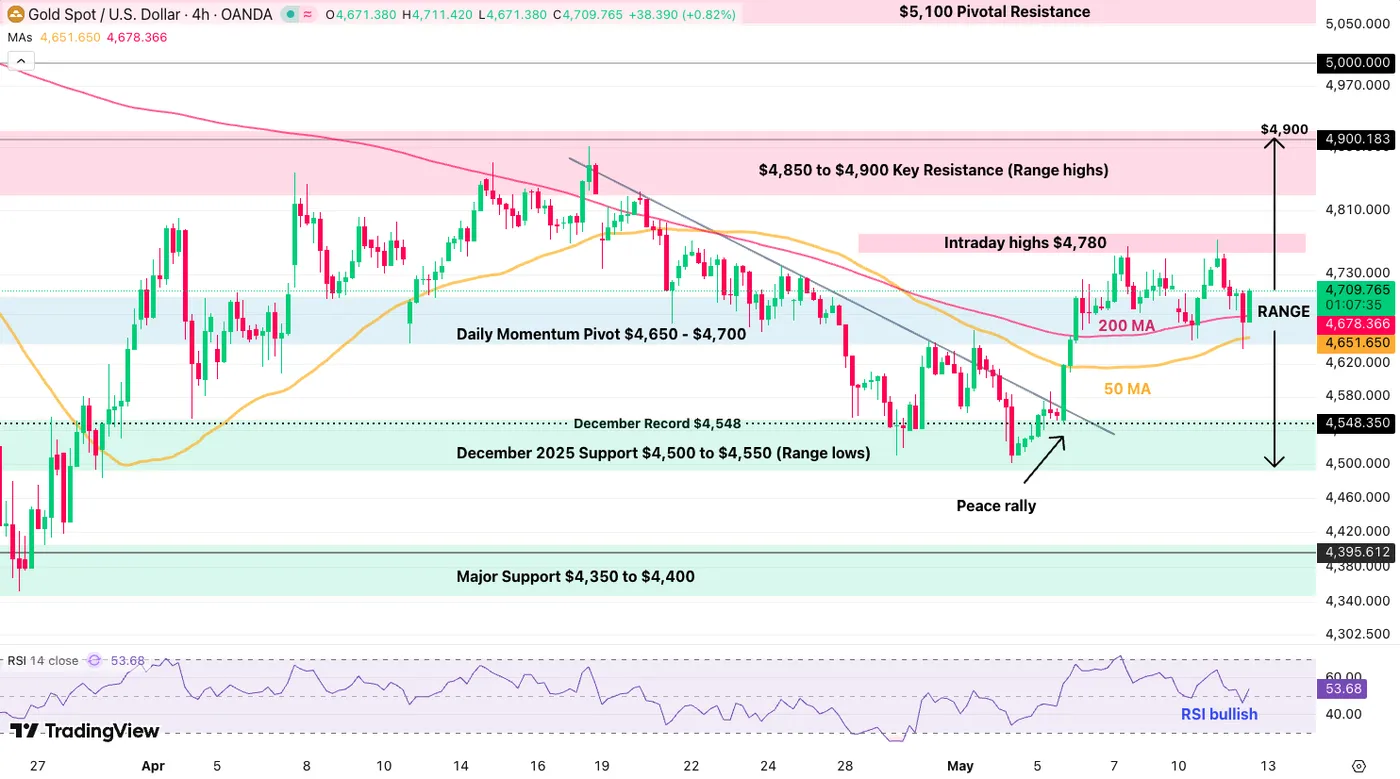
Gold 4H chart, May 12, 2026. Source: TradingView.
After a bearish reaction to the morning US inflation numbers, some mean reversion buying is pushing Gold back above the previous candle, forming a bullish engulfing pattern.
Buyers will want to pursue this bullish momentum to push above the $4,780 weekly highs.
Levels to watch for Gold (XAU/USD) trading:
Resistance Levels:
- Intraday highs: $4,780
- $4,850 to $4,900 key resistance, range highs
- $5,100 pivotal resistance
- Gold all-time high record: $5,602
Support Levels:
- Daily momentum pivot: $4,650 to $4,700
- December 2025 support: $4,500 to $4,550, range lows
- Major support: $4,350 to $4,400
- War lows: $4,101
1H Chart
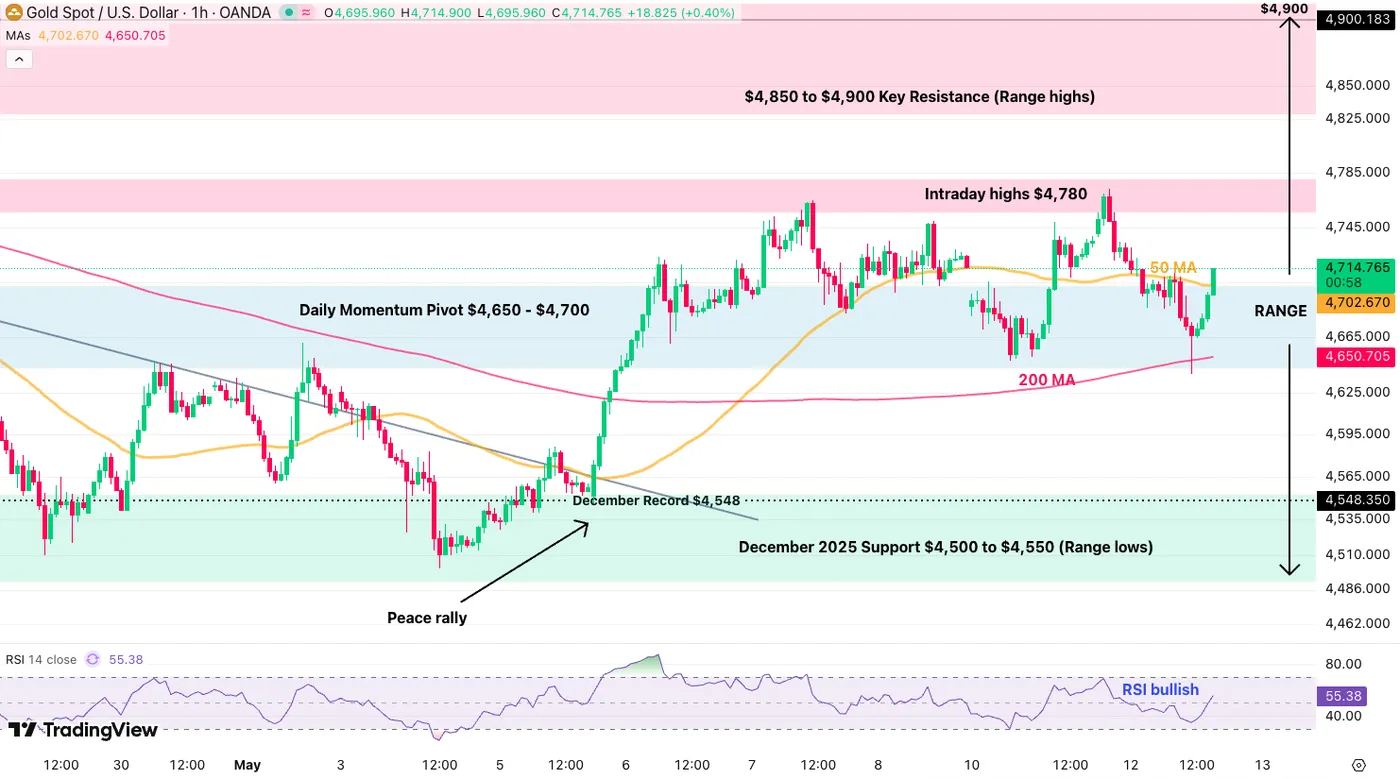
Gold 1H chart, May 12, 2026. Source: TradingView.
The yellow metal is extending higher towards the end of the session, back above the $4,700 level and the 50-hour MA.
Bulls will need to expand their strength above the intraday level to extend further. Below $4,650, the 200-hour MA, the action may get more bearish towards the bottom of the range.
Safe trades.
Elliott Wave Analysis: Nasdaq Futures (NQ_F) Cycle Ending, Correction Ahead
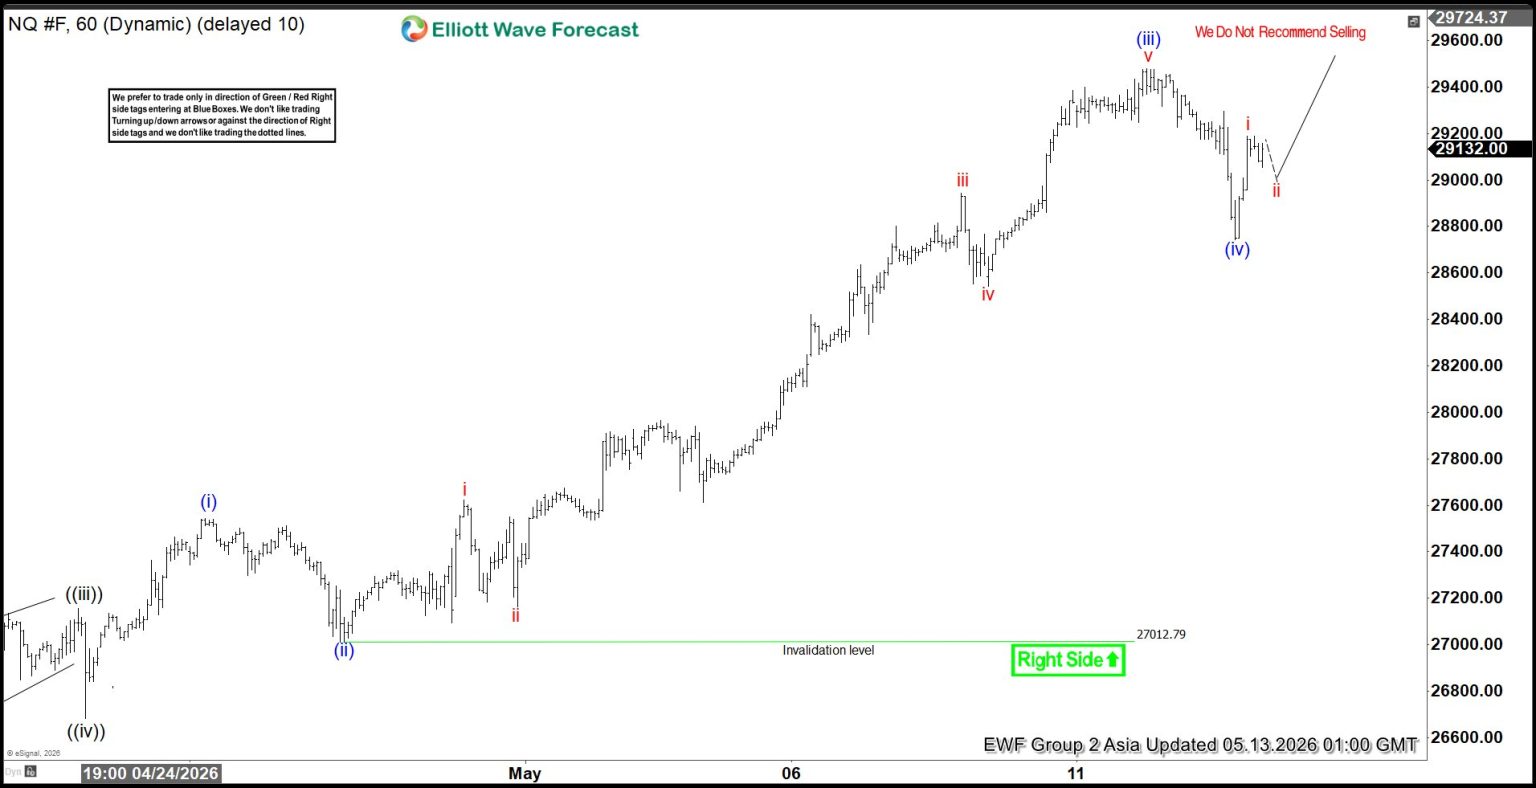
Short‑term Elliott Wave analysis indicates that the cycle in Nasdaq Futures (NQ) from the March 31, 2026 low is approaching completion as a five‑wave impulse. From that low, wave ((i)) concluded at 24,348.25, followed by a corrective pullback in wave ((ii)) that ended at 23,666. The Index then advanced in wave ((iii)) toward 27,136, while the subsequent dip in wave ((iv)) found support at 26,681.75, as reflected in the one‑hour chart. The final leg, wave ((v)), is now unfolding with internal subdivisions forming another impulse of lesser degree.
From wave ((iv)), wave (i) finished at 27,542.5, and the pullback in wave (ii) ended at 27,009.5. The rally continued with wave (iii) reaching 29,480, before wave (iv) corrected to 28,742. The Index is now progressing in wave (v), which should complete wave ((v)) of 1. This development will also mark the conclusion of the cycle that began on March 31, 2026. Once wave 1 is complete, a corrective phase in wave 2 is expected. That correction should unfold in a larger degree, either as a three‑swing or seven‑swing structure, before the broader trend resumes higher.
In the near term, as long as price remains above 27,012.79, the Index retains scope for one more push upward. However, the cycle has matured considerably, and the risk of chasing the upside has increased. Traders should recognize that while limited extension remains possible, the probability of a corrective pullback is rising. The structure suggests caution, as the market is transitioning from an impulsive phase into a corrective environment.
Nasdaq Futures (NQ_F) 60-Minute Elliott Wave Chart
NQ_F Elliott Wave Video:
https://www.youtube.com/watch?v=fpO8Hih-H68
Eco Data 5/13/26
| GMT | Ccy | Events | Act | Cons | Prev | Rev |
|---|---|---|---|---|---|---|
| 23:50 | JPY | Bank Lending Y/Y Apr | 5.40% | 4.60% | 4.80% | |
| 23:50 | JPY | Current Account (JPY) Mar | 3.90T | 2.93T | 2.71T | 2.70T |
| 01:30 | AUD | Wage Price Index Q/Q Q1 | 0.80% | 0.80% | 0.80% | |
| 03:00 | NZD | RBNZ Inflation Expectations Q2 | 2.53% | 2.37% | ||
| 05:00 | JPY | Eco Watchers Survey: Current Apr | 40.8 | 41.6 | 42.2 | |
| 09:00 | EUR | Eurozone GDP Q/Q Q1 P | 0.10% | 0.10% | 0.10% | |
| 09:00 | EUR | Eurozone Industrial Production M/M Mar | 0.20% | 0.30% | 0.40% | 0.20% |
| 12:30 | USD | PPI M/M Apr | 1.40% | 0.50% | 0.50% | 0.70% |
| 12:30 | USD | PPI Y/Y Apr | 6.00% | 4.90% | 4.00% | 4.30% |
| 12:30 | USD | PPI Core M/M Apr | 1.00% | 0.30% | 0.10% | 0.20% |
| 12:30 | USD | PPI Core Y/Y Apr | 5.20% | 4.30% | 3.80% | 4.00% |
| 14:30 | USD | Crude Oil Inventories (May 8) | -2.0M | -2.3M |
| 23:50 | JPY |
| Bank Lending Y/Y Apr | |
| Actual | 5.40% |
| Consensus | 4.60% |
| Previous | 4.80% |
| 23:50 | JPY |
| Current Account (JPY) Mar | |
| Actual | 3.90T |
| Consensus | 2.93T |
| Previous | 2.71T |
| Revised | 2.70T |
| 01:30 | AUD |
| Wage Price Index Q/Q Q1 | |
| Actual | 0.80% |
| Consensus | 0.80% |
| Previous | 0.80% |
| 03:00 | NZD |
| RBNZ Inflation Expectations Q2 | |
| Actual | 2.53% |
| Consensus | |
| Previous | 2.37% |
| 05:00 | JPY |
| Eco Watchers Survey: Current Apr | |
| Actual | 40.8 |
| Consensus | 41.6 |
| Previous | 42.2 |
| 09:00 | EUR |
| Eurozone GDP Q/Q Q1 P | |
| Actual | 0.10% |
| Consensus | 0.10% |
| Previous | 0.10% |
| 09:00 | EUR |
| Eurozone Industrial Production M/M Mar | |
| Actual | 0.20% |
| Consensus | 0.30% |
| Previous | 0.40% |
| Revised | 0.20% |
| 12:30 | USD |
| PPI M/M Apr | |
| Actual | 1.40% |
| Consensus | 0.50% |
| Previous | 0.50% |
| Revised | 0.70% |
| 12:30 | USD |
| PPI Y/Y Apr | |
| Actual | 6.00% |
| Consensus | 4.90% |
| Previous | 4.00% |
| Revised | 4.30% |
| 12:30 | USD |
| PPI Core M/M Apr | |
| Actual | 1.00% |
| Consensus | 0.30% |
| Previous | 0.10% |
| Revised | 0.20% |
| 12:30 | USD |
| PPI Core Y/Y Apr | |
| Actual | 5.20% |
| Consensus | 4.30% |
| Previous | 3.80% |
| Revised | 4.00% |
| 14:30 | USD |
| Crude Oil Inventories (May 8) | |
| Actual | |
| Consensus | -2.0M |
| Previous | -2.3M |
US Dollar Rallies Back After CPI: Is the Correction Over? EUR/USD, GBP/USD and Dollar Index Overview
The US Dollar saw a sharp correction after the fragile ceasefire began, but that downward trend has now completely stopped.
With the peace narrative having stalled, it is clear that the FX market is taking a more realistic view of the US-Iran diplomatic talks than stock markets, which remain optimistic despite little real progress.
Foreign exchange markets are focusing on energy prices instead of tech sector excitement, and are adjusting for geopolitical risks.
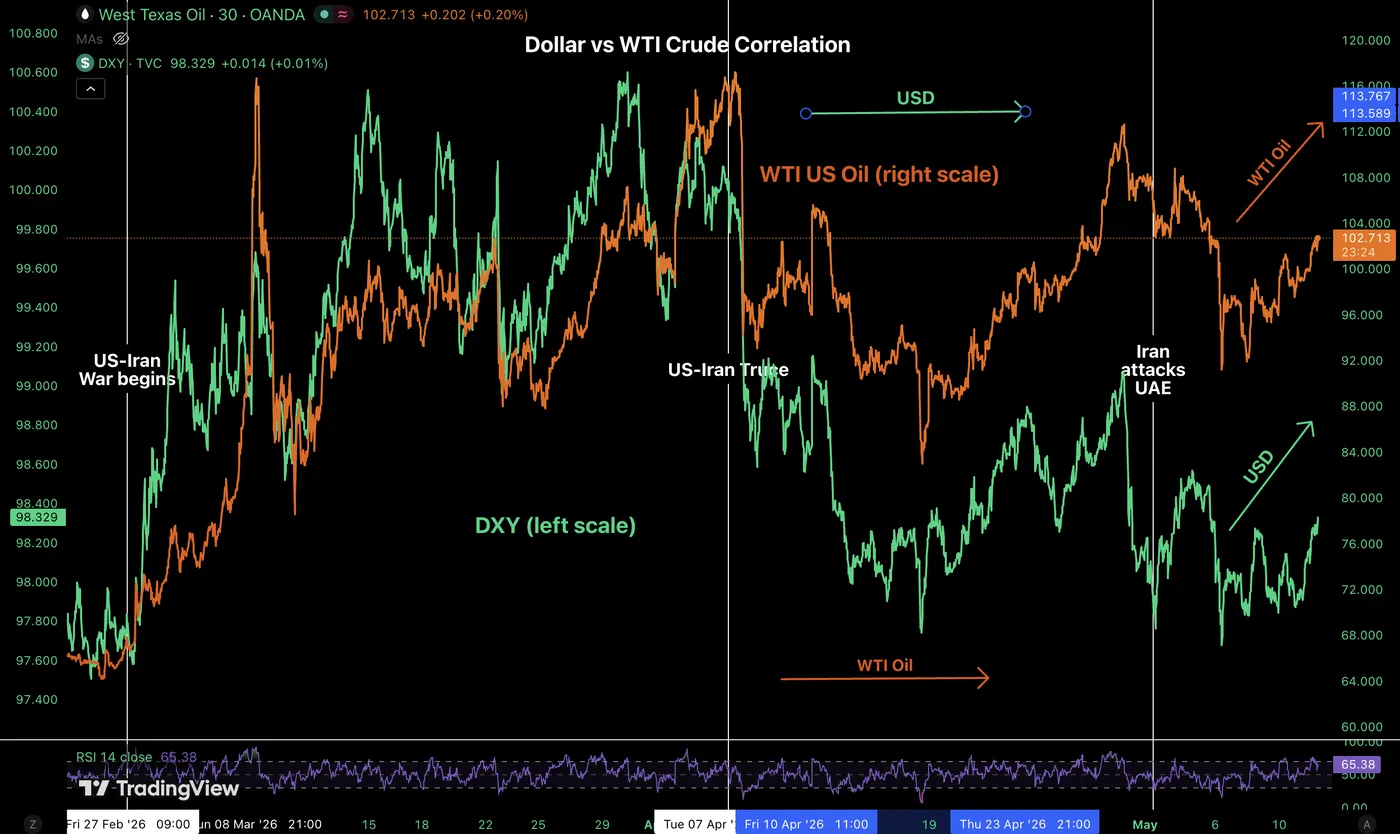
The petrodollar trade: Oil and US Dollar correlation. Source: TradingView, May 12, 2026.
After gaining against the US Dollar in late March and early April, most major currencies are back to trading in a narrow range.
Today, though, they are quickly reversing as WTI crude oil moves back above $100 with the recently souring narrative.
The ongoing conflict and related economic challenges are supporting the US Dollar. Although new reports suggest Iran may dilute its highly enriched uranium to 3.7% and 20%, overall diplomatic talks have stalled, and the uncertainty continues to disrupt energy supply chains while adding to demand for the US Dollar.
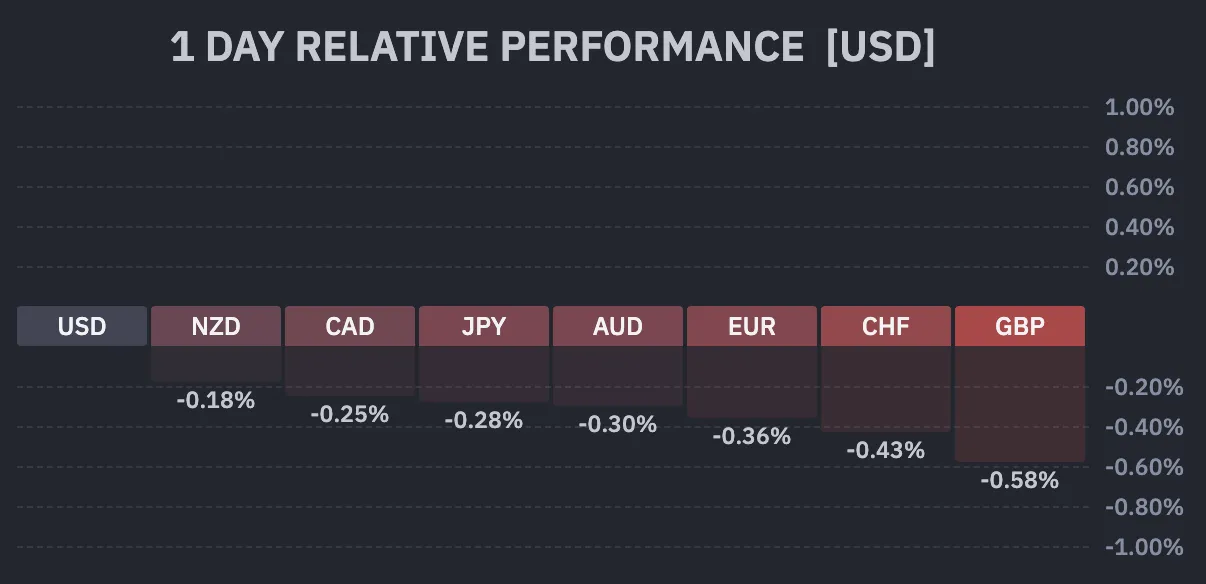
Current session's FX performance. Source: Finviz, May 12, 2026.
Along with the ongoing geopolitical uncertainty, a higher-than-expected inflation report has strengthened the US Dollar, with another inflation report due tomorrow in the form of PPI.
Today’s CPI showed headline inflation at 3.8%, compared with 3.7% expected, and core CPI at 2.8%, versus a 2.6% forecast. That was a large rise, though not too surprising considering the explosion in gas prices.
The strong inflation reading keeps suggesting that the Fed will keep rates unchanged, if not hike, putting pressure on other major currencies.
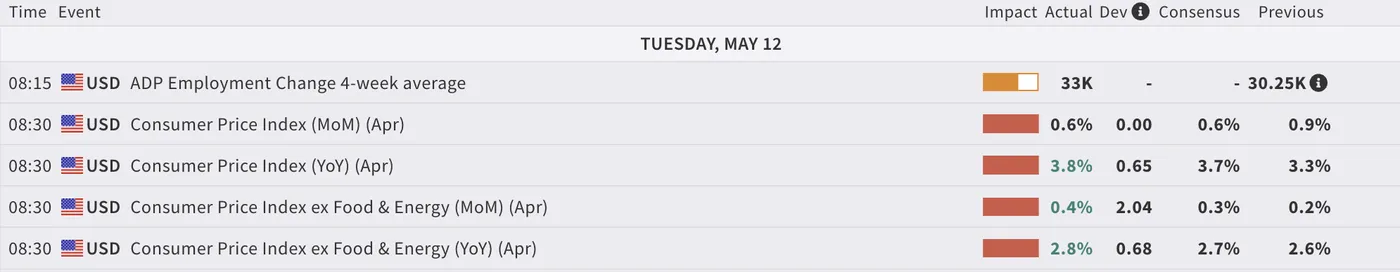
US morning data. Source: MarketPulse Economic Calendar.
We will look at the Dollar Index, EUR/USD, and GBP/USD to assess the current state of the FX market and where to look next.
Dollar Index 4H Chart
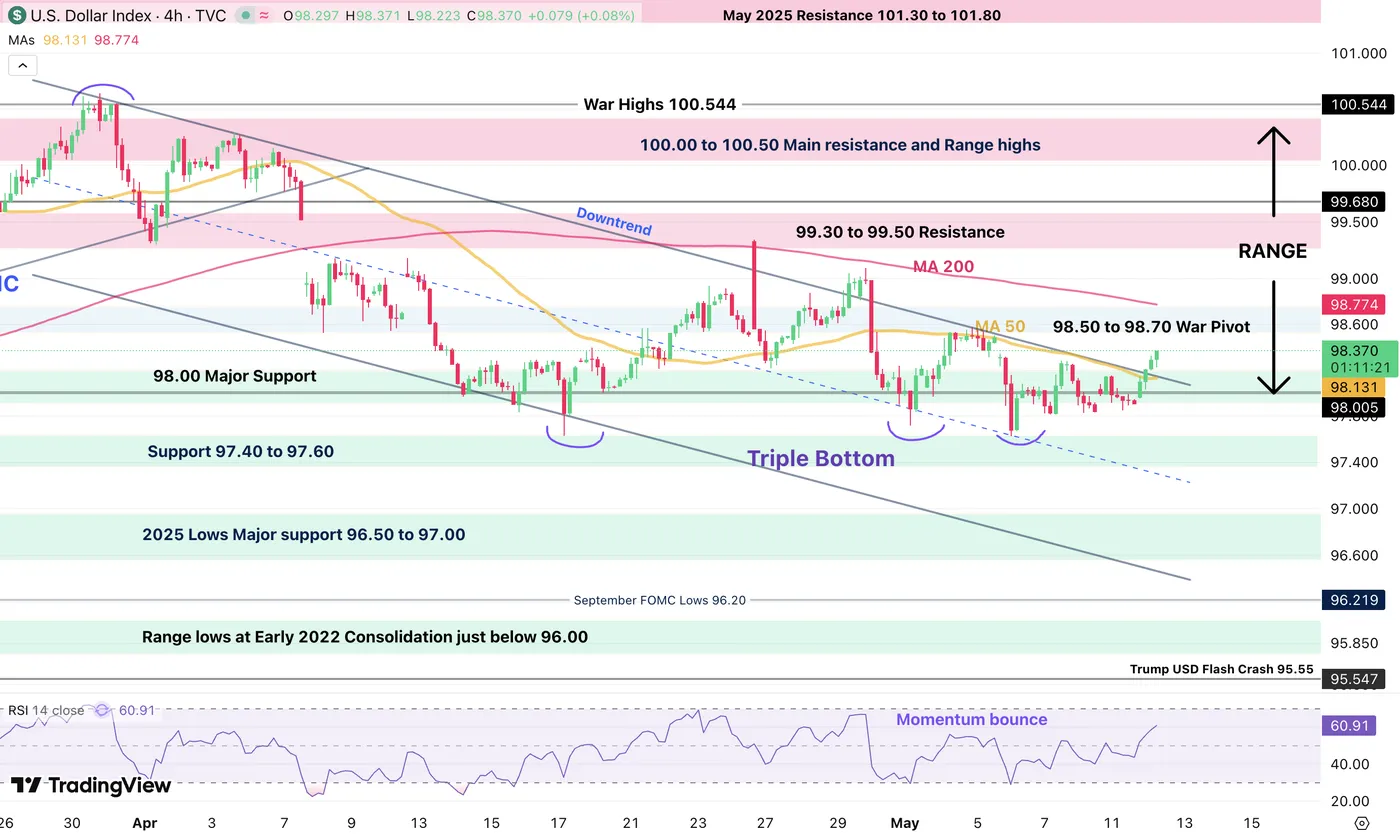
Dollar Index daily chart, May 12, 2026. Source: TradingView.
The US Dollar is breaking out of its end-March downward channel after forming a triple bottom right around the 97.50 level.
With the recent lows coinciding with the mid-zone of the larger 96.00 to 100.00 range, the consolidation could be tightening further between 98.00 and 100.00 as long as the peace process does not move forward.
Expect more US Dollar rallies if the index breaches 98.50.
Levels of interest for the Dollar Index:
Resistance Levels
- 98.50 to 98.70 war pivot
- 98.78 4H 200-period MA
- 99.40 to 99.50 resistance
- Initial war spike 99.68
- 100.00 to 100.50 main resistance zone
- War highs 100.544
Support Levels
- 98.00 2025 support, testing and bearish below
- Support 97.40 to 97.60, triple bottom
- 2025 lows 96.40 to 96.80 support
- Range lows at early 2022 consolidation just below 96.00
GBP/USD 4H Chart and Technical Levels
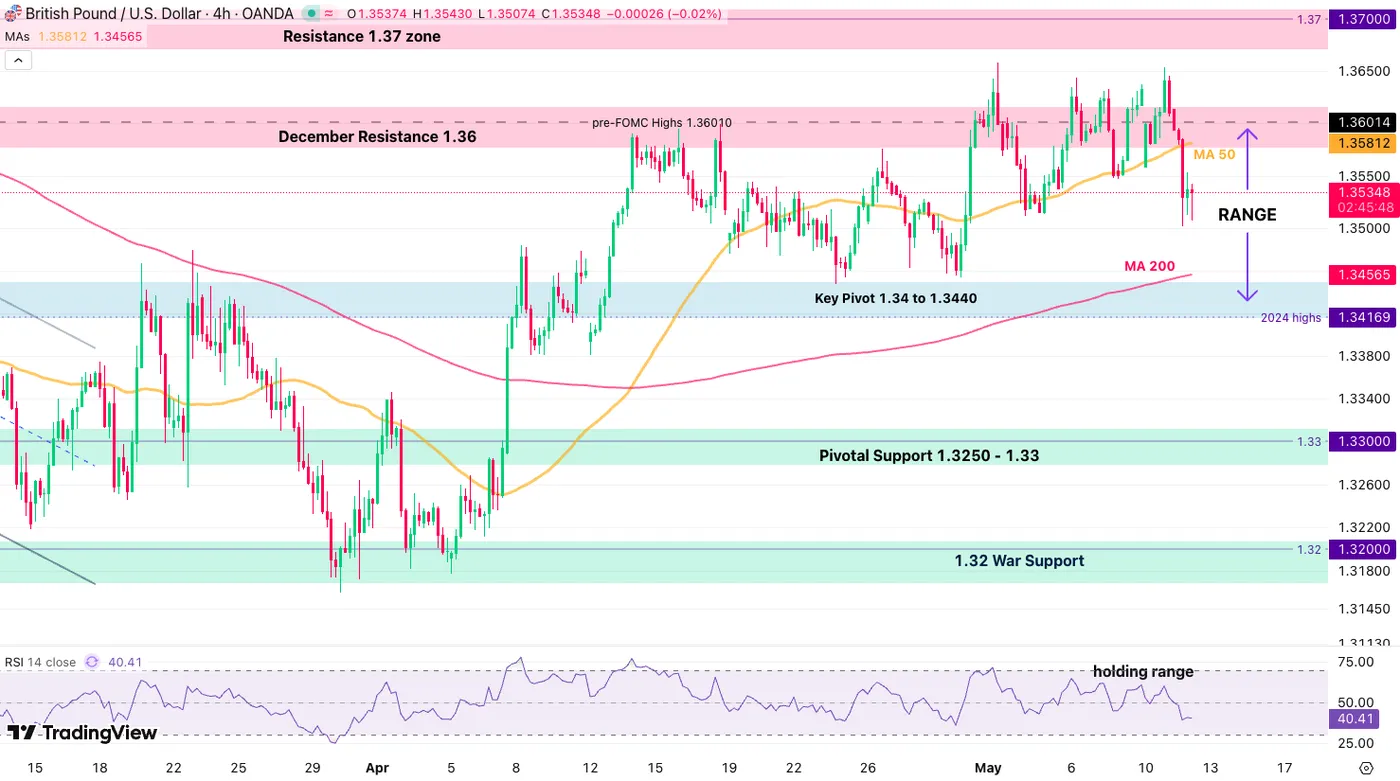
GBP/USD 4H chart, May 12, 2026. Source: TradingView.
GBP/USD is still trading between 1.3410 and 1.36 but is now rejecting its resistance zone, heading back to support.
Add ongoing outflows and political turmoil in the UK, with Keir Starmer's ministers resigning, and the outlook for the Pound looks bearish.
While still far, watch whether the 1.34170, 2024 top, level holds.
Levels of interest for GBP/USD:
Resistance Levels
- December resistance 1.36, range highs
- Pre-FOMC highs 1.36010
- Resistance 1.37 zone
- 2025 resistance around 1.38
Support Levels
- Key pivot 1.3410 to 1.3440
- 1.34170, 2024 top level
- Pivotal support 1.3250 to 1.33
- 1.32 war support
EUR/USD 4H Chart and Technical Levels
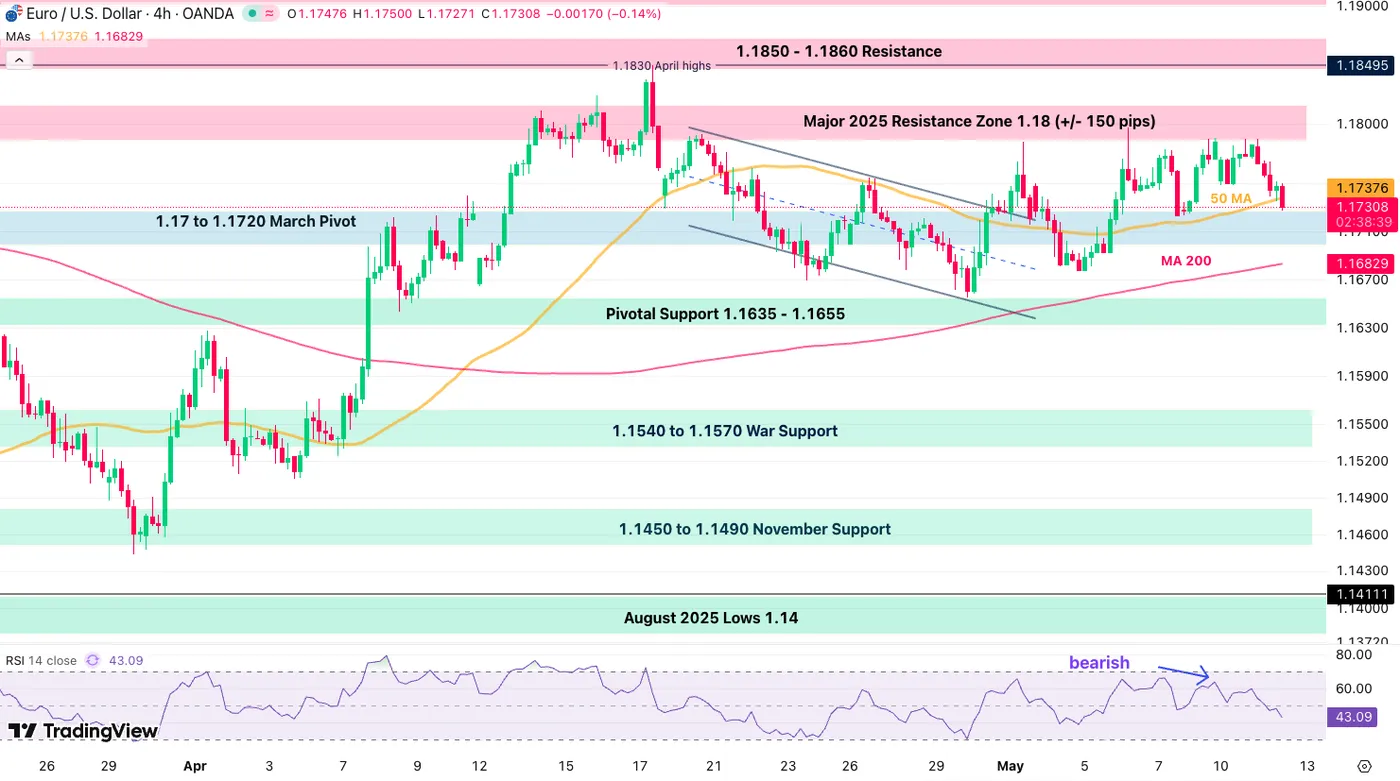
EUR/USD 4H chart, May 12, 2026. Source: TradingView.
EUR/USD is also rejecting its 1.18 resistance and quickly falling towards the 1.17 momentum pivot, with bearish acceleration expected as the RSI falls below neutral.
Sellers are also breaching the 4H 50-period MA, which could weigh on price action. While momentum is still lacking, traders will want to confirm the move with strong bearish candles and volume around 1.1720.
Levels to place on your EUR/USD charts:
Resistance Levels
- 1.17380 4H 50-period MA
- Resistance zone around 1.18, +/- 150 pips
- 1.1830 June 2025 highs
- 1.1850 to 1.1860 recent test
- September 2021 highs, resistance 1.19 to 1.1950 zone
Support Levels
- 1.17 to 1.1720 March pivot
- Rebound highs 1.17200, bearish below
- Major pivot 1.16250 to 1.16350
- 1.1540 to 1.1570 war support
- 1.1475 to 1.15 November support
- War lows 1.1410
Safe trades and keep a close eye on ceasefire news.
US-China – Xi-Trump Meeting Preview: We Expect No Game Changers
We do not expect the Trump-Xi meeting on May 14-15 to lead to major breakthroughs in US-China relations. We expect near-term financial market impact to remain limited.
Trump does not have the incentives nor the means to ramp up the pressure on China with focus remaining on the war in Iran and earlier court ruling still constraining his tariff weapon. For China, keeping relations on a stable track is the main priority, especially when it comes to Taiwan.
The countries could agree on China increasing purchases of US agricultural goods, an extended tariff truce and establishment of mutual trade and investment 'boards', though these should be seen as largely symbolical. Change in the wording of US policy on Taiwan would be a major victory for China.
Sunset Market Commentary
Markets
Risk premia were back in vogue from the start of trading this morning. Evidently, the stalemate in the process of reaching a solution to the US-Iran conflict, via higher oil prices (Brent currently $107.5 p/b), again tilted markets to a more risk-averse approach. However, country-specific issues obviously are also at work. UK markets were the main case in point. Since last week’s huge defeat of Keir Starmer’s Labour party in regional and local elections, (internal) pressure within his party is building for the PM to resign. However, the PM after a Cabinet meeting today reiterated he intends to continue governing at least as no formal leadership contest is being triggered along the party rules. Even so, from a market point of view, whether the UK PM stays in place and adapts policy or whether he finally quits, fiscal policy/sustainability might again be at risk if policy were to shift to a more pro-spending course. UK yields in nervous trading add 9 bps (2-y) to 12 bps (10-y). After holding ‘remarkably’ stable in a first reaction to the election outcome, sterling this time also lost ground. EUR/GBP just missed a test of the 0.87 barrier (currently 0.8675). On Japanese markets, some tensions are also lingering. Yields on Japanese government bonds add between 1 bp (2-y) and 4.8 bps (30-y). This might not look that spectacular. However at 2.56% the Japanese 10-y yield is touching levels last seen in 1997. At 3.83%, the 30-y JGB yield is also closing in on last year’s multiyear top. Higher Japanese risk premia also suggest fiscal sustainability issues. Admittedly, a good 10-y bond auction to some extent mitigated pressure. Even so, FX policy also plays on the background. US Treasury secretary Bessent and Japan Fin Min Katayama indicated to stay in close contact to address undesirable FX volatility. This suggests the US supports Japan’s FX interventions to prevent further yen weakness. However, at some point, it also might put additional pressure on the BOJ to take ‘more fundamental’ action (rate hikes) to provide yield support to the ailing currency. This remains a factor of uncertainty for Japanese yield markets too. The yen intraday briefly spiked from the 157.7 area to near 156.8, but can’t hold on to the gains (currently 157.6). In current context of higher risk/inflation premia, German bond yields add between 6 bps (2-y) and 4.5 bps (30-y). The Eurostoxx 50 cedes about 1%.
With the market focus mainly on risk premia outside the US, April US CPI inflation also deserved attention. At 0.6% M/M and 3.8% Y/Y for headline (from 3.3%) and 0.4% M/M and 2.8% (from 2.6%) for the core reading, the report was slightly higher than expected. Evidently, the rise in energy/gasoline prices were responsible for the rise in prices. However, the move was more broad-based with amongst others food prices (0.5% M/M) and broader services prices ex energy (0.5% M/M, including shelter 0.6% M/M) adding to price rises. With recent labour and other US activity data holding up well, today’s data justify the call of those FOMC members objecting the easing bias in the statement. Even so, the reaction on US yield markets 2-y +3 bps; 30-y +2 bps) remains modest. US equity indices are correcting 0.5%-0.75% lower.
News & Views
The Belgian debt agency launched a new 5-yr benchmark (OLO 108 3.1% Aug2031) via syndication. The bond was priced to yield MS + 19 bps compared to guidance in the MS +21 bps area. Books were in excess of €45bn, allowing the debt agency to print €8bn. Thanks to today’s sale, the BDA now raised €32bn in OLO funding YtD compared with a €51.6bn target (62%). The remainder is expected to be collected through regular OLO auctions given that today’s deal was this year’s third and final (according to funding plan) syndication. In January the BDA launched its traditional new 10-yr OLO benchmark (3.4% Jun2036). In February, they launched a 30-yr OLO (4.35% Jun2056).
CME Group, the world's leading derivatives marketplace, and Silicon Data, the industry leader in GPU market intelligence and benchmarking, announced they will launch a first-in-class compute futures market later this year, pending regulatory review. The new futures contracts will allow traders, financial institutions, AI builders and cloud-service providers to manage volatility and price risk associated with the multi-trillion-dollar compute market. The products will be based on Silicon Data's indices, the world's first daily GPU benchmarks for on-demand rental rates. The CEO of global trading firm DRW, which backs the initiative argues that compute will become the largest commodity in the world. "The exponential growth in spending on data centers as we move towards that reality has been hampered by the lack of a hedging vehicle. The launch of a compute futures market is an important solution to that problem that can help market participants manage price volatility and plan with greater certainty.”
Sterling Falls on Deepening Political Crisis in UK
Cable fell around 0.8% on Tuesday on deepening political crisis, following calls from a number of lawmakers to PM Starmer to step down after his Labour Party suffered heavy losses in recent local elections.
Fresh weakness of sterling and shares, as well as rise of UK long-dated borrowing costs to the highest in three decades, came because of a change of investors’ sentiment towards potential scenario of change of leadership.
Although Starmer opposed calls to resign in today’s cabinet meeting and said he would get on governing, sterling is expected to remain under pressure on growing political uncertainty, as well as threats of deepening economic crisis, as the world starts to feel the full impact of the US – Iran war.
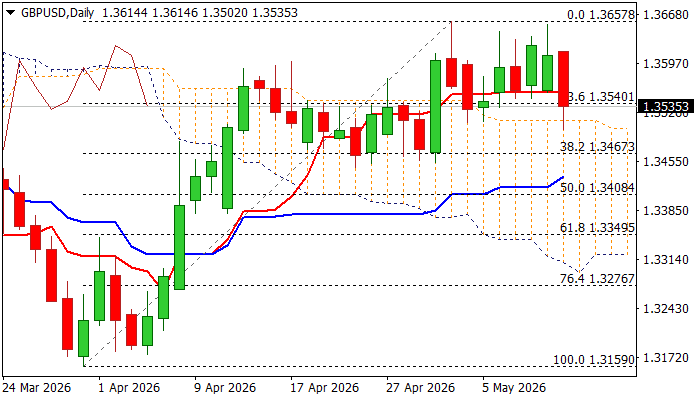
Technical studies on daily chart were weaker on Tuesday, but overall structure is still bullish, although dented with today’s drop.
Fresh bears faced headwinds from daily cloud top (1.3514), but the cloud is narrowing and about to twist in two weeks that could attract bears.
Penetration of cloud would generate initial bearish signal, which will look for confirmation on extension below pivotal supports at 1.3467/50 (Fibo 38.2% of 1.3159/1.3657 / late Apr higher base) break of which to signal reversal and open way for deeper drop.
Daily indicators turned south, although still holding in positive territory, with a batch on converged DMAs at 1.3480/20 zone (100 / 55 / 200) still in bullish configuration and marking significant supports.
Res: 1.3555; 1.3614; 1.3658; 1.3700
Sup: 1.3514; 1.3480; 1.3450; 1.3420
US: Inflation Rises to Three-Year High of 3.8% in April
The Consumer Price Index (CPI) rose by 0.6% month-on-month (m/m) in April, meeting the Bloomberg consensus forecast. On a twelve-month basis, CPI jumped 3.8% – the fastest rate of growth in three-years.
- Another surge in energy costs accounted for roughly half the monthly gain in headline, led by a 5.6% m/m gain in prices at the pump. Food prices (+0.5% m/m) also heated up last month, led by a sharp acceleration in grocery costs (+0.7% m/m).
Excluding food and energy, core inflation rose 0.4% m/m, a tick stronger than consensus and roughly double the rate of increase from the month prior. On a twelve-month basis, core prices were up 2.8% (from 2.6% in March).
Services inflation jumped 0.5% m/m, following a softer 0.2% m/m gain in March. Primary shelter costs were the main driver, rising 0.5% m/m – much stronger than the 0.2% m/m averaged over the prior three months.
- Non-housing services also firmed thanks to another uptick in airfares and personal care services.
Core goods prices were flat, as price gains in apparel and education & communication goods were offset by a pullback in household furnishings and medical goods.
Key Implications
Inflationary pressures heated up in April, as elevated crude oil prices continued to push gas prices higher and lead to some spillover price effects across other categories like food and airfares. That said, some of the uptick in core inflation looks overdone. Primary shelter contributed 0.2 percentage points to April's increase – double its normal monthly contribution – which looks to be related to an unwinding of a government-shutdown survey quirk that occurred in the CPI data late last year. This effect should fall out next month, allowing the shelter component to resume its downward trend.
This morning's numbers reinforce why the Fed needs to remain patient. Even assuming a "more normal" reading on shelter prices last month, core inflation would've still firmed relative to March. With secondary price effects from higher energy prices likely to intensify in the months ahead, we're likely to see core measures of inflation drift a bit higher and hover around 3% through year-end. Treasury yields across the curve were little changed post-release, with Fed futures now shifting back to pricing in a 60% probability of a rate hike by March 2027.
EUR/GBP Mid-Day Outlook
Daily Pivots: (S1) 0.8632; (P) 0.8651; (R1) 0.8673; More…
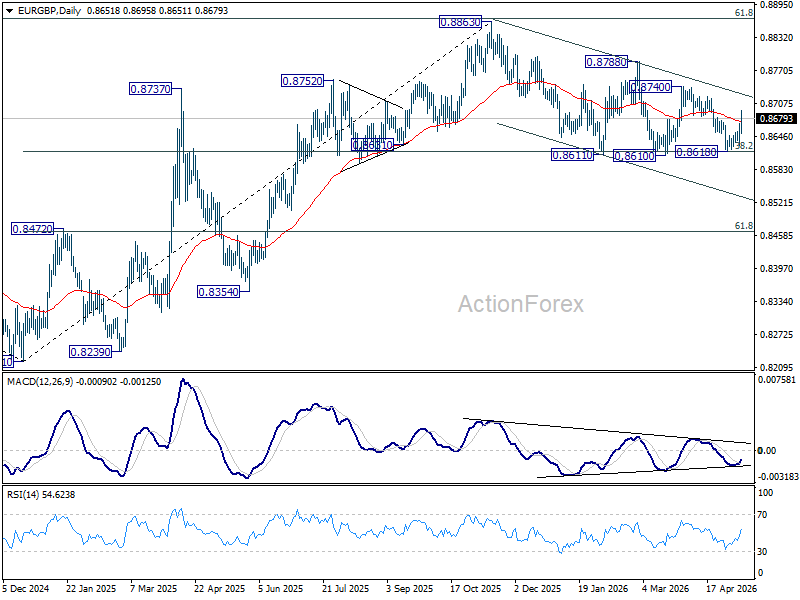
EUR/GBP's extended rebound and break of 0.8676 resistance suggests that fall from 0.8740 has completed at 0.8618 already. Intraday bias is back on the upside for 0.8740 first. Firm break there will target 0.8788 resistance next. For now, risk will stay on the upside as long as 0.8618 holds, in case of retreat.
In the bigger picture, focus is back on 38.2% retracement of 0.8821 to 0.8863 at 0.8618. Strong rebound from there will retain medium term bullishness. Rise from 0.8221 should resume through 0.8863 at a later stage. Nevertheless, sustained break of 0.8618 will confirm that whole rise from 0.8221 has completed at 0.8863. Deeper decline should then be seen to 61.8% retracement at 0.8466 at least.
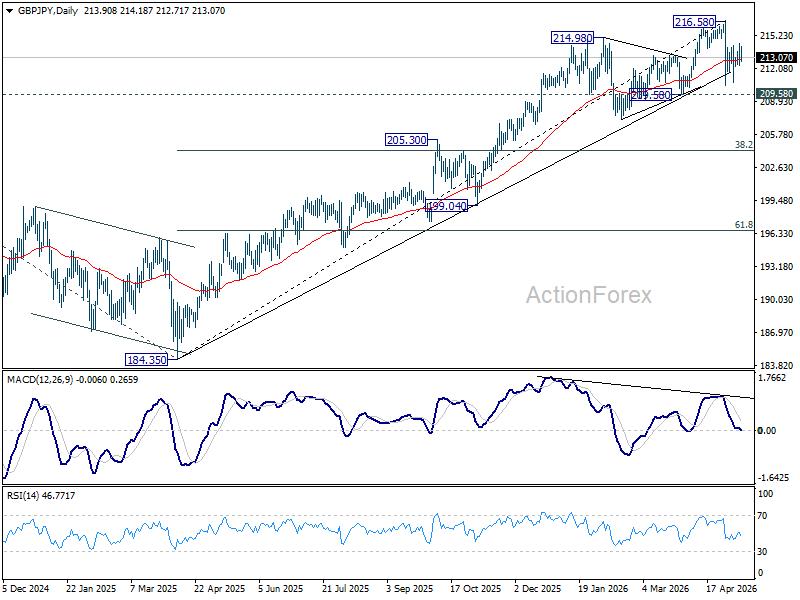
GBP/JPY Mid-Day Outlook
Daily Pivots: (S1) 212.51; (P) 213.46; (R1) 214.81; More...
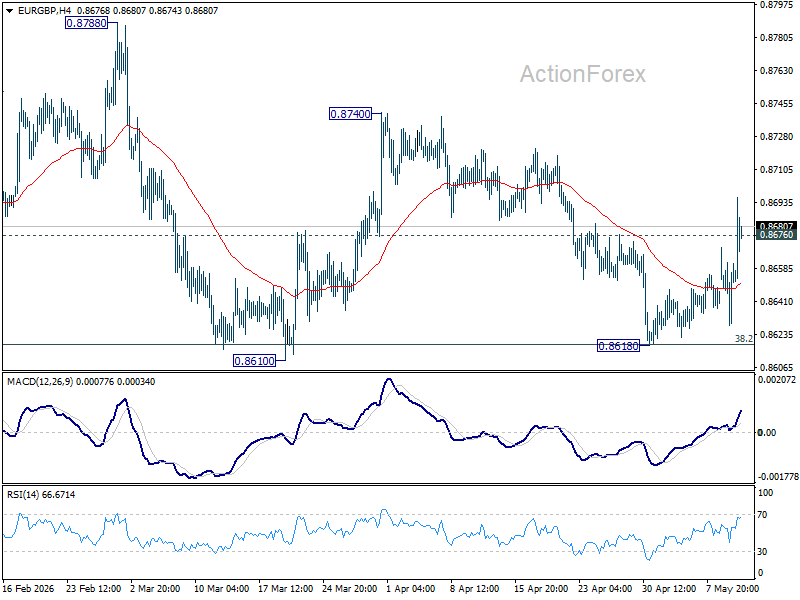
Intraday bias in GBP/JPY is turned neutral again with 4H MACD crossed below signal line. On the downside, break of 212.35 minor support will bring deeper fall back to 210.43 support. On the upside, firm break of 214.40 will bring stronger rebound to retest 216.58 high.
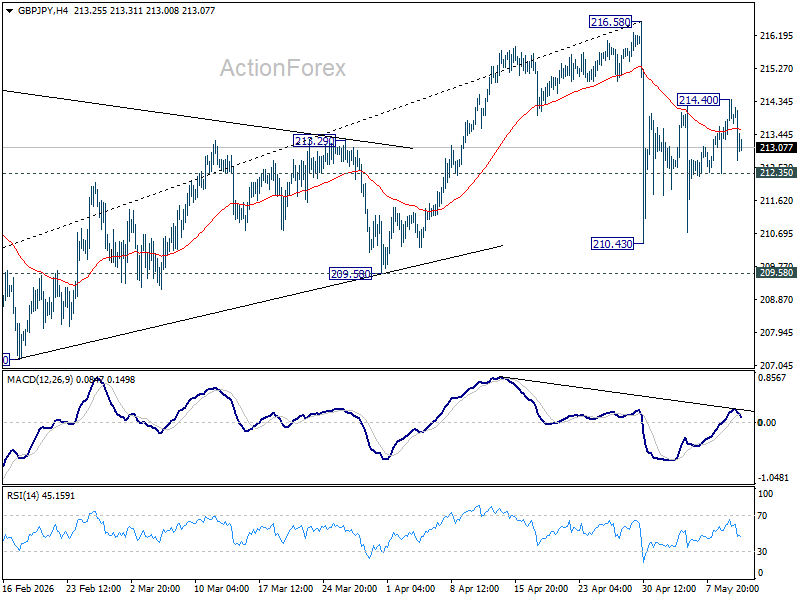
In the bigger picture, while the fall from 216.58 is steep, there is no clear sign of trend reversal yet. The long term up trend could still extend to 61.8% projection of 148.93 (2022 low) to 208.09 (2024 high) from 184.35 at 220.90 on resumption. However, sustained break of 55 W EMA (now at 205.75) will argue that it's already in medium term down trend for 184.35 support.