Sample Category Title
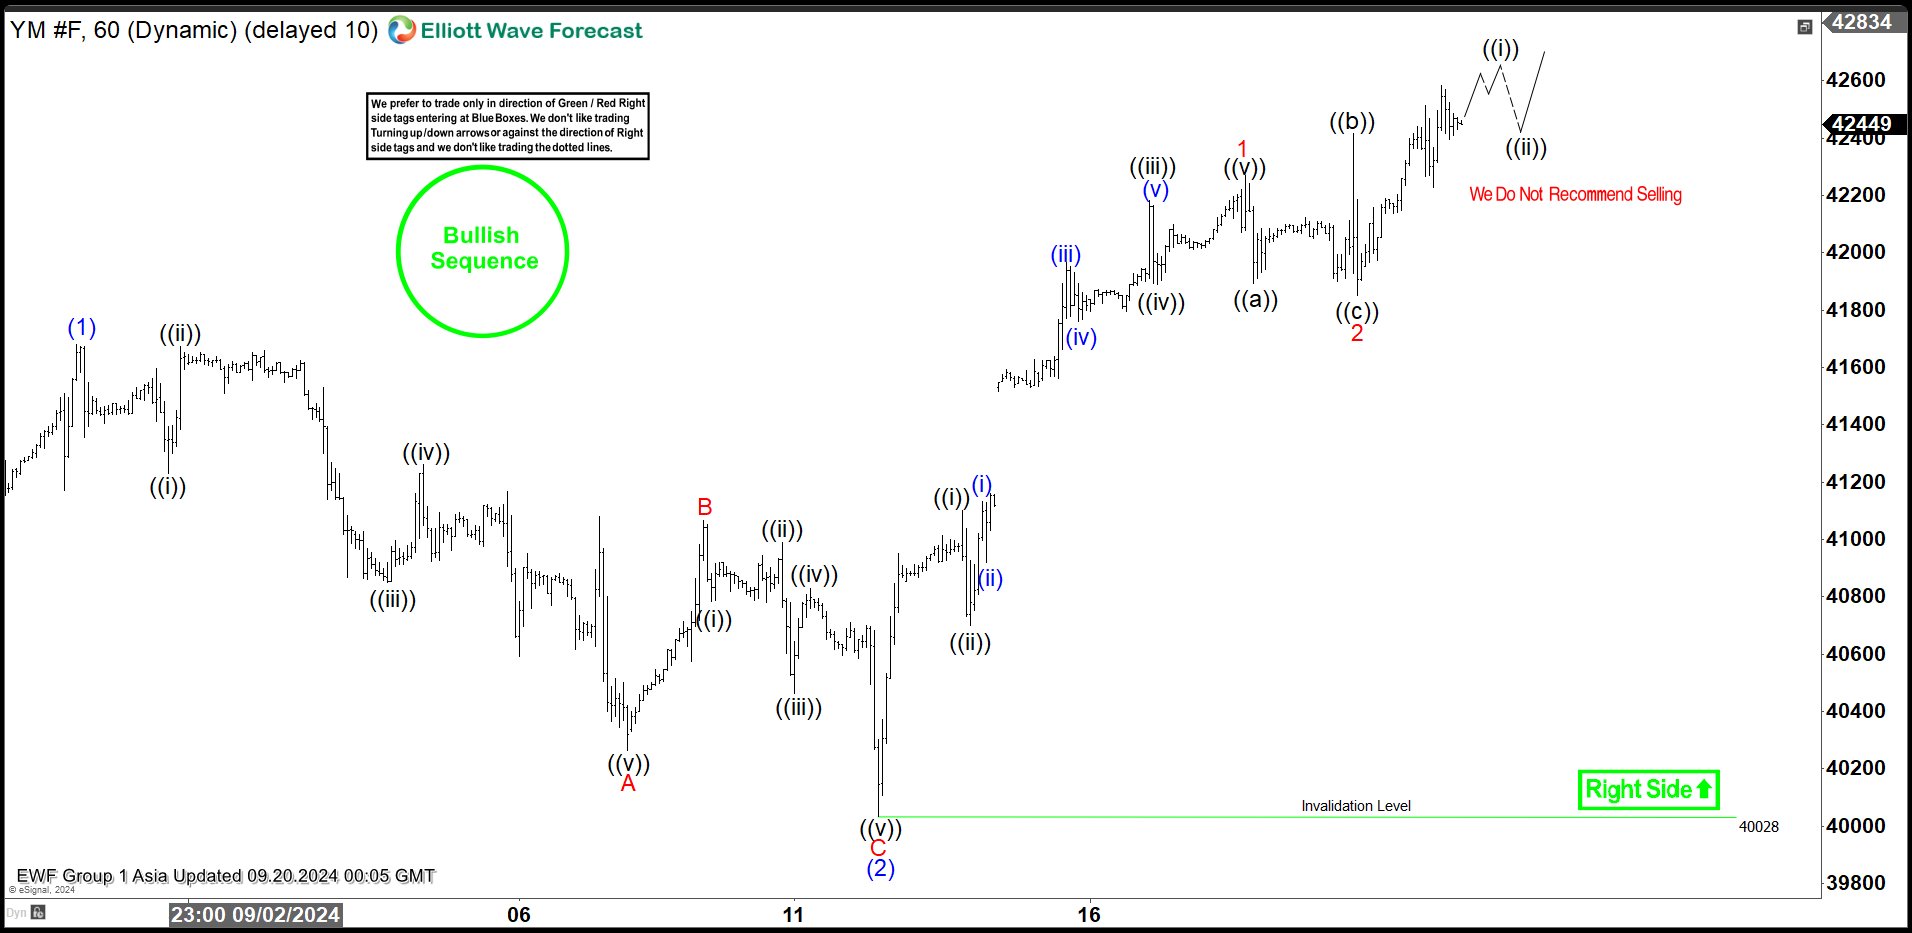
Intraday Elliott Wave View on Dow Futures (YM) Favors the Bullish Side
Short term Elliott Wave view on Dow Futures (YM) suggests that cycle from 8.8.2024 low is in progress as an impulse. Up from 8.8.2024 low, wave (1) ended at 41682 and wave (2) pullback ended at 40028 as the 1 hour chart below shows. Internal subdivision of wave (2) unfolded as a zigzag Elliott Wave structure. Down from wave (1), wave A ended at 40264 and rally in wave B ended at 41065. The Index then extended lower in wave C towards 40028 which completed wave (2) in higher degree.
Index has turned higher in wave (3). Internal subdivision of wave (3) is unfolding as a 5 waves impulse. Up from wave (2), wave ((i)) ended at 41100 and wave ((ii)) pullback ended at 40701. Wave ((iii)) higher ended at 42184, and wave ((iv)) pullback ended at 41890. Final leg wave ((v)) ended at 42270 which completed wave 1 in higher degree. Pullback in wave 2 unfolded as an expanded flat where wave ((a)) ended at 41893, wave ((b)) ended at 42416 and wave ((c)) ended at 41850. Index has resumed higher in wave 3 of (3). Near term, as far as pivot at 40028 low stays intact, expect dips to find support in 3, 7, or 11 swing for further upside.
Dow Futures (YM) 60 Minutes Elliott Wave Chart
Dow Futures (YM) Elliott Wave Video
https://www.youtube.com/watch?v=dTf2w_6XBRc
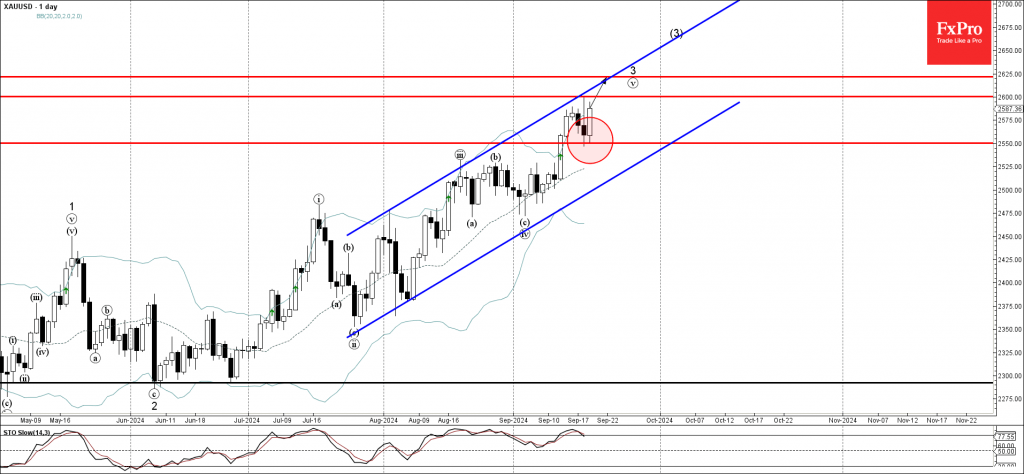
Gold Wave Analysis
- Gold reversed from support level 2550.00
- Likely to rise to resistance level 2600.00
Gold continues to rise inside the minor impulse waves v and 3, which belong to the intermediate impulse wave (3) from the start of June.
The price earlier reversed up from the support level 2550.00, which stopped the previous short-term correction yesterday.
Given the prevailing daily uptrend, Gold can be expected to rise further to the next resistance level 2600.00 – the breakout of which can lead to the next resistance at 2625.00.
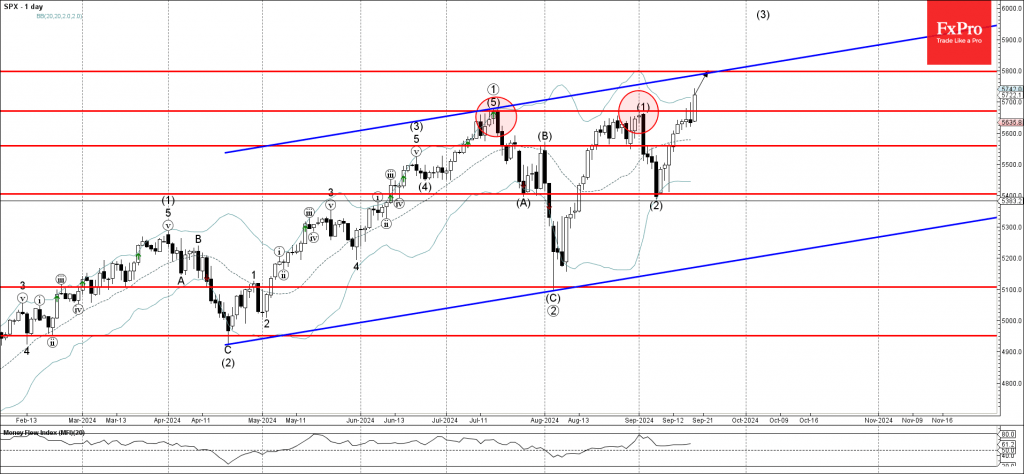
S&P 500 Wave Analysis
- S&P 500 broke key resistance level 5670.00
- Likely to rise to resistance level 5800.00
S&P 500 index today broke above the key resistance level 5670.00 (which stopped the previous impulse waves (5) and (1), as can be seen below).
The breakout of the resistance level 5670.00 continues the active intermediate impulse wave (3) from the start of September.
Given the clear daily uptrend, S&P 500 index can be expected to rise further to the next resistance level 5800.00 (intersecting with the weekly up channel from April).
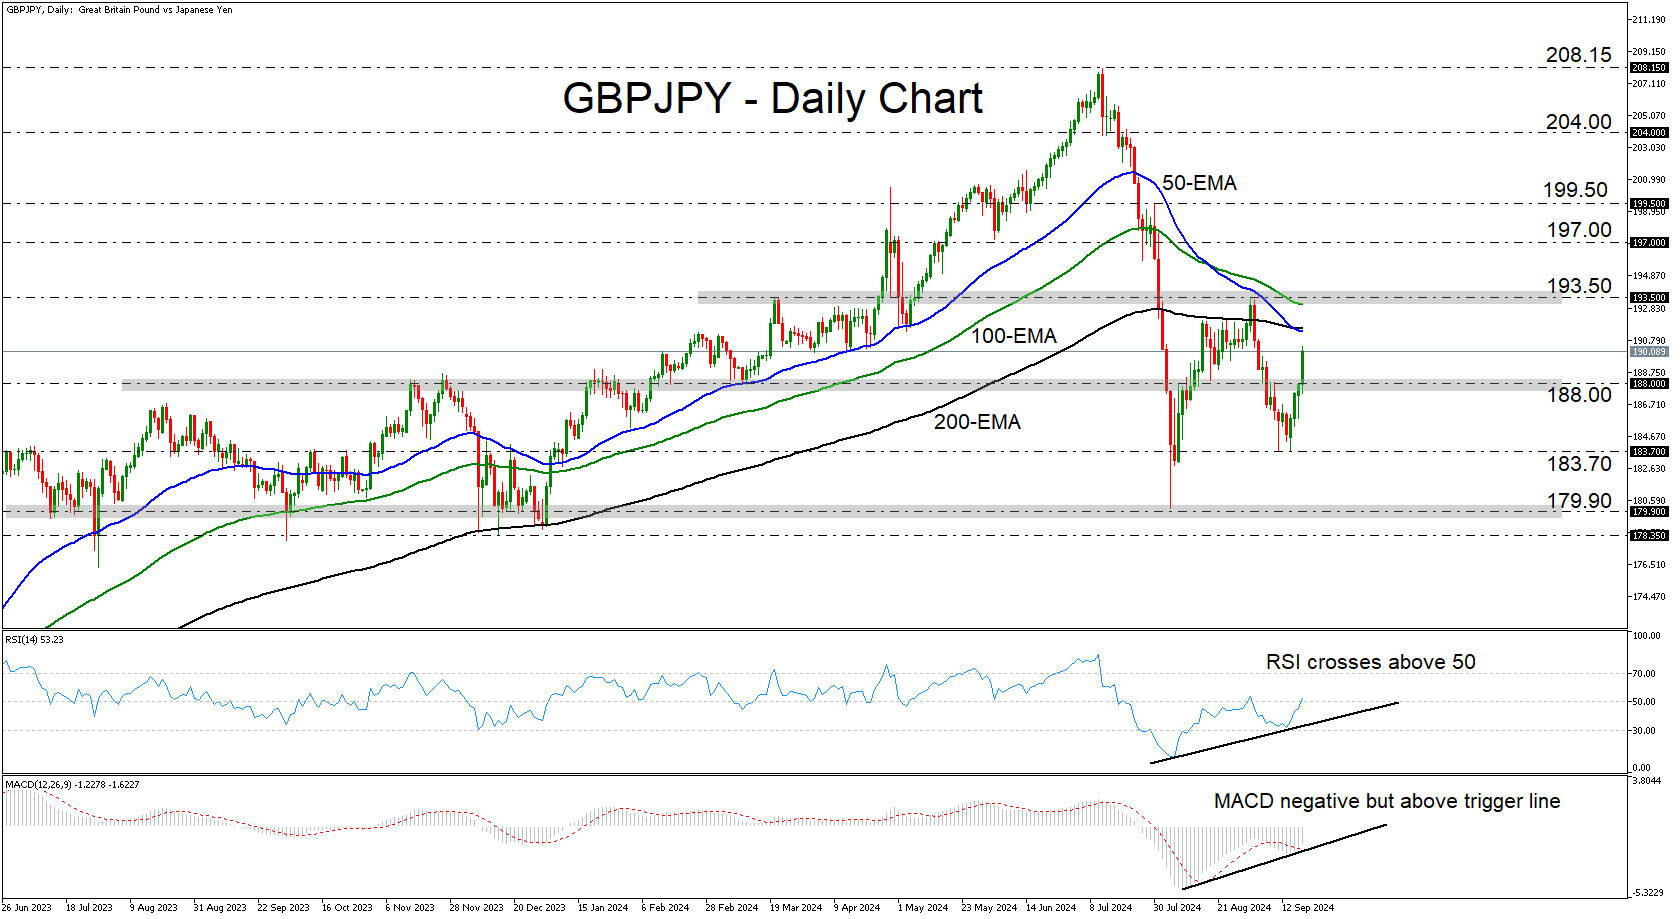
GBPJPY Surges Above 188.00 Key Barrier
- GBPJPY jumps above 188.00, confirming a higher low
- A break above 193.50 could brighten the picture
- A move below 183.70 may turn the outlook back to bearish
GBPJPY traded higher on Thursday, clearing the key resistance (now turned into support) barrier of 188.00. The move confirmed the higher high at 183.70, which cancels the bearish picture. However, the fact that the price remains below the important zone of 193.50 suggests that the outlook has not turned bullish either.
The oscillators are corroborating the notion that the bears may have jumped off the boat, at least for now. Similarly to the price action, both the RSI and the MACD have formed higher highs, with the former poking its nose above its equilibrium 50 line. The MACD, although negative, has moved above its trigger line.
For the outlook to brighten, the bulls would have to prove they are strong enough to push the action above the 193.50 barrier, a move that could take the pair above all the plotted moving averages as well. This could initially pave the way towards the 197.00 area, the break of which could see the bulls aim for the high of July 30 at 199.50.
The move signaling that the bears are back into the game may be a dip below the latest trough of 183.70. This may see scope for declines towards the low of August 5 at 179.90, or the 178.35 territory, which acted as a floor between July 2023 and January 2024.
To sum up, GBPJPY confirmed a higher low on the daily chart, but it has yet to form a clear uptrend structure. This means that the outlook has turned neutral for now.
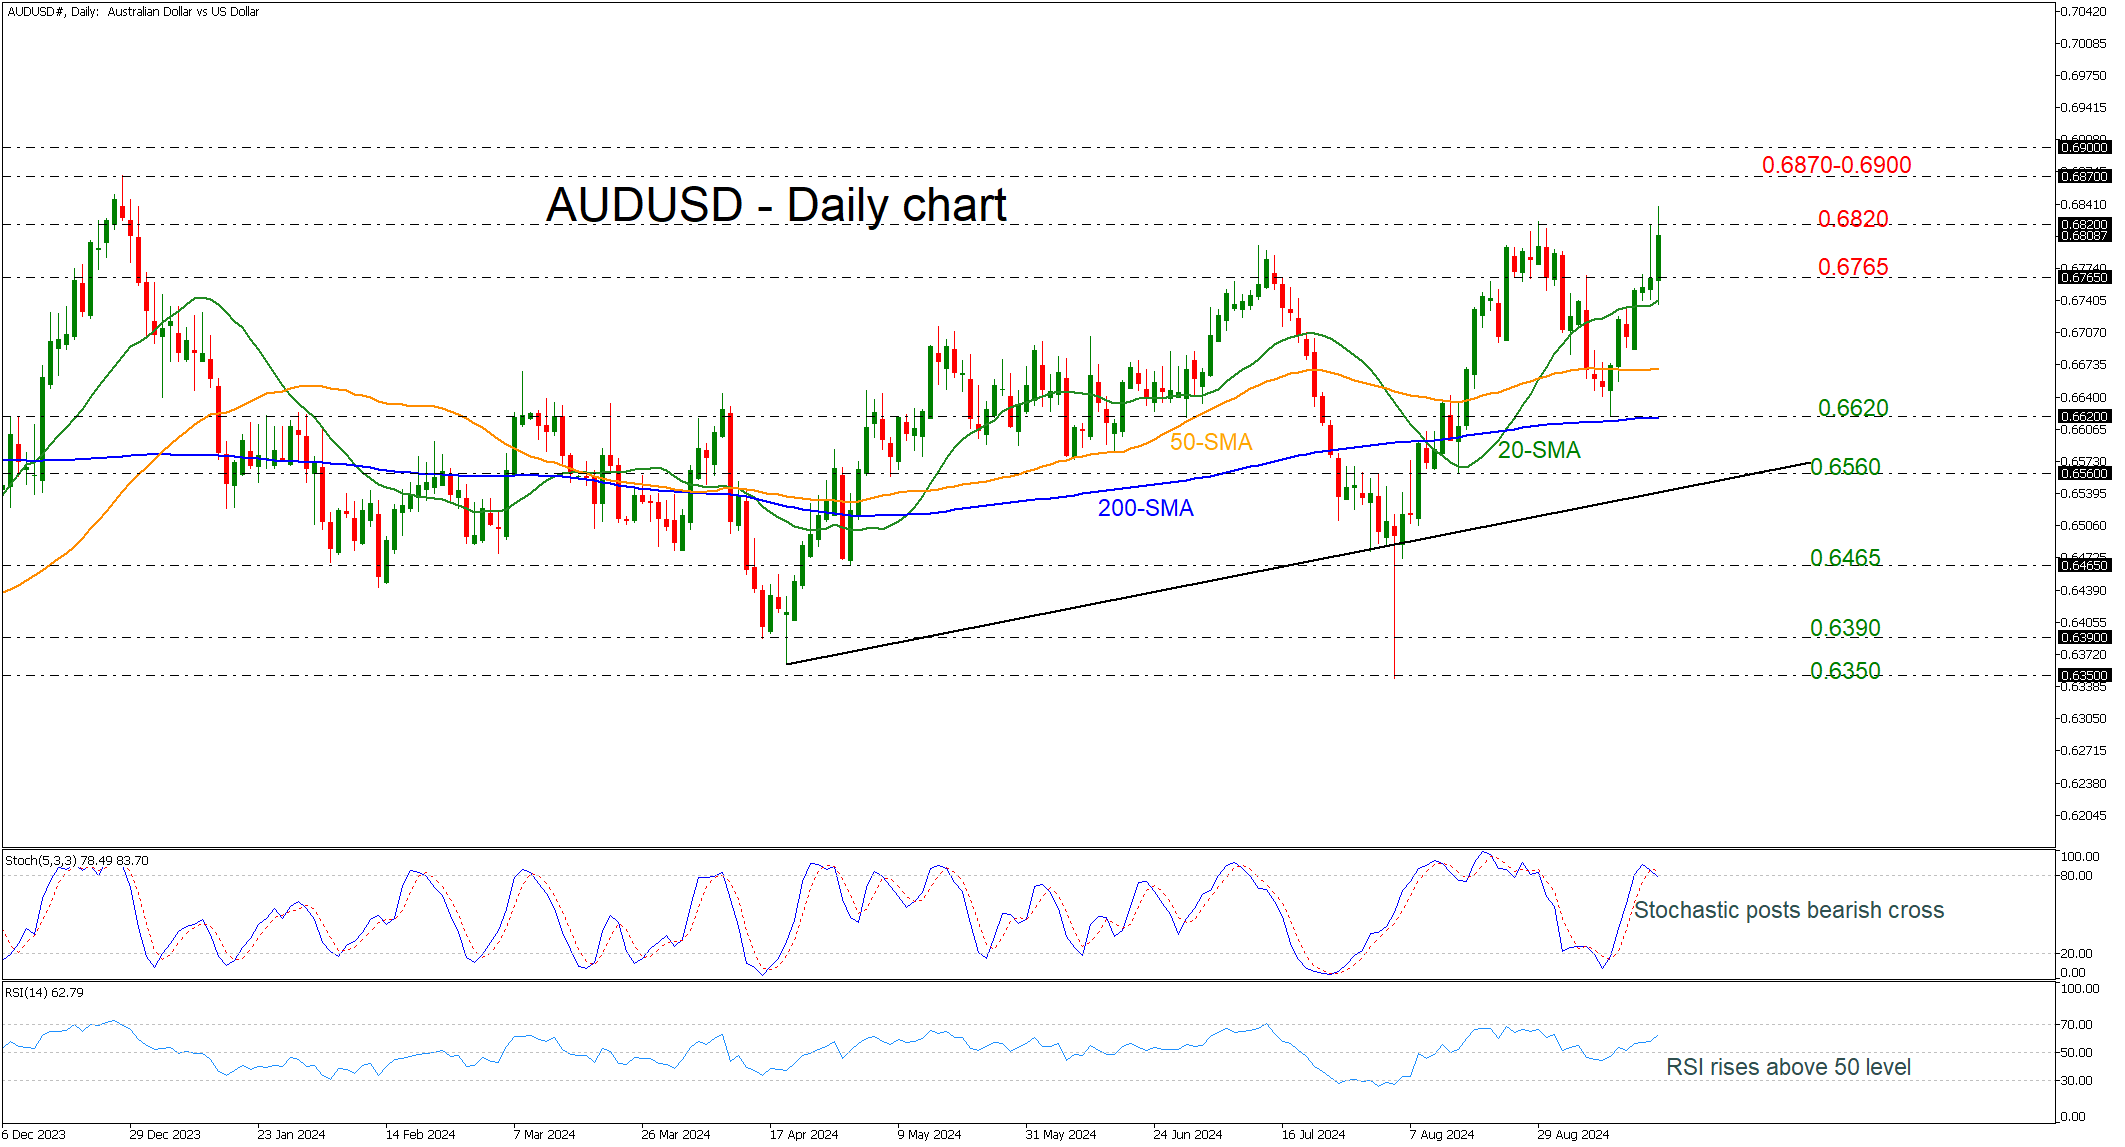
AUDUSD Posts New 9-Month High
- AUDUSD rally continues after bounce off 200-day SMA
- Technical oscillators are mixed
AUDUSD has printed a fresh nine-month high of 0.6838 earlier today, creating the fourth consecutive green candle. The pair found significant support at the 200-day simple moving average (SMA) at 0.6620, continuing the medium-term bullish structure.
The technical oscillators are showing some contradicting sings in the daily chart. The stochastic posted a bearish crossover within its %K and %D lines in the overbought region; however, the RSI is keep rising momentum above the 50 territory.
More upside pressure could open the way for a test of the 0.6870-0.6900 resistance region, taken from the highs in December 2023 and in June 2023.
Alternatively, a decline below the 0.6765 support could raise the speculation for a negative correction taking the market until the 50-day SMA at 0.6670 and then towards the 0.6620 barricade.
All in all, AUDUSD has been in a bullish tendency since April and only a dive below the uptrend line could change the current outlook.
Sunset Market Commentary
Markets
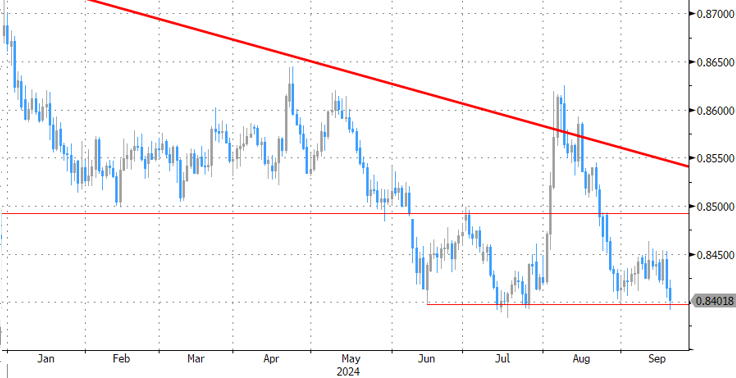
The Bank of England left its policy rate unchanged at 5% in a 8-1 majority vote. Swati Dhingra dissented in favour of a 25 bps rate cut, on the back of last month’s inaugural move. The central bank also announced an intention to reduce the stock of UK government bond purchases held for monetary policy purposes, and financed by the issuance of central bank reserves, by £100bn over the next 12 months, to a total of £558bn. That’s the same pace as the past 12 months and implies limited active sales (£13bn) given the growing amount of naturally maturing UK Gilts (£87bn). There had been some speculation of an accelerated winddown to address liquidity issues at the front end of the curve where a lot of Gilts are stuck at the BoE balance sheet and where debt issuance is scarce. There has generally been limited news in UK economic indicators relative to the Committee’s expectations in the August Monetary Policy Report. Headline GDP growth is expected to return to its underlying pace of around 0.3% per quarter in the second half of the year. CPI inflation was 2.2% Y/Y in August, and is expected to increase to around 2.5% towards the end of this year as declines in energy prices last year fall out of the annual comparison. Services consumer price inflation remained elevated at 5.6% in August. Private sector regular average weekly earnings growth declined to 4.9% in the three months to July. The MPC suggests that in the absence of material developments, a gradual approach to removing policy restraint remains appropriate. We take this hint as a quarterly rate cut approach similar to the one of the ECB. In case of the BoE, we expect another 25 bps rate cut at the next November policy meeting which includes a new Monetary Policy Report. UK gilt yields add 3.7 bps (2-yr) to 5.8 bps (10-yr) as some expected a follow-up rate cut today. Sterling outperformed with EUR/GBP testing the 0.84 big figure/support zone. Cable (GBP/USD) set a minor new cycle high at 1.3314.
Global markets digested yesterday’s bumper 50 bps FOMC rate cut. US Treasuries rallied with the front end of the curve outperforming up until the release of early US eco data. They showed a slightly better improvement in Philly Fed business outlook, but especially a drop in weekly jobless claims (219k). Together with bullish risk sentiment on stock markets, this currently helps US yields up to 6 bps higher at the very long end of the curve. The dollar initially traded on the backfoot, but EUR/USD’s rally ran into trouble together with US Treasuries (1.1180 intraday top).
News & Views
The Norwegian central bank kept the policy rate unchanged at 4.5% and signaled this will remain the case through end 2024. Inflation has eased by more than expected but underlying gauges have not fallen by the same extent. Particularly worrying the Norges Bank is the larger than expected depreciation of the Norwegian krone. It is seen as a risk to the ongoing disinflation process. While the NB refrained from cutting rates, its governor Wolden Bache did note the time to do so is coming closer. The new policy rate forecasts entails a marginally steeper path down through 2025 (3.75% by end next year). Growth and inflation forecasts were little changed with a still above-target 2.4% inflation in 2027. The NOK is one of the top performers today. EUR/NOK is down from 11.77 to 11.66 with money markets paring bets for a December inaugural cut from 100% yesterday to just 60% today. The ECB’s 25 bps cut last week and especially the Fed’s 50 bps move yesterday probably created some dovish expectations going into the NB meeting today as well. The start of the easing cycle is now seen to take off in early 2025.
The Turkish central bank kept the policy rate steady at 50%. The expected decision was accompanied by a less anticipated drop in language that specifically endorsed further tightening “in case of a significant and persistent deterioration in inflation.” The central bank said that Q3 indicators suggest an ongoing slowdown in domestic demand, resulting in a diminishing inflationary impact. Goods inflation is low and an improvement in services inflation is expected to start next quarter. Both headline and core inflation were above 51% in August. While a significant 10 ppt improvement from the month before, it is still a long way from the central bank’s 38% end-of-year projection and still tenfold the official 5% target. Today’s dovish twist to the statement is seen as the beginning of a U-turn in CBRT policy, probably partially inspired by yesterday’s Fed decision. USD/TRY (34.02) is slightly down for the day but that is by far dollar driven. EUR/TRY by contrast ekes out a gain to just south of 38. The Turkish lira trades near record lows in both cases.
Graphs
EUR/NOK: NOK rallies as central bank pushes back against rate cut expectations for this year

US 10-yr yield extends comeback following FOMC meeting in bullish risk climate

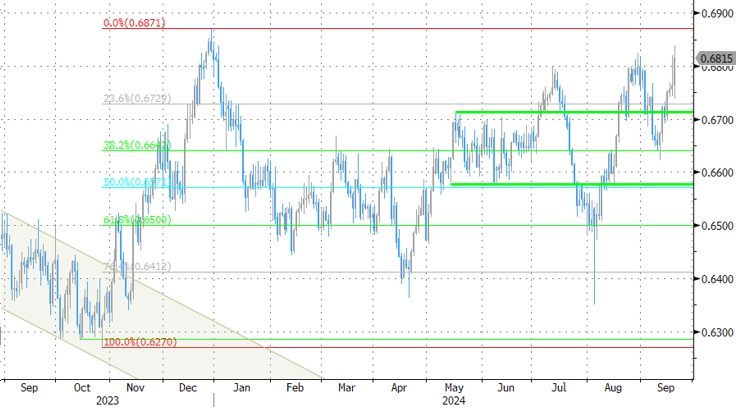
AUD/USD: Aussie labour market supports RBA’s higher-for-longer stance
EUR/GBP tests 0.84 support zone on BoE status quo but break lower becomes a touch nut to crack
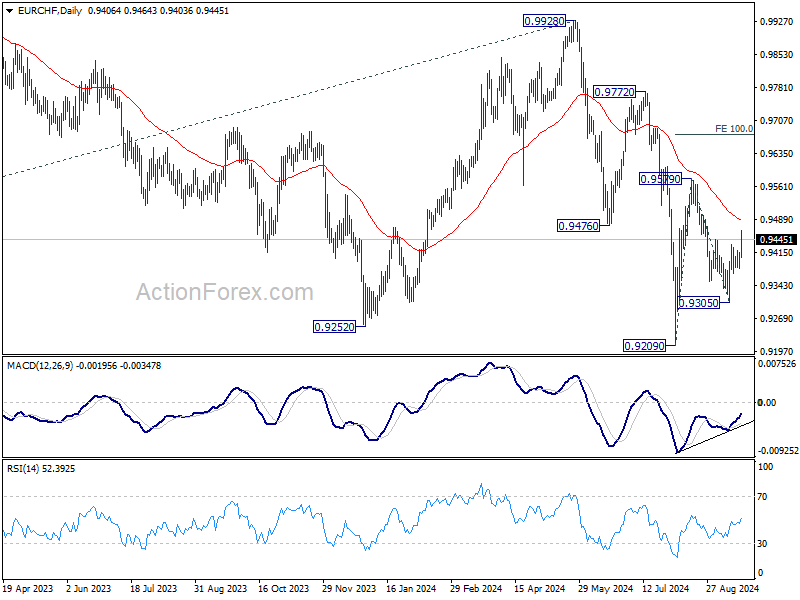
EUR/CHF Mid-Day Outlook
Daily Pivots: (S1) 0.9386; (P) 0.9405; (R1) 0.9427; More....
EUR/CHF's break of 0.9444 resistance suggests that pull back from 0.9579 has completed at 0.9305 already. Rise from there is seen as the third leg of the pattern from 0.9209. Intraday bias is back on the upside for 0.9579 resistance next. On the downside, below 0.9380 minor support will turn bias back to the downside for 0.9305 support instead.
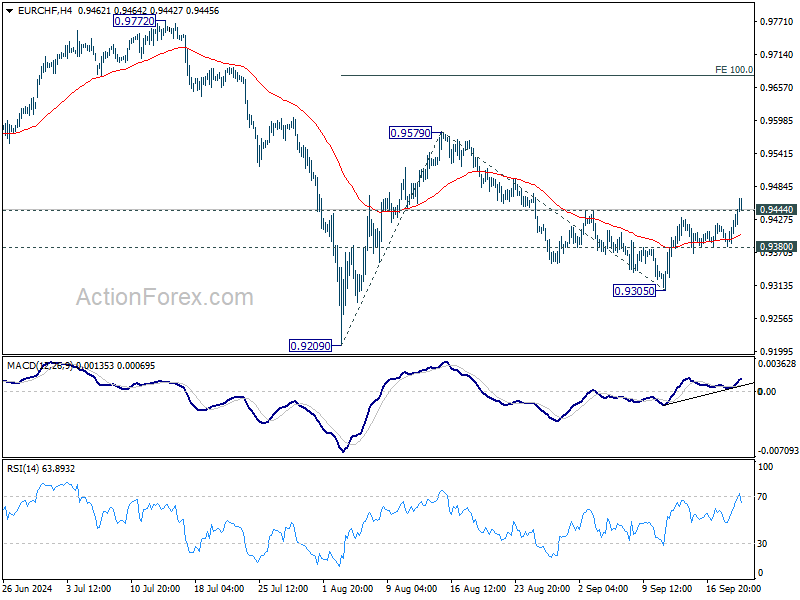
In the bigger picture, medium term corrective pattern from 0.9407 (2022 low) might have completed with three waves to 0.9928. Decisive break of 0.9252 (2023 low) will confirm long term down trend resumption. Next target will be 61.8% projection of 1.1149 to 0.9407 from 0.9928 at 0.8851. For now, outlook will stay bearish as long as 0.9928 resistance holds, even in case of strong rebound.
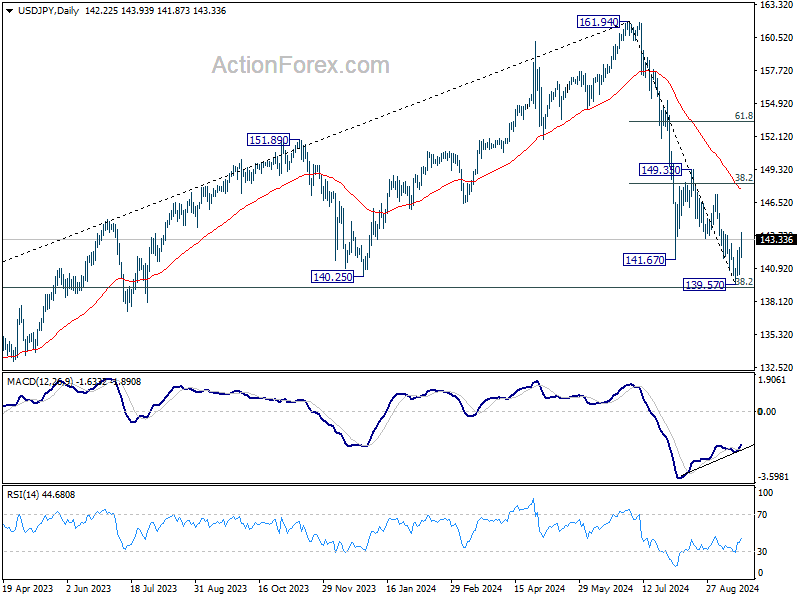
USD/JPY Mid-Day Outlook
Daily Pivots: (S1) 140.89; (P) 141.80; (R1) 143.16; More...
Intraday bias in USD/JPY remains mildly on the upside at this point. Rebound from 139.57 short term bottom should target 55 D EMA (now at 147.58), and possibly further to 38.2% retracement of 161.94 to 139.57 at 148.11. For now, risk will stay on the upside as long as 139.57 support holds, in case of retreat.
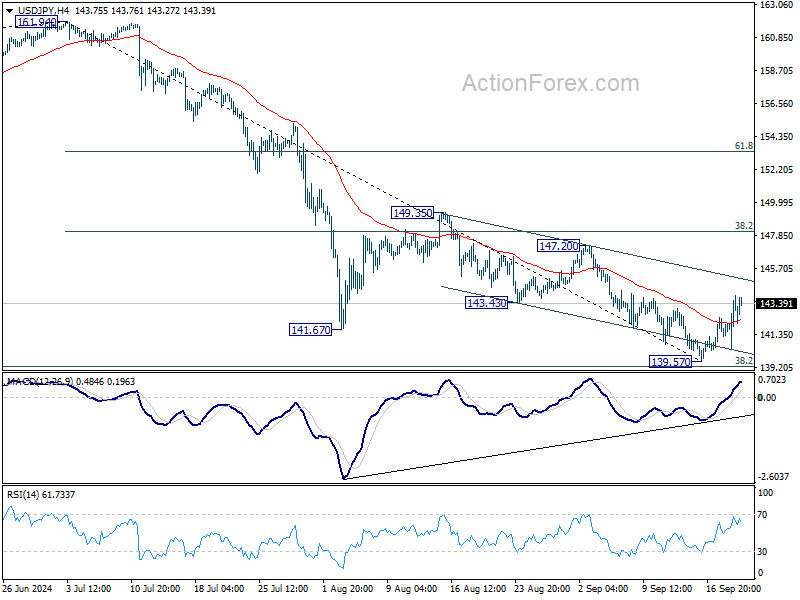
In the bigger picture, fall from 161.94 medium term top is seen as correcting whole up trend from 102.58 (2021 low). Strong support could be seen from 38.2% retracement of 102.58 to 161.94 at 139.26 to contain downside, at least on first attempt. But in any case, risk will stay on the downside as long as 149.35 resistance holds. Sustained break of 139.26 would open up deeper medium term decline to 61.8% retracement at 125.25.
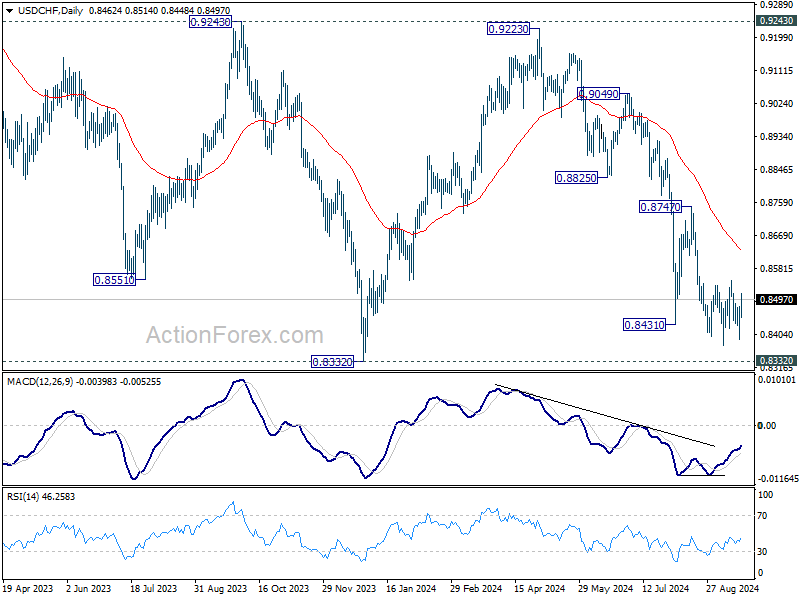
USD/CHF Mid-Day Outlook
Daily Pivots: (S1) 0.8409; (P) 0.8445; (R1) 0.8498; More…
Sideway trading continues in USD/CHF and intraday bias remains neutral. On the downside, break of 0.8374 will resume the fall from 0.9223 to retest 0.8332 low. Decisive break there will indicate larger down trend resumption. However, considering bullish convergence condition in 4H MACD, break of 0.8548 resistance will confirm short term bottoming, and turn bias back to the upside for 0.8747 resistance.
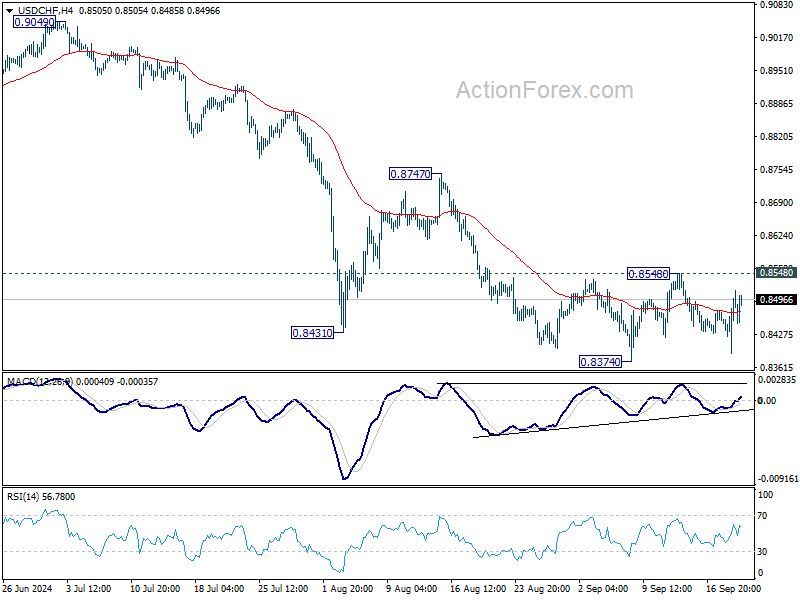
In the bigger picture, price actions from 0.8332 (2023 low) are currently seen as a medium term corrective pattern, with fall from 0.9223 as the second leg. Strong support could be seen from 0.8332 to bring rebound. Yet, overall outlook will continue to stay bearish as long as 0.9243 resistance holds. Firm break of 0.8332, however, will resume larger down trend from 1.0146 (2022 high).